| Param | Original file | Final file |
|---|---|---|
| Filename | modeM0/AS1A06_003T07_9000002818_18880cztM0_level2.evt | modeM0/AS1A06_003T07_9000002818_18880cztM0_level2_quad_clean.evt |
| Size (bytes) | 567,904,320 | 97,657,920 |
| Size | 541.6 MB | 93.1 MB |
| Events in quadrant A | 5,187,057 | 608,692 |
| Events in quadrant B | 3,729,846 | 644,609 |
| Events in quadrant C | 3,294,540 | 621,596 |
| Events in quadrant D | 4,519,367 | 601,115 |
| Mode SS | |||
|---|---|---|---|
| Quadrant | BADHDUFLAG | Total packets | Discarded packets |
| A | 0 | 140 | 0 |
| B | 0 | 140 | 0 |
| C | 0 | 140 | 0 |
| D | 0 | 140 | 0 |
| Mode M9 | |||
|---|---|---|---|
| Quadrant | BADHDUFLAG | Total packets | Discarded packets |
| A | 0 | 4 | 0 |
| B | 0 | 4 | 0 |
| C | 0 | 4 | 0 |
| D | 0 | 4 | 0 |
| Mode M0 | |||
|---|---|---|---|
| Quadrant | BADHDUFLAG | Total packets | Discarded packets |
| A | 0 | 20092 | 1 |
| B | 0 | 15673 | 1 |
| C | 0 | 14346 | 1 |
| D | 0 | 18253 | 1 |
| Quadrant | Total seconds | Saturated seconds | Saturation percentage |
|---|---|---|---|
| A | 6905 | 656 | 9.500362% |
| B | 6906 | 117 | 1.694179% |
| C | 6906 | 95 | 1.375615% |
| D | 6906 | 317 | 4.590211% |
Noise dominated data is calculated using 1-second bins in cleaned event files. If a bin has >2000 counts, and if more than 50% of those come from <1% of pixels, then it is considered to be noise-dominated and hence unusable.
| Quadrant | # 1 sec bins | Bins with >0 counts | Bins with >2000 counts | High rate bins dominated by noise | Noise dominated (total time) | Noise dominated (detector-on time) | Marked lightcurve |
|---|---|---|---|---|---|---|---|
| A | 7220 | 6906 | 575 | 575 | 7.96% | 8.33% | 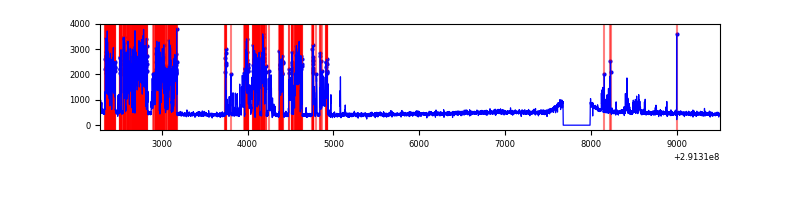 |
| B | 7221 | 6907 | 28 | 28 | 0.39% | 0.41% | 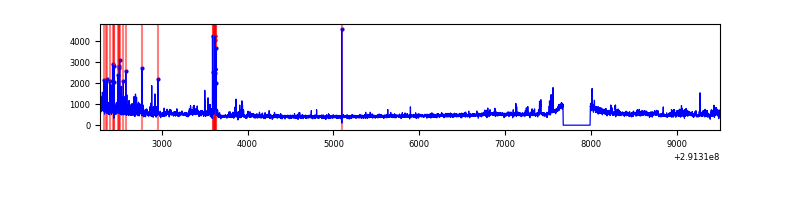 |
| C | 7221 | 6907 | 8 | 8 | 0.11% | 0.12% | 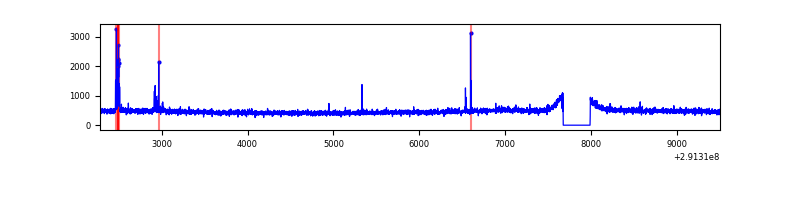 |
| D | 7221 | 6907 | 175 | 175 | 2.42% | 2.53% | 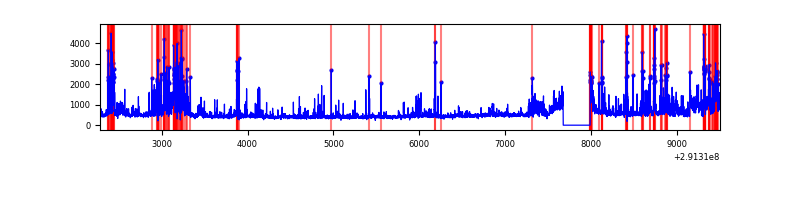 |
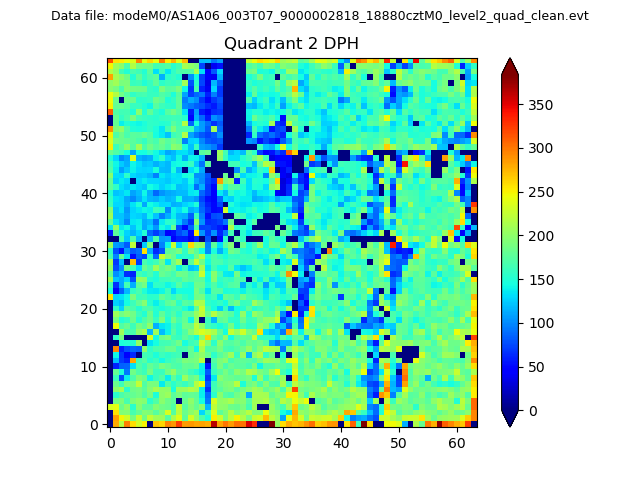
Top three noisy pixels from each quadrant. If the there are fewer than three noisy pixels in the level2.evt file, extra rows are filled as -1
| Pixel properties | Quadrant properties | ||||||
|---|---|---|---|---|---|---|---|
| Quadrant | DetID | PixID | Counts | Sigma | Mean | Median | Sigma |
| A | 6 | 16 | 2099770 | 12930.9 | 793 | 775 | 162.3 |
| A | 12 | 96 | 11344 | 65.11 | 793 | 775 | 162.3 |
| A | 13 | 254 | 9652 | 54.69 | 793 | 775 | 162.3 |
| B | 0 | 189 | 242698 | 1540.33 | 814 | 791 | 157.0 |
| B | 7 | 220 | 212414 | 1347.5 | 814 | 791 | 157.0 |
| B | 4 | 171 | 24301 | 149.7 | 814 | 791 | 157.0 |
| C | 14 | 238 | 121318 | 647.77 | 788 | 792 | 186.1 |
| C | 12 | 4 | 57757 | 306.16 | 788 | 792 | 186.1 |
| C | 5 | 4 | 14693 | 74.71 | 788 | 792 | 186.1 |
| D | 12 | 218 | 874408 | 4544.83 | 787 | 763 | 192.2 |
| D | 1 | 52 | 284331 | 1475.16 | 787 | 763 | 192.2 |
| D | 7 | 238 | 238069 | 1234.5 | 787 | 763 | 192.2 |
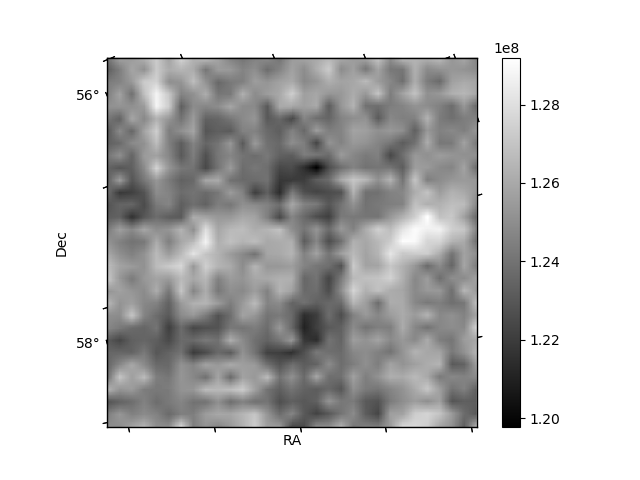
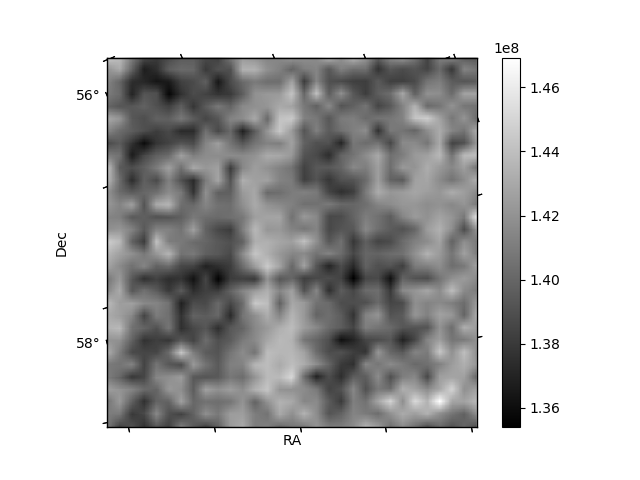
Histogram calculated using DETX and DETY for each event in the final _common_clean file
| Quadrant A | 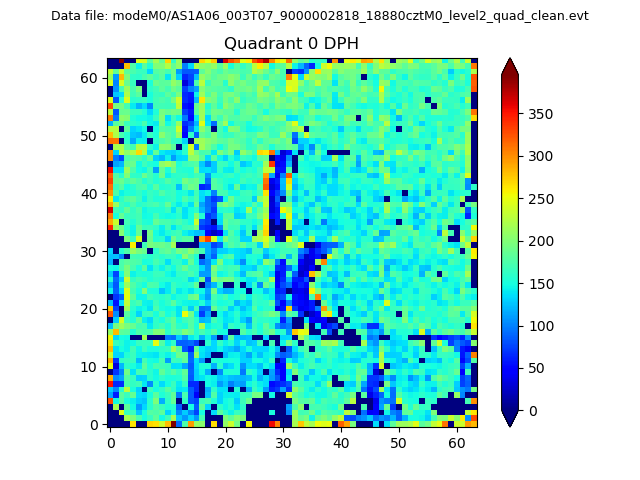 |
 |
Quadrant B |
|---|---|---|---|
| Quadrant D |  |
 |
Quadrant C |
| Plot type | Count rate plots | Images |
|---|---|---|
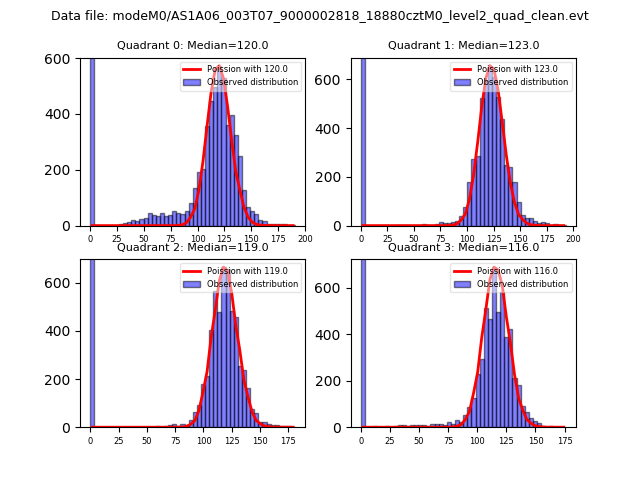
| Comparison with Poisson distribution Blue bars denote a histogram of data divided into 1 sec bins. Red curve is a Poisson curve with rate = median count rate of data. |
 |
 |
| Quadrant-wise count rates Data is divided into 100 sec bins |
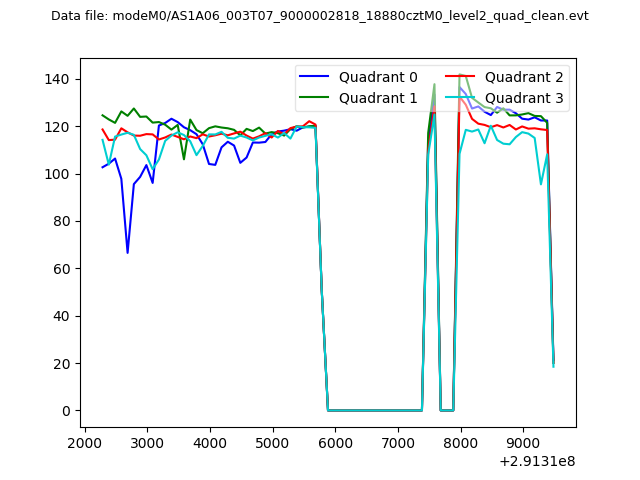 |
|
| Module-wise count rates for Quadrant A Data is divided into 100 sec bins |
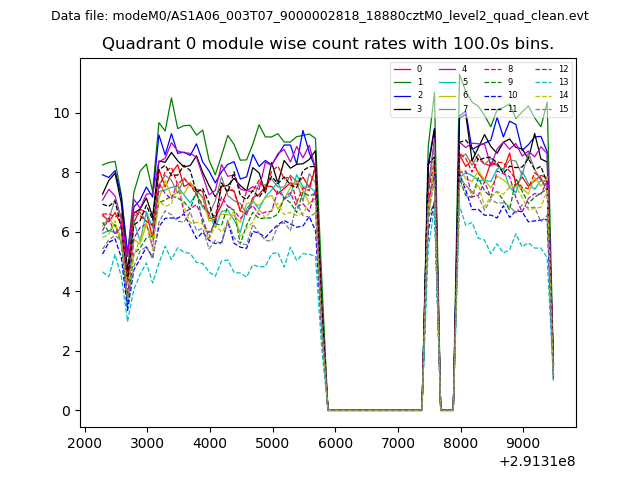 |
 |
| Module-wise count rates for Quadrant B Data is divided into 100 sec bins |
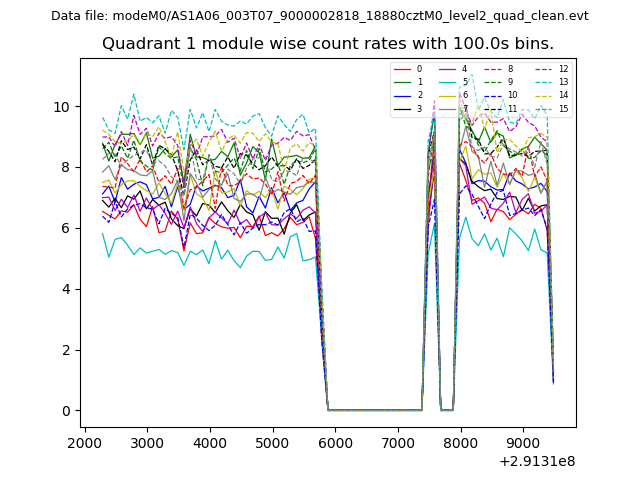 |
 |
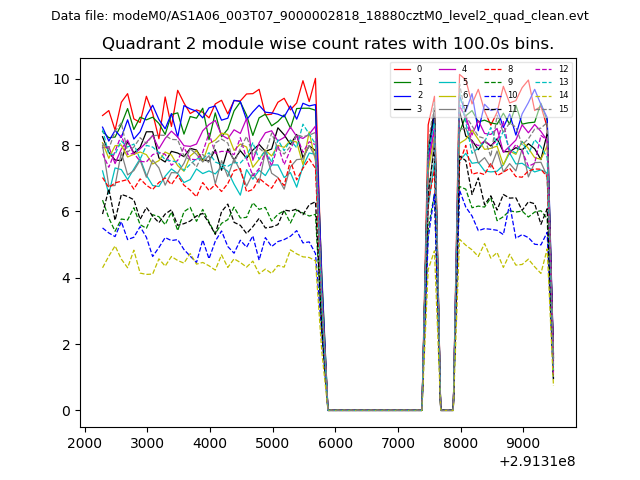
| Module-wise count rates for Quadrant C Data is divided into 100 sec bins |
 |
 |
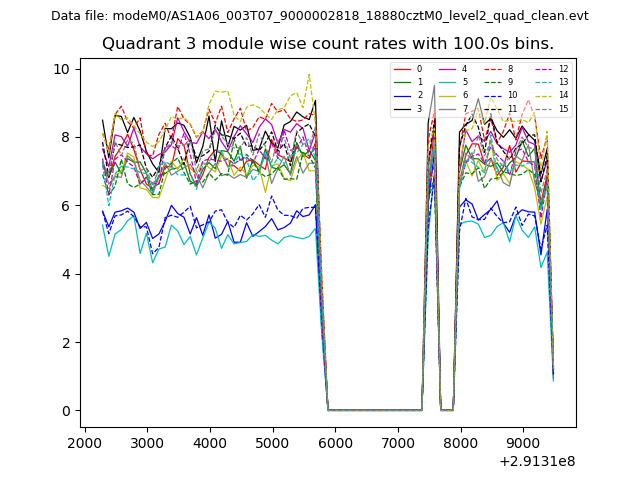
| Module-wise count rates for Quadrant D Data is divided into 100 sec bins |
 |
 |
| Parameter | Plot |
|---|---|
| CZT HV Monitor |  |
| D_VDD | 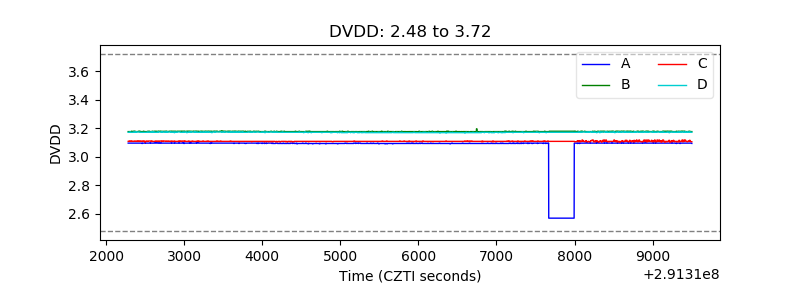 |
| Temperature 1 | 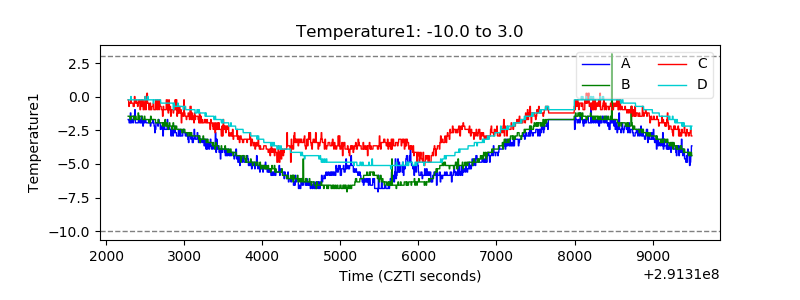 |
| Veto HV Monitor | 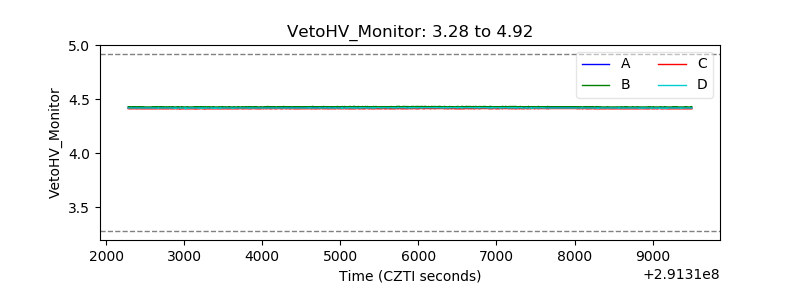 |
| Veto LLD | 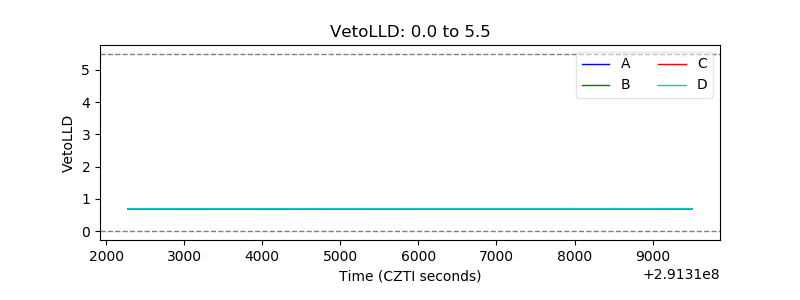 |
| Alpha Counter | 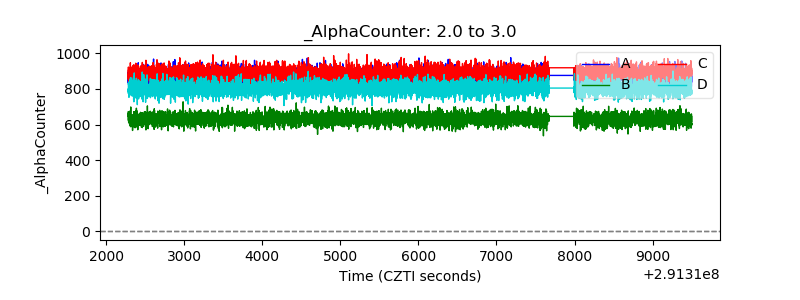 |
| _CPM_Rate | 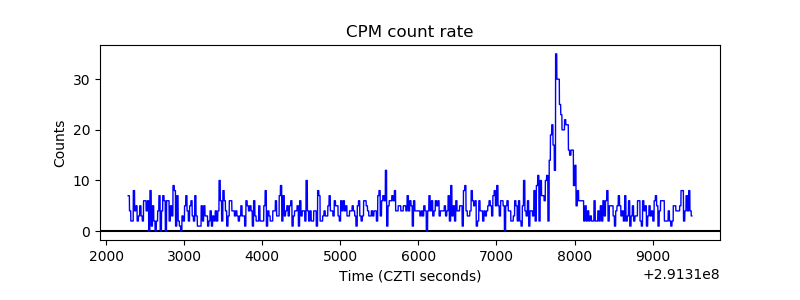 |
| CZT Counter | 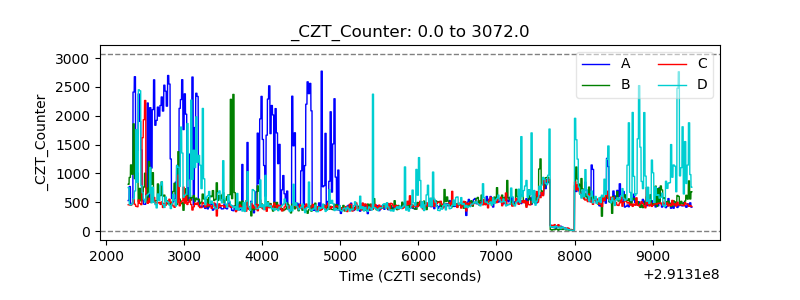 |
| +2.5 Volts monitor |  |
| +5 Volts monitor |  |
| _ROLL_ROT | 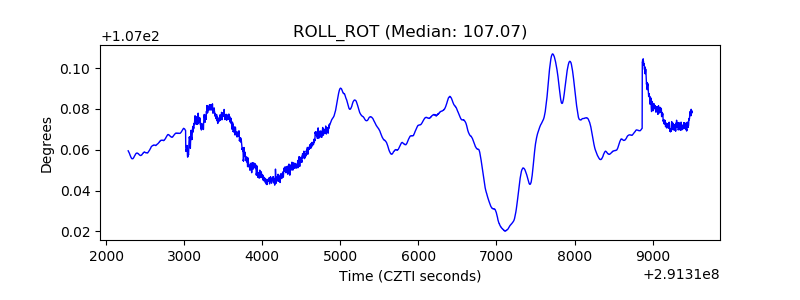 |
| _Roll_DEC | 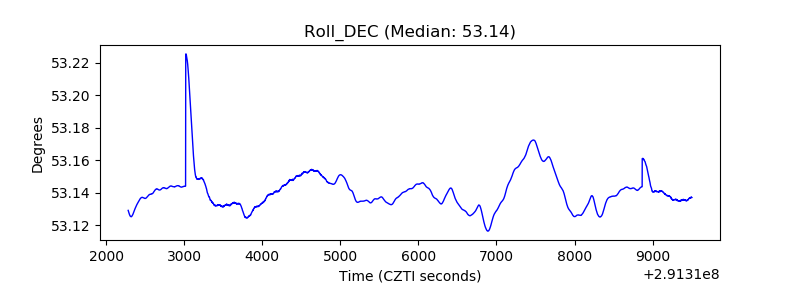 |
| _Roll_RA | 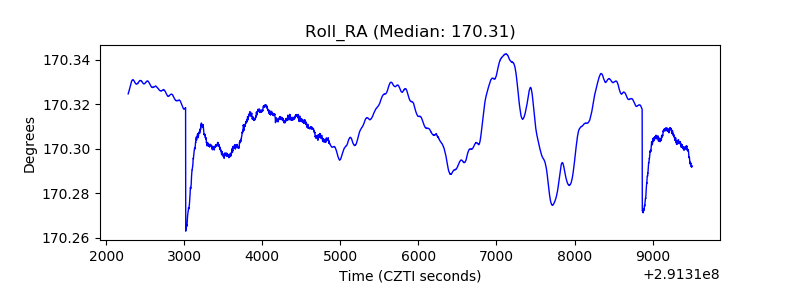 |
| Veto Counter | 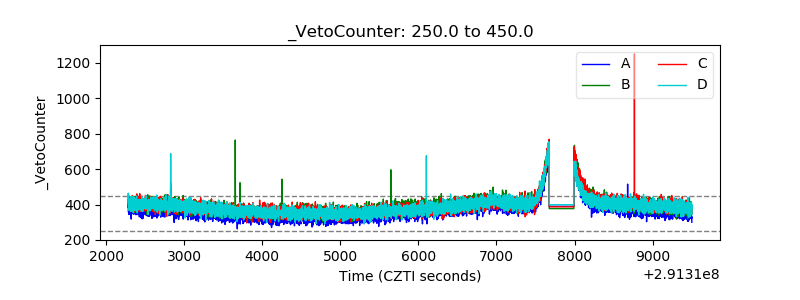 |