| Param | Original file | Final file |
|---|---|---|
| Filename | modeM0/AS1A06_003T07_9000002818_18883cztM0_level2.evt | modeM0/AS1A06_003T07_9000002818_18883cztM0_level2_quad_clean.evt |
| Size (bytes) | 1,418,506,560 | 246,893,760 |
| Size | 1.3 GB | 235.5 MB |
| Events in quadrant A | 11,138,339 | 1,565,505 |
| Events in quadrant B | 8,581,235 | 1,616,235 |
| Events in quadrant C | 8,319,757 | 1,568,445 |
| Events in quadrant D | 13,702,377 | 1,484,027 |
| Mode SS | |||
|---|---|---|---|
| Quadrant | BADHDUFLAG | Total packets | Discarded packets |
| A | 0 | 368 | 0 |
| B | 0 | 368 | 0 |
| C | 0 | 368 | 0 |
| D | 0 | 368 | 0 |
| Mode M9 | |||
|---|---|---|---|
| Quadrant | BADHDUFLAG | Total packets | Discarded packets |
| A | 0 | 20 | 0 |
| B | 0 | 20 | 0 |
| C | 0 | 20 | 0 |
| D | 0 | 20 | 0 |
| Mode M0 | |||
|---|---|---|---|
| Quadrant | BADHDUFLAG | Total packets | Discarded packets |
| A | 0 | 45398 | 3 |
| B | 0 | 37772 | 3 |
| C | 0 | 36831 | 3 |
| D | 0 | 53189 | 3 |
| Quadrant | Total seconds | Saturated seconds | Saturation percentage |
|---|---|---|---|
| A | 18033 | 787 | 4.364221% |
| B | 18033 | 129 | 0.715355% |
| C | 18034 | 182 | 1.009205% |
| D | 18034 | 1194 | 6.620827% |
Noise dominated data is calculated using 1-second bins in cleaned event files. If a bin has >2000 counts, and if more than 50% of those come from <1% of pixels, then it is considered to be noise-dominated and hence unusable.
| Quadrant | # 1 sec bins | Bins with >0 counts | Bins with >2000 counts | High rate bins dominated by noise | Noise dominated (total time) | Noise dominated (detector-on time) | Marked lightcurve |
|---|---|---|---|---|---|---|---|
| A | 20068 | 18036 | 592 | 592 | 2.95% | 3.28% | 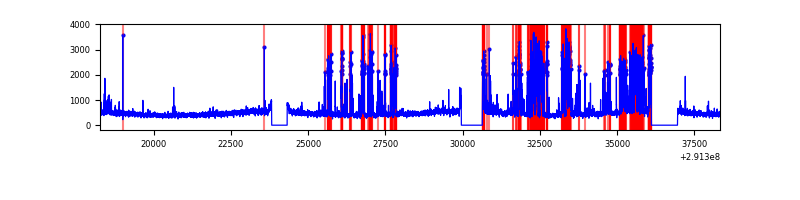 |
| B | 20068 | 18036 | 10 | 10 | 0.05% | 0.06% | 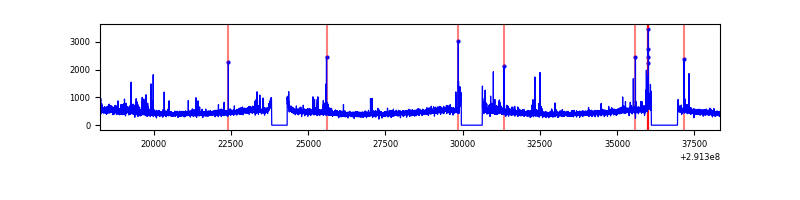 |
| C | 20069 | 18037 | 1 | 1 | 0.00% | 0.01% | 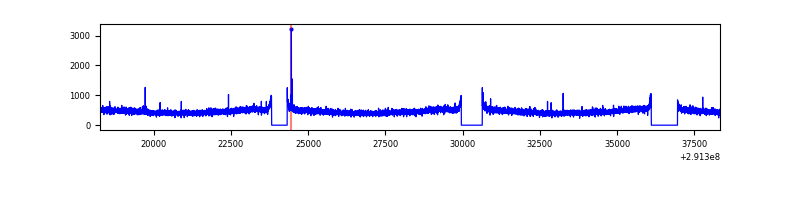 |
| D | 20069 | 18037 | 915 | 915 | 4.56% | 5.07% | 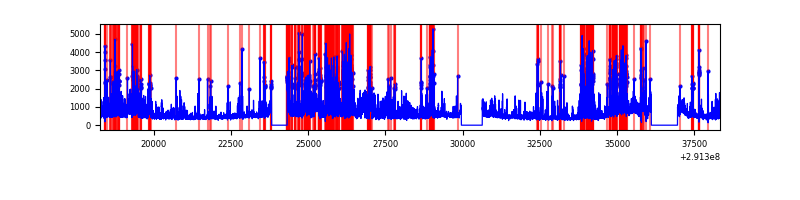 |
Top three noisy pixels from each quadrant. If the there are fewer than three noisy pixels in the level2.evt file, extra rows are filled as -1
| Pixel properties | Quadrant properties | ||||||
|---|---|---|---|---|---|---|---|
| Quadrant | DetID | PixID | Counts | Sigma | Mean | Median | Sigma |
| A | 6 | 16 | 3029972 | 7245.48 | 2071 | 2029 | 417.9 |
| A | 0 | 13 | 43472 | 99.17 | 2071 | 2029 | 417.9 |
| A | 12 | 96 | 37781 | 85.55 | 2071 | 2029 | 417.9 |
| B | 0 | 189 | 139879 | 346.08 | 2100 | 2040 | 398.3 |
| B | 7 | 220 | 73538 | 179.51 | 2100 | 2040 | 398.3 |
| B | 0 | 230 | 54574 | 131.9 | 2100 | 2040 | 398.3 |
| C | 14 | 238 | 316987 | 665.86 | 2027 | 2035 | 473.0 |
| C | 3 | 233 | 41415 | 83.26 | 2027 | 2035 | 473.0 |
| C | 8 | 128 | 21475 | 41.1 | 2027 | 2035 | 473.0 |
| D | 12 | 218 | 1918610 | 3942.39 | 2002 | 1945 | 486.2 |
| D | 7 | 238 | 1440359 | 2958.67 | 2002 | 1945 | 486.2 |
| D | 12 | 1 | 1206788 | 2478.24 | 2002 | 1945 | 486.2 |
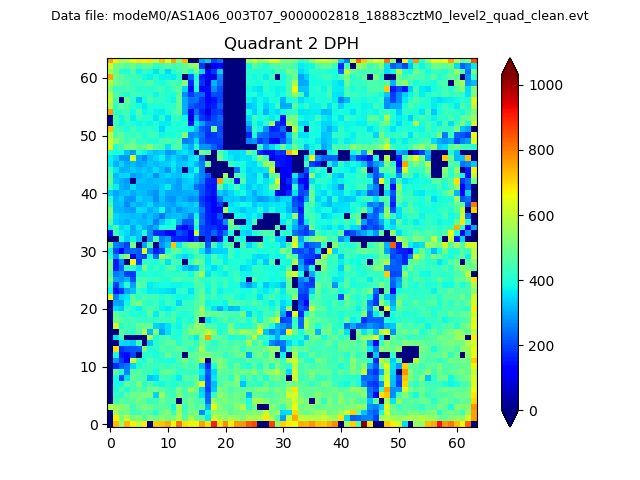
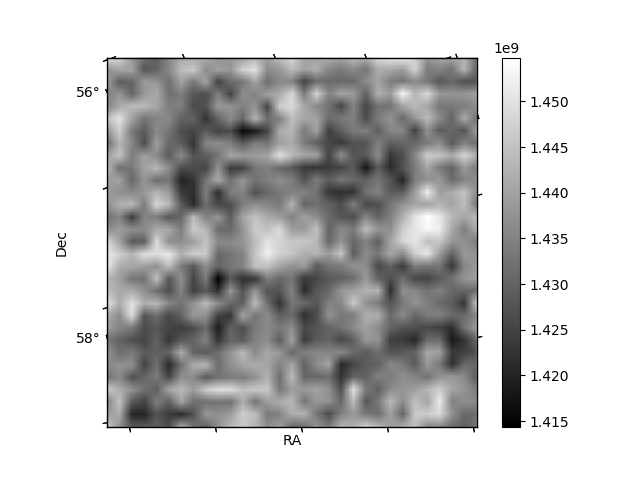
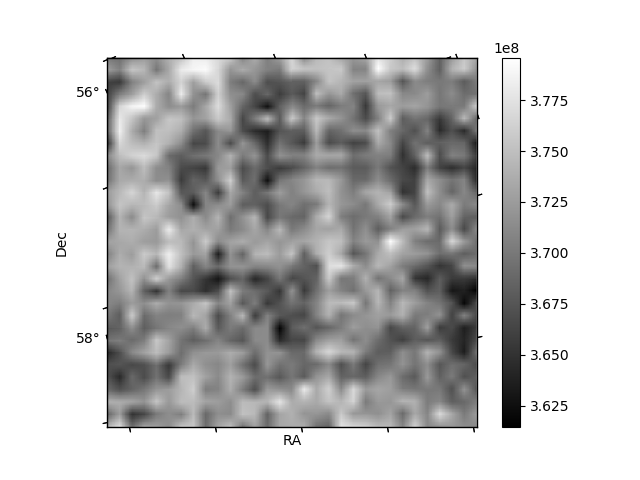
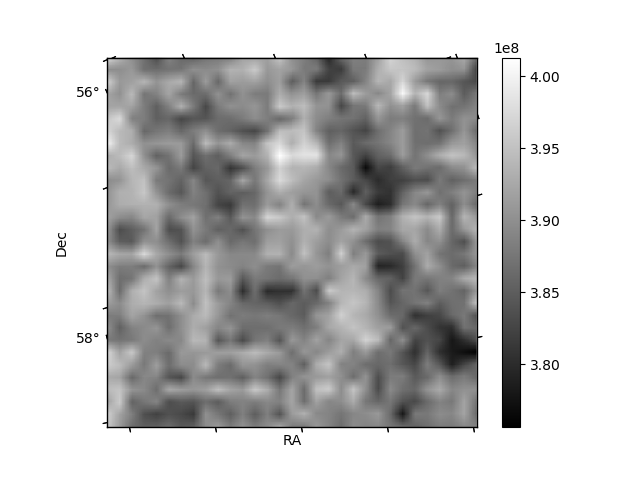
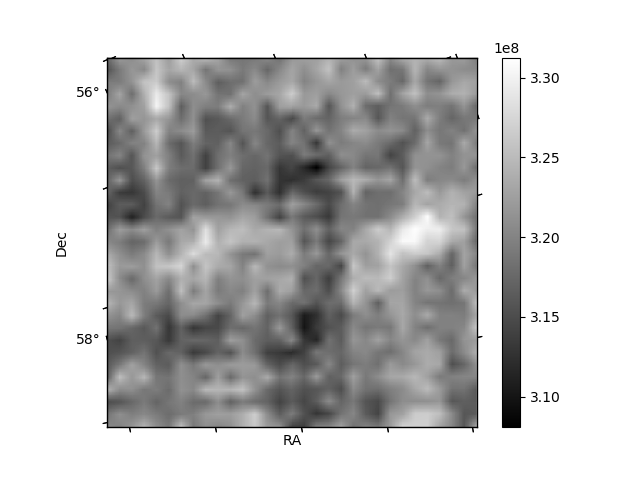
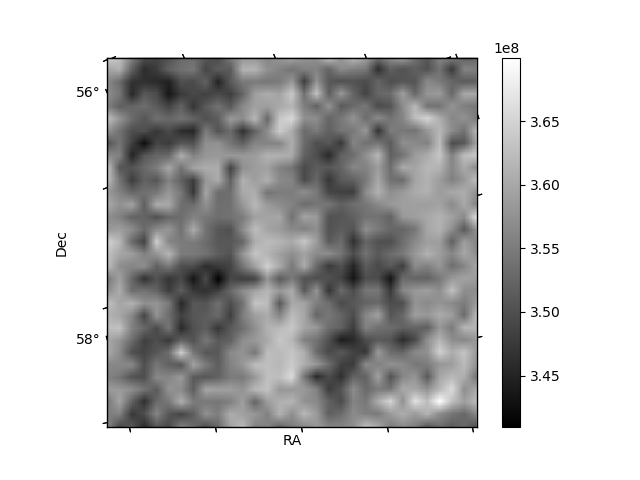
Histogram calculated using DETX and DETY for each event in the final _common_clean file
| Quadrant A | 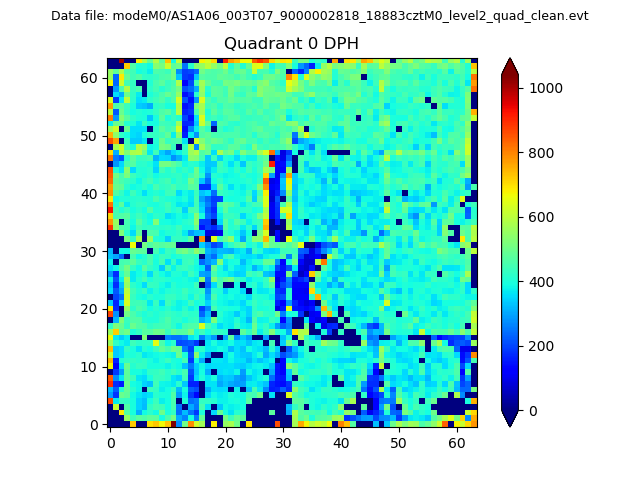 |
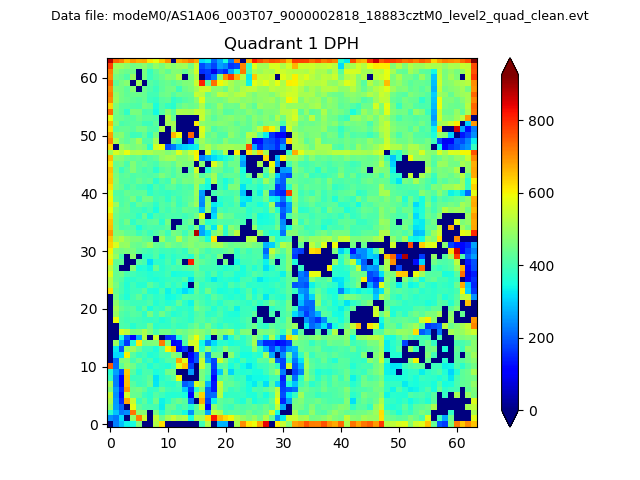 |
Quadrant B |
|---|---|---|---|
| Quadrant D | 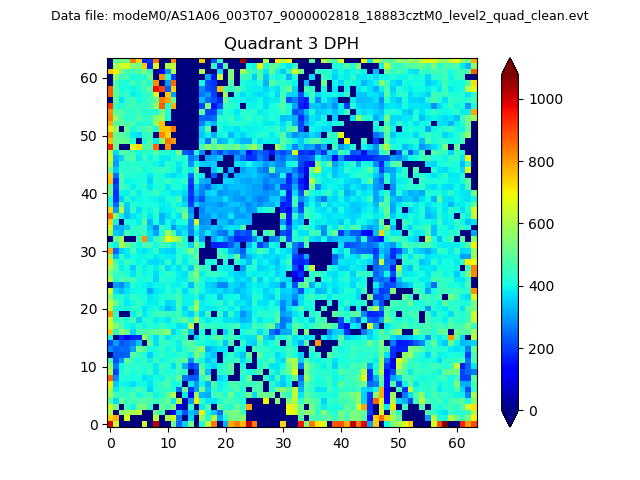 |
 |
Quadrant C |
| Plot type | Count rate plots | Images |
|---|---|---|
| Comparison with Poisson distribution Blue bars denote a histogram of data divided into 1 sec bins. Red curve is a Poisson curve with rate = median count rate of data. |
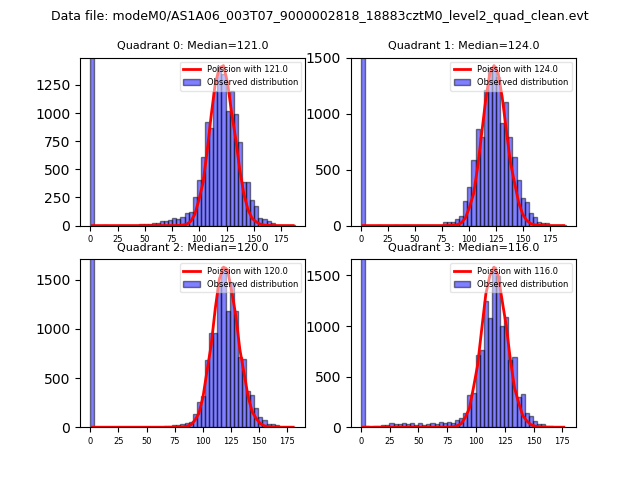 |
 |
| Quadrant-wise count rates Data is divided into 100 sec bins |
 |
|
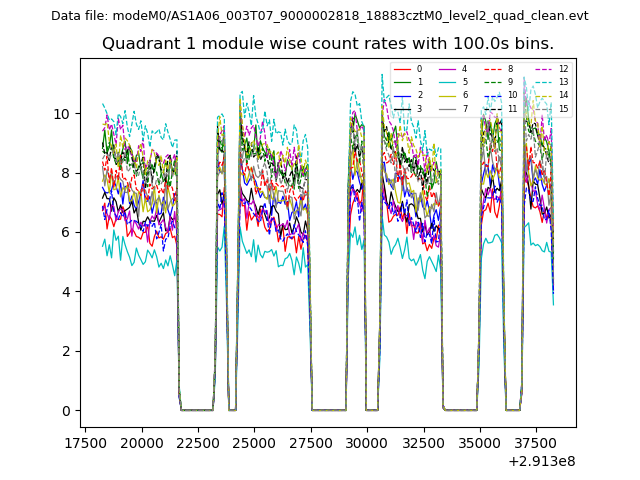
| Module-wise count rates for Quadrant A Data is divided into 100 sec bins |
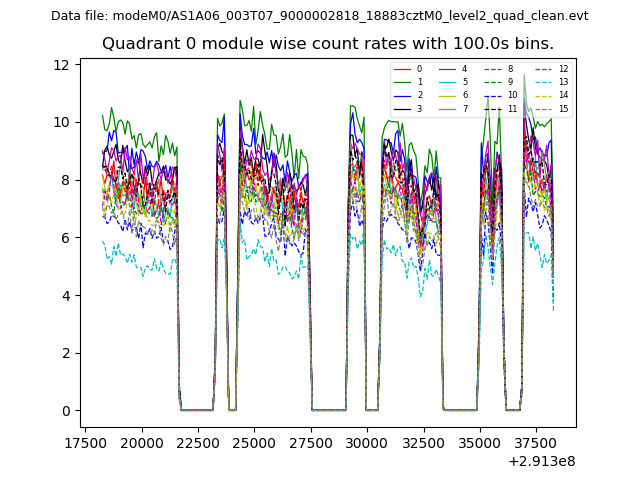 |
 |
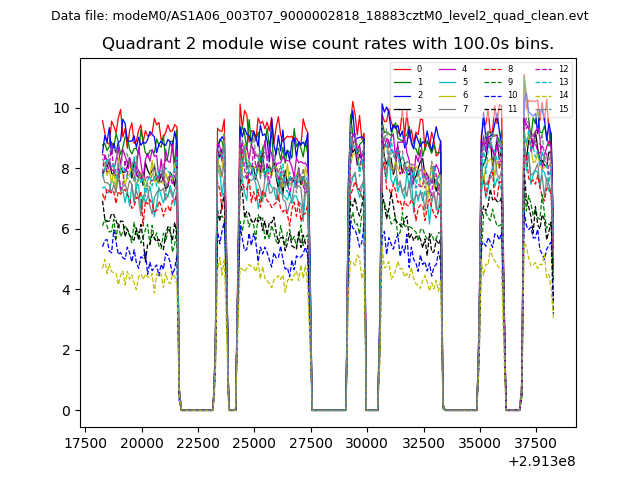
| Module-wise count rates for Quadrant B Data is divided into 100 sec bins |
 |
 |
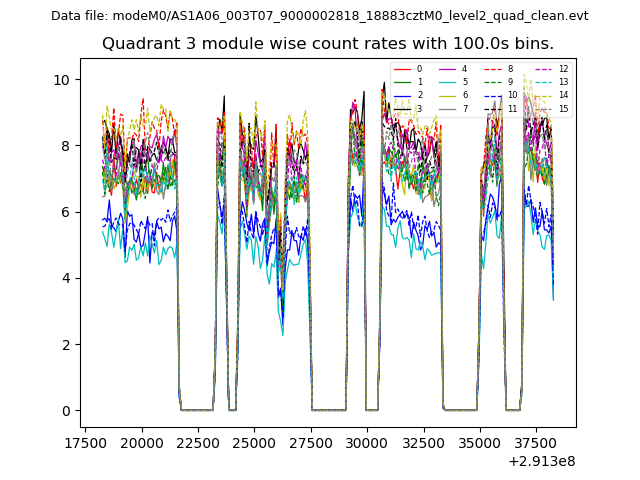
| Module-wise count rates for Quadrant C Data is divided into 100 sec bins |
 |
 |
| Module-wise count rates for Quadrant D Data is divided into 100 sec bins |
 |
 |
| Parameter | Plot |
|---|---|
| CZT HV Monitor |  |
| D_VDD | 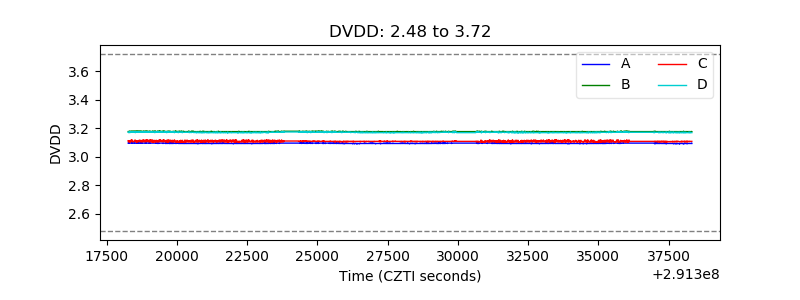 |
| Temperature 1 | 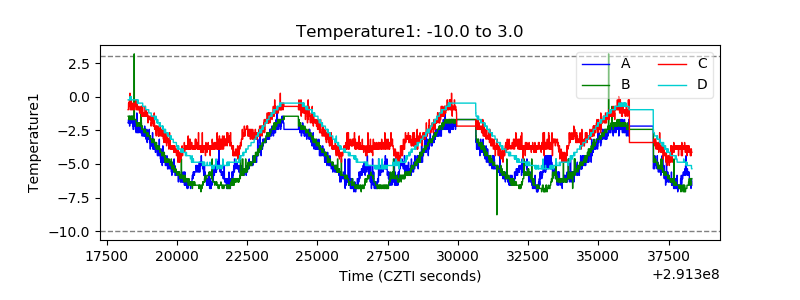 |
| Veto HV Monitor | 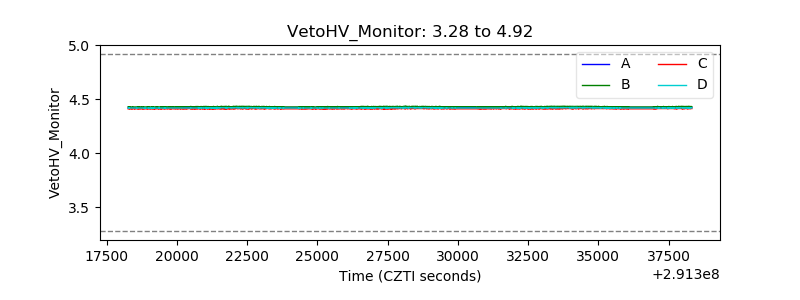 |
| Veto LLD | 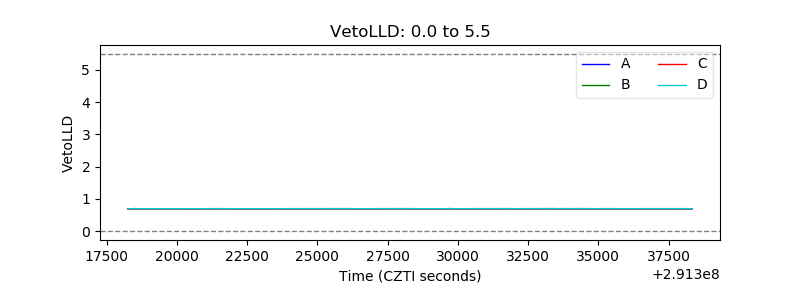 |
| Alpha Counter | 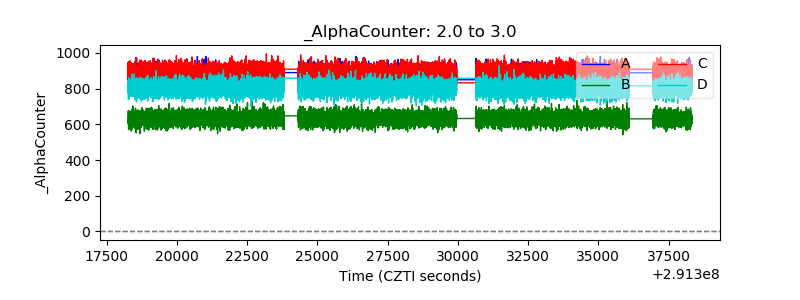 |
| _CPM_Rate | 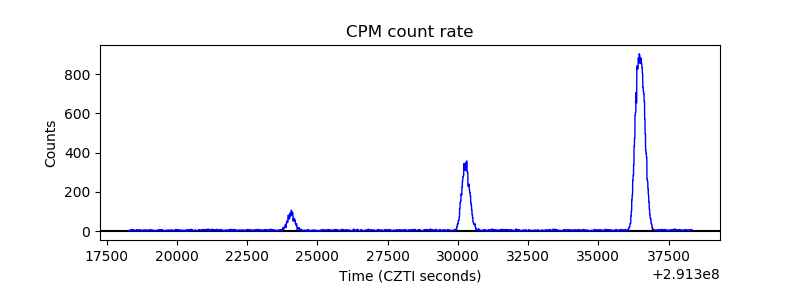 |
| CZT Counter | 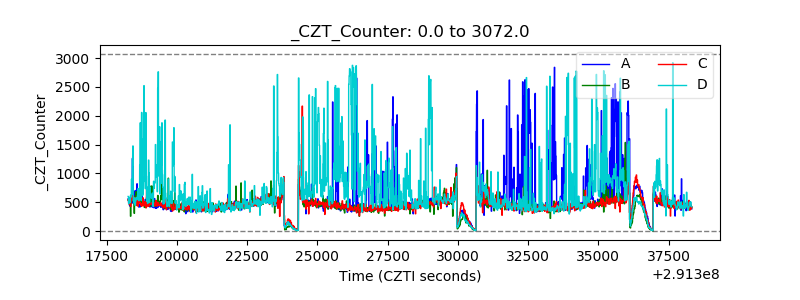 |
| +2.5 Volts monitor | 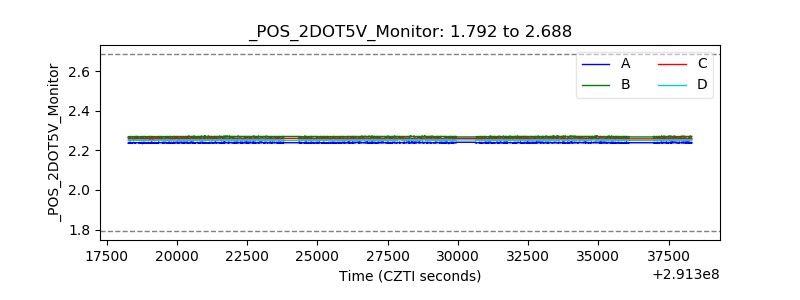 |
| +5 Volts monitor |  |
| _ROLL_ROT | 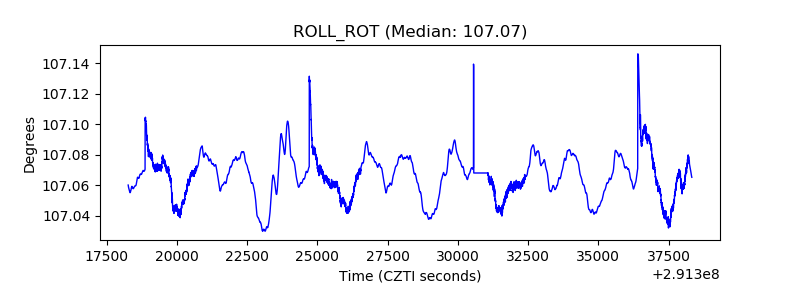 |
| _Roll_DEC | 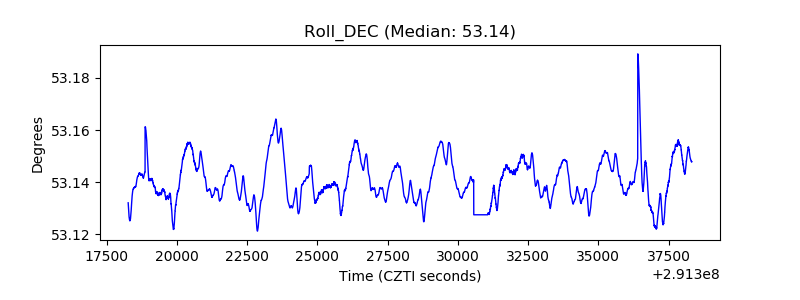 |
| _Roll_RA | 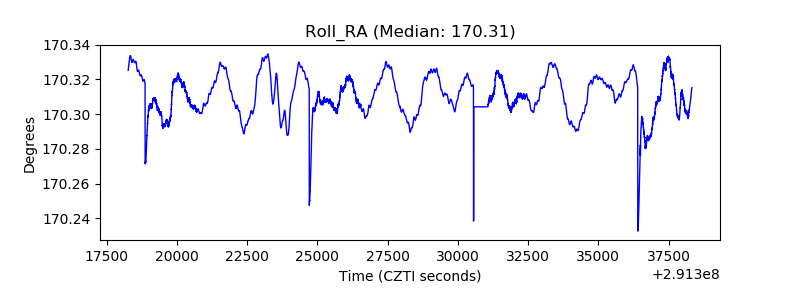 |
| Veto Counter | 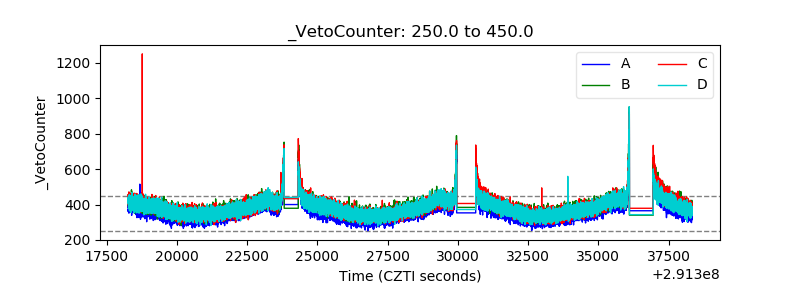 |