| Param | Original file | Final file |
|---|---|---|
| Filename | modeM0/AS1A06_003T07_9000002818_18886cztM0_level2.evt | modeM0/AS1A06_003T07_9000002818_18886cztM0_level2_quad_clean.evt |
| Size (bytes) | 487,630,080 | 100,872,000 |
| Size | 465.0 MB | 96.2 MB |
| Events in quadrant A | 3,780,510 | 656,427 |
| Events in quadrant B | 3,260,061 | 679,417 |
| Events in quadrant C | 3,088,842 | 646,323 |
| Events in quadrant D | 4,198,739 | 620,931 |
| Mode SS | |||
|---|---|---|---|
| Quadrant | BADHDUFLAG | Total packets | Discarded packets |
| A | 0 | 130 | 0 |
| B | 0 | 130 | 0 |
| C | 0 | 130 | 0 |
| D | 0 | 130 | 0 |
| Mode M9 | |||
|---|---|---|---|
| Quadrant | BADHDUFLAG | Total packets | Discarded packets |
| A | 0 | 16 | 0 |
| B | 0 | 17 | 0 |
| C | 0 | 17 | 0 |
| D | 0 | 17 | 0 |
| Mode M0 | |||
|---|---|---|---|
| Quadrant | BADHDUFLAG | Total packets | Discarded packets |
| A | 0 | 15585 | 4 |
| B | 0 | 13907 | 2 |
| C | 0 | 13348 | 2 |
| D | 0 | 16898 | 2 |
| Quadrant | Total seconds | Saturated seconds | Saturation percentage |
|---|---|---|---|
| A | 6484 | 145 | 2.236274% |
| B | 6484 | 37 | 0.570635% |
| C | 6484 | 36 | 0.555213% |
| D | 6484 | 137 | 2.112893% |
Noise dominated data is calculated using 1-second bins in cleaned event files. If a bin has >2000 counts, and if more than 50% of those come from <1% of pixels, then it is considered to be noise-dominated and hence unusable.
| Quadrant | # 1 sec bins | Bins with >0 counts | Bins with >2000 counts | High rate bins dominated by noise | Noise dominated (total time) | Noise dominated (detector-on time) | Marked lightcurve |
|---|---|---|---|---|---|---|---|
| A | 7634 | 6485 | 81 | 81 | 1.06% | 1.25% | 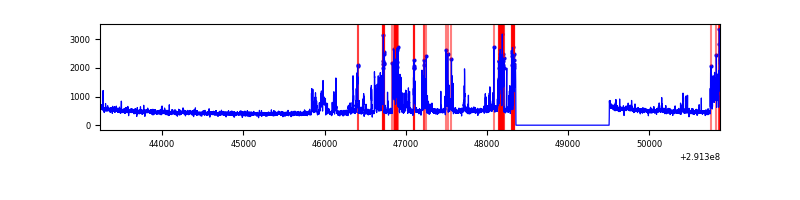 |
| B | 7634 | 6485 | 7 | 7 | 0.09% | 0.11% | 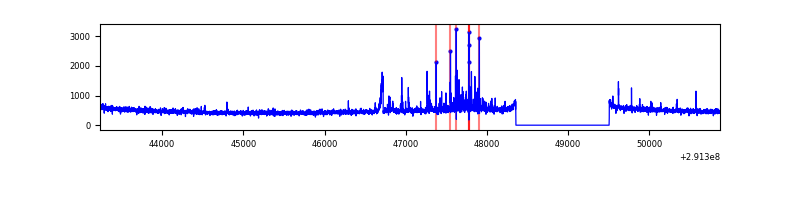 |
| C | 7634 | 6485 | 0 | 0 | 0.00% | 0.00% | 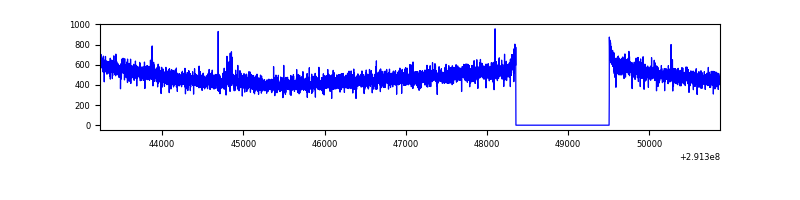 |
| D | 7634 | 6485 | 96 | 96 | 1.26% | 1.48% | 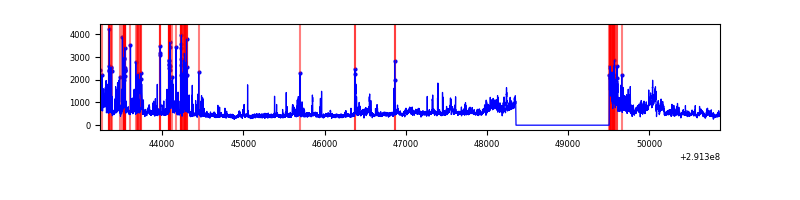 |
Top three noisy pixels from each quadrant. If the there are fewer than three noisy pixels in the level2.evt file, extra rows are filled as -1
| Pixel properties | Quadrant properties | ||||||
|---|---|---|---|---|---|---|---|
| Quadrant | DetID | PixID | Counts | Sigma | Mean | Median | Sigma |
| A | 6 | 16 | 769452 | 4915.94 | 778 | 762 | 156.4 |
| A | 13 | 254 | 10342 | 61.27 | 778 | 762 | 156.4 |
| A | 14 | 111 | 7711 | 44.44 | 778 | 762 | 156.4 |
| B | 7 | 220 | 77784 | 515.89 | 786 | 766 | 149.3 |
| B | 0 | 189 | 60526 | 400.29 | 786 | 766 | 149.3 |
| B | 0 | 190 | 19697 | 126.81 | 786 | 766 | 149.3 |
| C | 14 | 238 | 117865 | 665.62 | 752 | 756 | 175.9 |
| C | 3 | 233 | 30346 | 168.18 | 752 | 756 | 175.9 |
| C | 12 | 4 | 7435 | 37.96 | 752 | 756 | 175.9 |
| D | 9 | 1 | 357655 | 1987.13 | 749 | 728 | 179.6 |
| D | 1 | 52 | 347888 | 1932.76 | 749 | 728 | 179.6 |
| D | 12 | 110 | 325444 | 1807.8 | 749 | 728 | 179.6 |
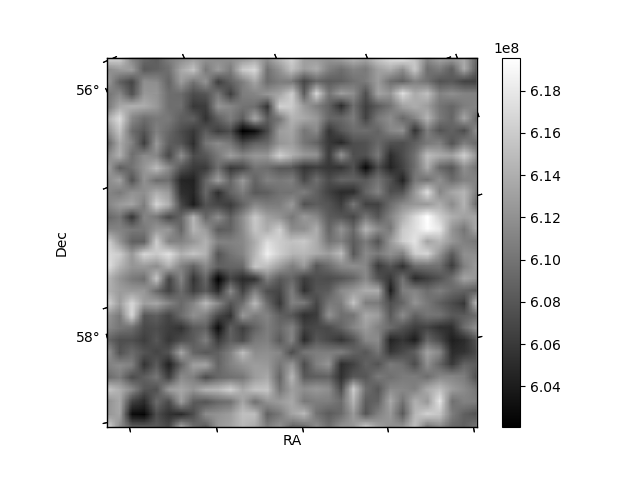
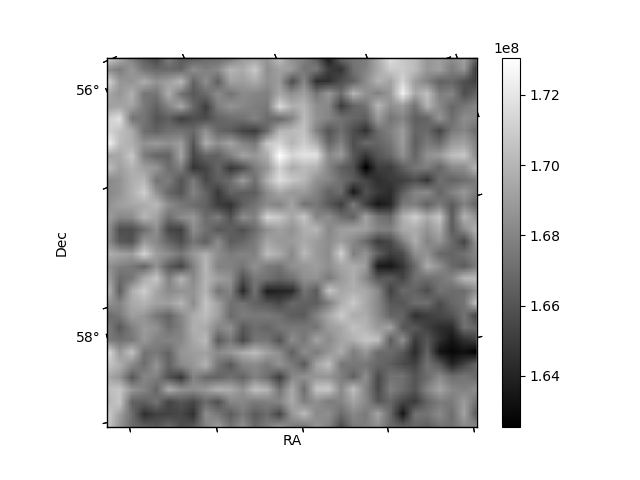
Histogram calculated using DETX and DETY for each event in the final _common_clean file
| Quadrant A | 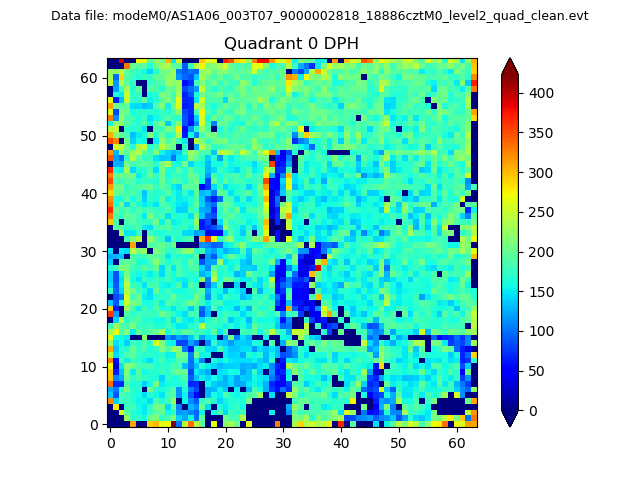 |
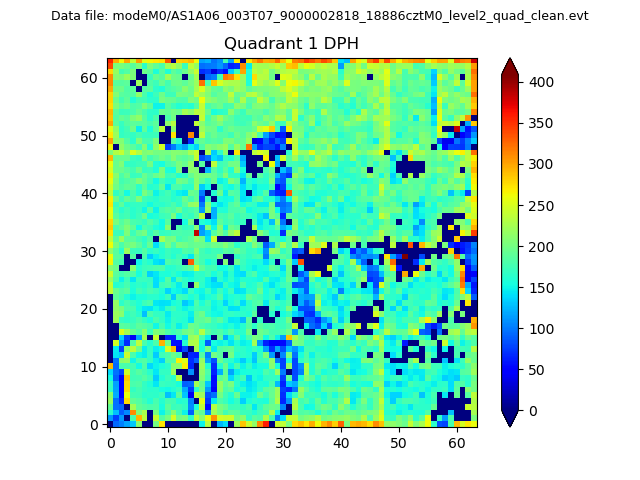 |
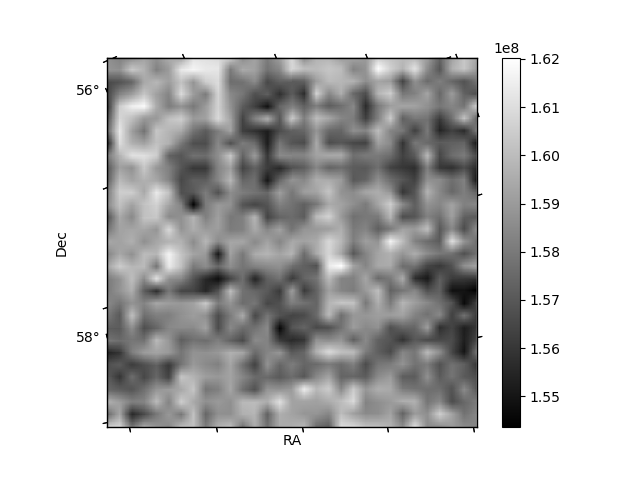
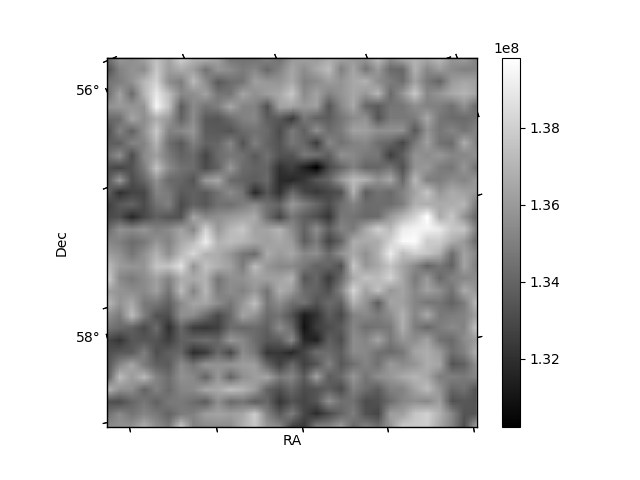
Quadrant B |
|---|---|---|---|
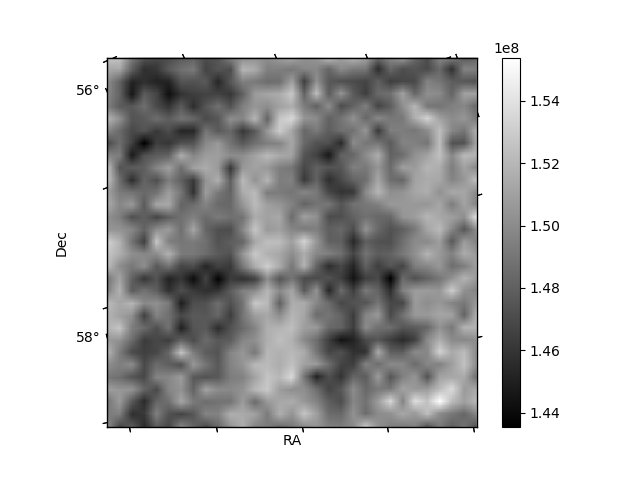
| Quadrant D |  |
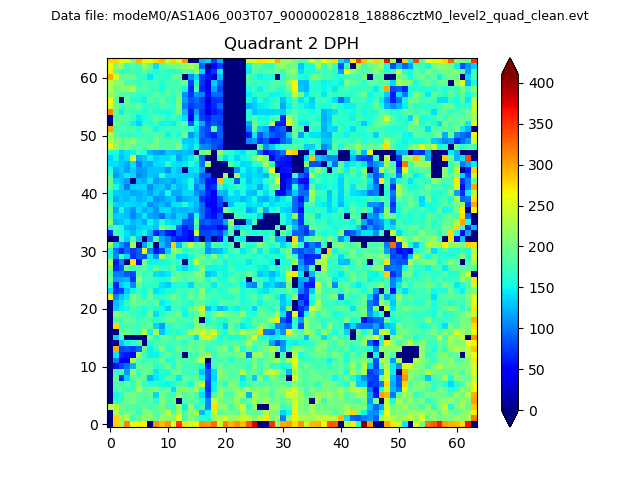 |
Quadrant C |
| Plot type | Count rate plots | Images |
|---|---|---|
| Comparison with Poisson distribution Blue bars denote a histogram of data divided into 1 sec bins. Red curve is a Poisson curve with rate = median count rate of data. |
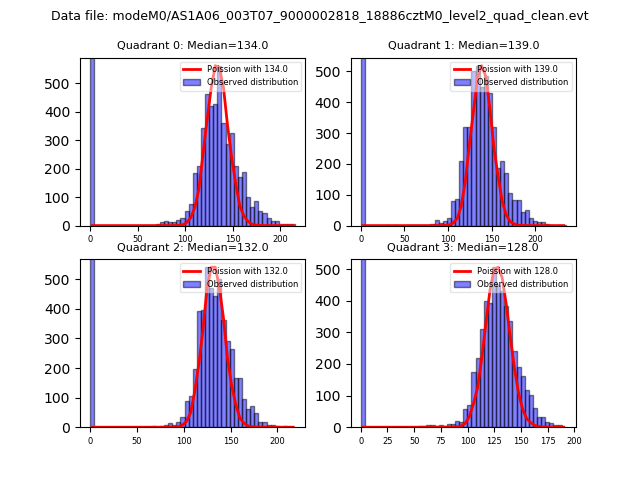 |
 |
| Quadrant-wise count rates Data is divided into 100 sec bins |
 |
|
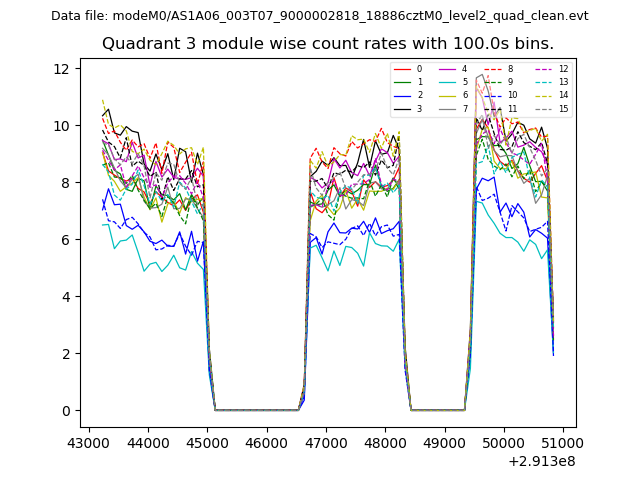
| Module-wise count rates for Quadrant A Data is divided into 100 sec bins |
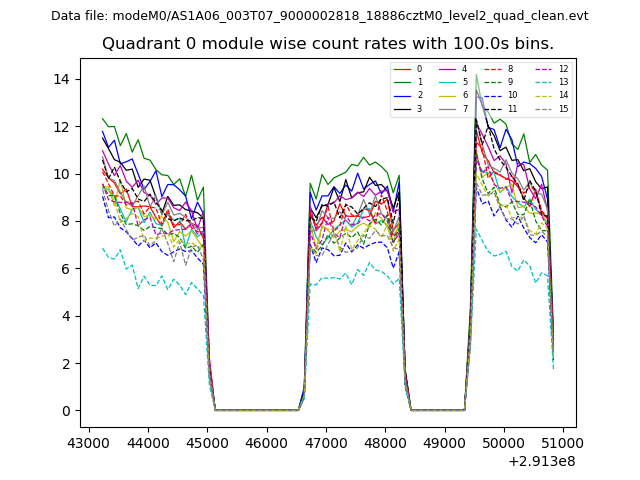 |
 |
| Module-wise count rates for Quadrant B Data is divided into 100 sec bins |
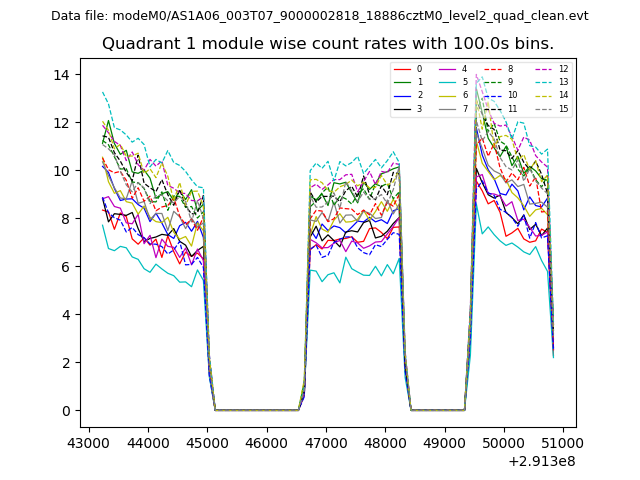 |
 |
| Module-wise count rates for Quadrant C Data is divided into 100 sec bins |
 |
 |
| Module-wise count rates for Quadrant D Data is divided into 100 sec bins |
 |
 |
| Parameter | Plot |
|---|---|
| CZT HV Monitor | 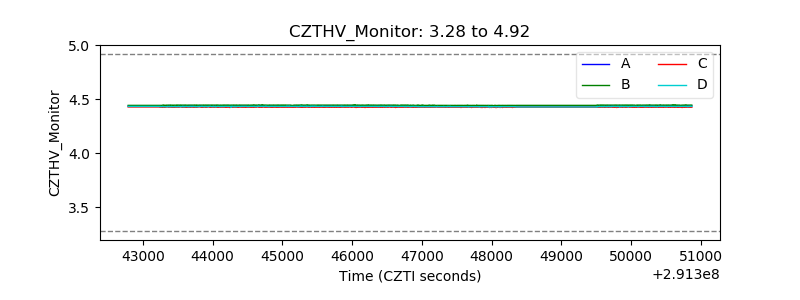 |
| D_VDD | 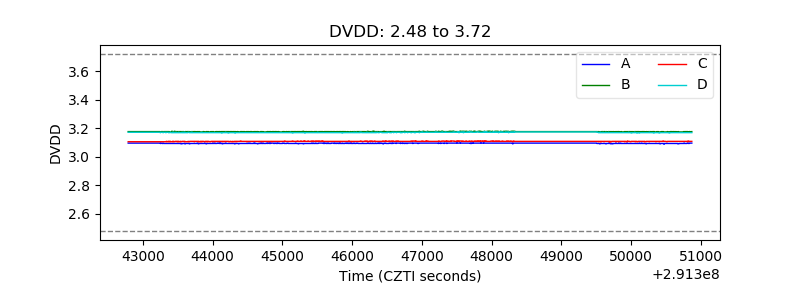 |
| Temperature 1 | 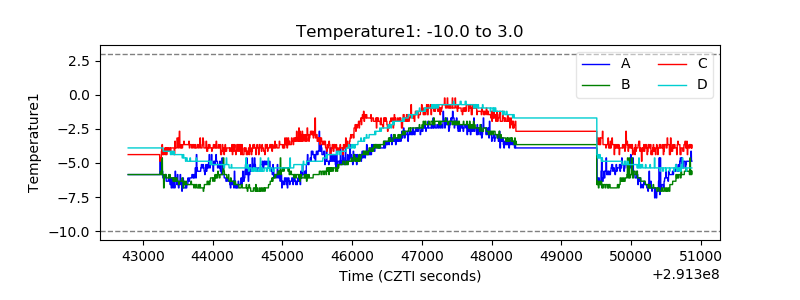 |
| Veto HV Monitor | 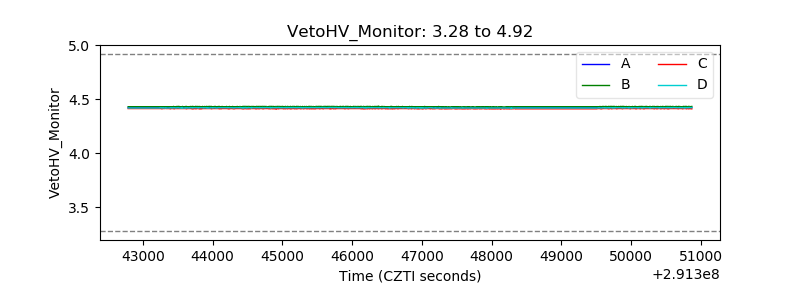 |
| Veto LLD | 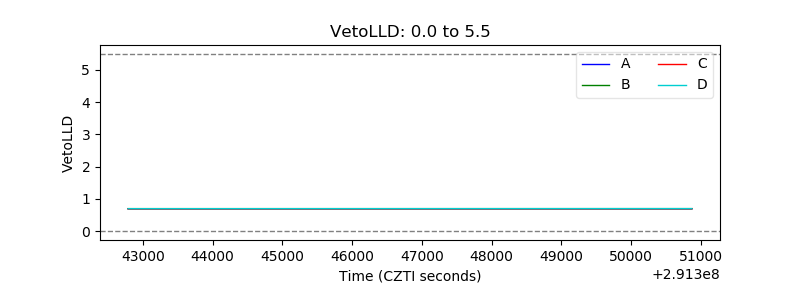 |
| Alpha Counter | 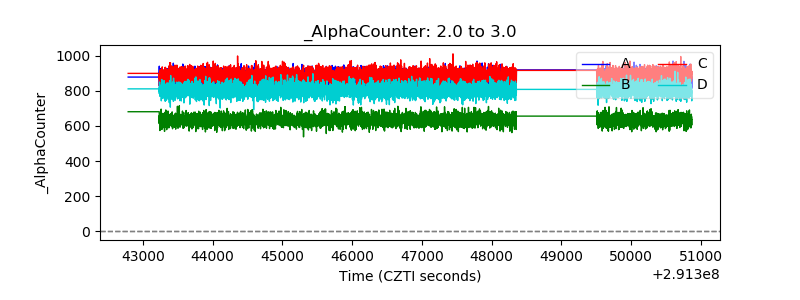 |
| _CPM_Rate | 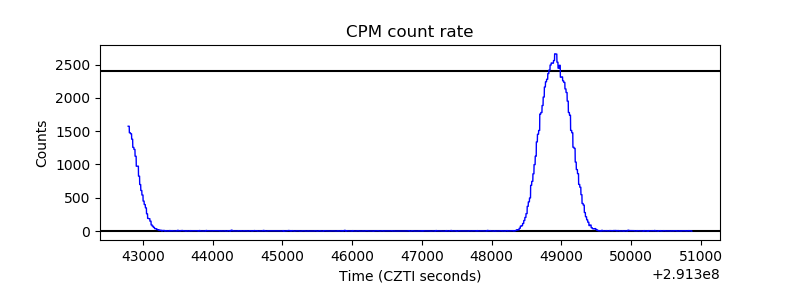 |
| CZT Counter | 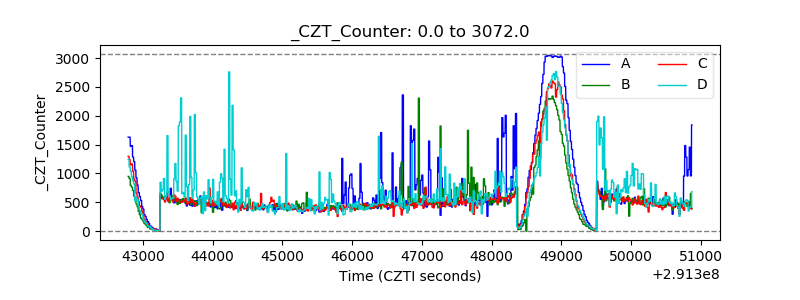 |
| +2.5 Volts monitor | 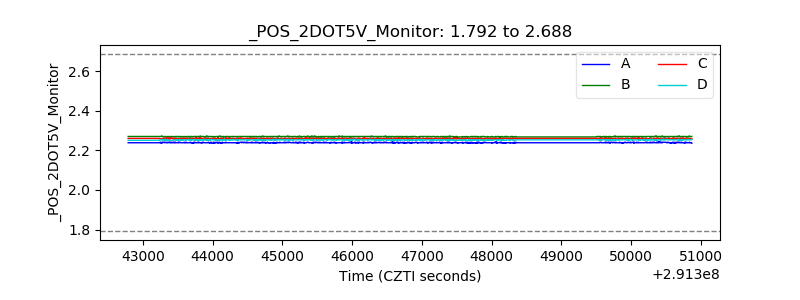 |
| +5 Volts monitor |  |
| _ROLL_ROT | 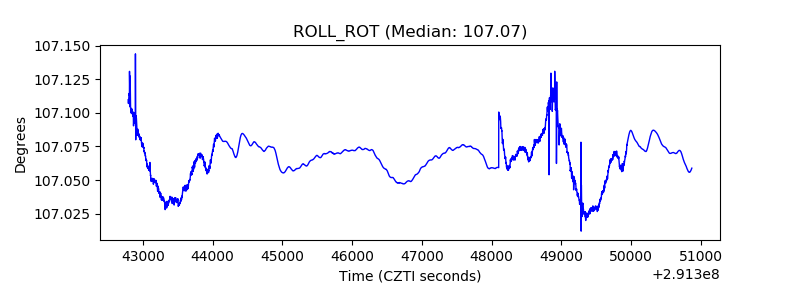 |
| _Roll_DEC | 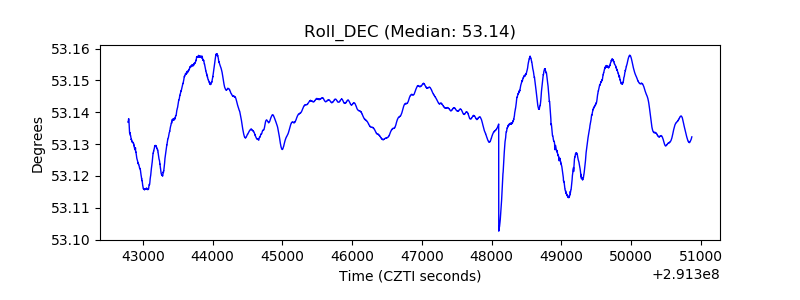 |
| _Roll_RA | 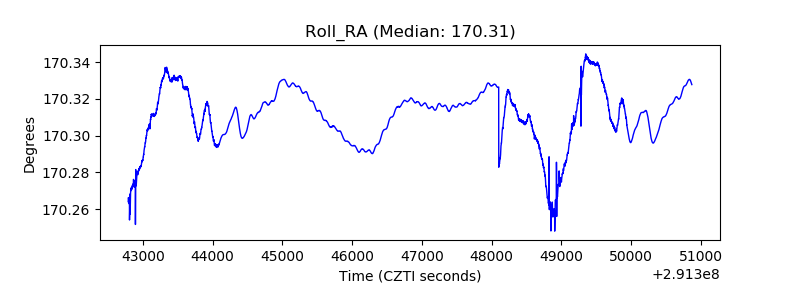 |
| Veto Counter | 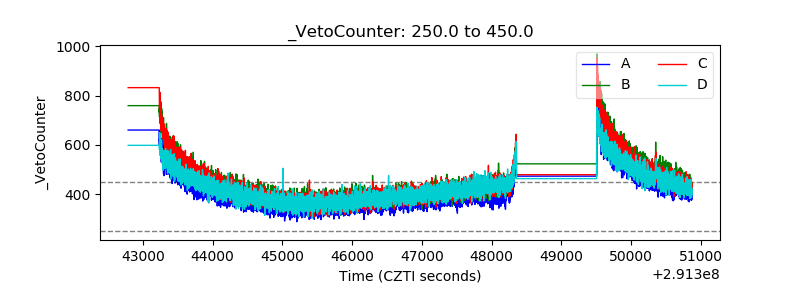 |