| Param | Original file | Final file |
|---|---|---|
| Filename | modeM0/AS1A06_003T07_9000002818_18887cztM0_level2.evt | modeM0/AS1A06_003T07_9000002818_18887cztM0_level2_quad_clean.evt |
| Size (bytes) | 474,068,160 | 96,831,360 |
| Size | 452.1 MB | 92.3 MB |
| Events in quadrant A | 3,354,609 | 641,639 |
| Events in quadrant B | 3,274,789 | 651,954 |
| Events in quadrant C | 3,092,128 | 615,041 |
| Events in quadrant D | 4,213,320 | 589,505 |
| Mode SS | |||
|---|---|---|---|
| Quadrant | BADHDUFLAG | Total packets | Discarded packets |
| A | 0 | 128 | 0 |
| B | 0 | 128 | 0 |
| C | 0 | 126 | 0 |
| D | 0 | 126 | 0 |
| Mode M9 | |||
|---|---|---|---|
| Quadrant | BADHDUFLAG | Total packets | Discarded packets |
| A | 0 | 18 | 0 |
| B | 0 | 19 | 0 |
| C | 0 | 19 | 0 |
| D | 0 | 19 | 0 |
| Mode M0 | |||
|---|---|---|---|
| Quadrant | BADHDUFLAG | Total packets | Discarded packets |
| A | 0 | 13794 | 2 |
| B | 0 | 13617 | 2 |
| C | 0 | 13112 | 2 |
| D | 0 | 16575 | 2 |
| Quadrant | Total seconds | Saturated seconds | Saturation percentage |
|---|---|---|---|
| A | 6219 | 50 | 0.803988% |
| B | 6219 | 64 | 1.029104% |
| C | 6219 | 40 | 0.643190% |
| D | 6218 | 265 | 4.261821% |
Noise dominated data is calculated using 1-second bins in cleaned event files. If a bin has >2000 counts, and if more than 50% of those come from <1% of pixels, then it is considered to be noise-dominated and hence unusable.
| Quadrant | # 1 sec bins | Bins with >0 counts | Bins with >2000 counts | High rate bins dominated by noise | Noise dominated (total time) | Noise dominated (detector-on time) | Marked lightcurve |
|---|---|---|---|---|---|---|---|
| A | 7484 | 6220 | 33 | 33 | 0.44% | 0.53% | 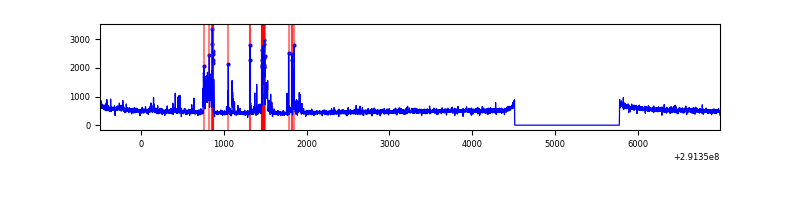 |
| B | 7484 | 6220 | 12 | 12 | 0.16% | 0.19% | 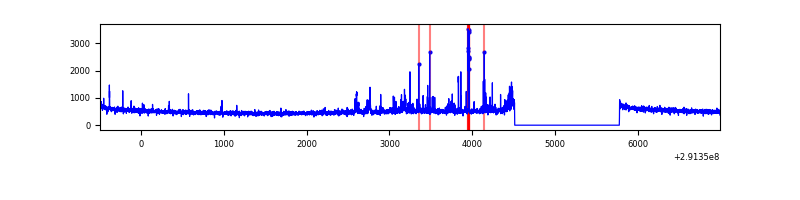 |
| C | 7484 | 6220 | 0 | 0 | 0.00% | 0.00% | 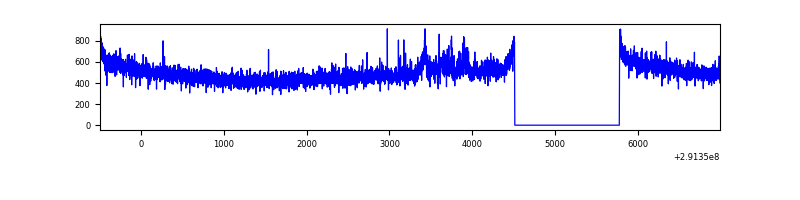 |
| D | 7483 | 6219 | 201 | 201 | 2.69% | 3.23% | 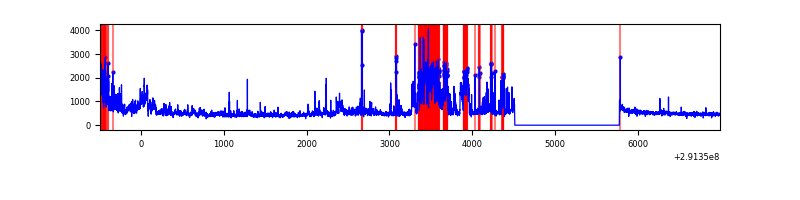 |
Top three noisy pixels from each quadrant. If the there are fewer than three noisy pixels in the level2.evt file, extra rows are filled as -1
| Pixel properties | Quadrant properties | ||||||
|---|---|---|---|---|---|---|---|
| Quadrant | DetID | PixID | Counts | Sigma | Mean | Median | Sigma |
| A | 6 | 16 | 314963 | 2003.14 | 785 | 771 | 156.8 |
| A | 13 | 254 | 8960 | 52.21 | 785 | 771 | 156.8 |
| A | 14 | 111 | 8244 | 47.64 | 785 | 771 | 156.8 |
| B | 7 | 220 | 67106 | 451.19 | 786 | 766 | 147.0 |
| B | 0 | 189 | 64987 | 436.78 | 786 | 766 | 147.0 |
| B | 4 | 80 | 24335 | 160.3 | 786 | 766 | 147.0 |
| C | 14 | 238 | 119031 | 675.41 | 750 | 754 | 175.1 |
| C | 3 | 233 | 48099 | 270.36 | 750 | 754 | 175.1 |
| C | 13 | 61 | 5389 | 26.47 | 750 | 754 | 175.1 |
| D | 12 | 110 | 864045 | 4751.94 | 747 | 724 | 181.7 |
| D | 9 | 1 | 273326 | 1500.47 | 747 | 724 | 181.7 |
| D | 7 | 238 | 104279 | 569.99 | 747 | 724 | 181.7 |
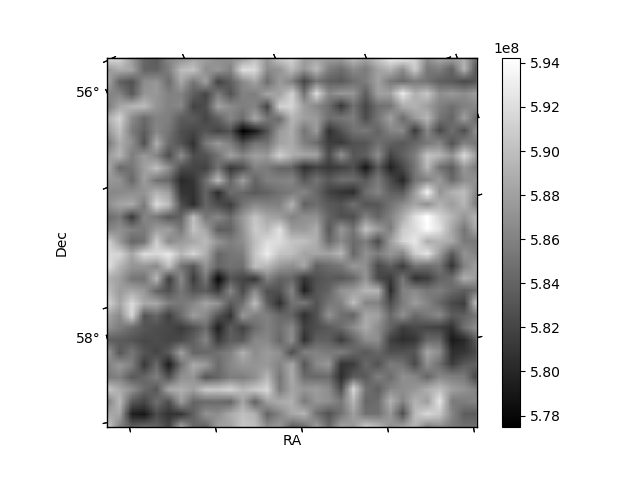
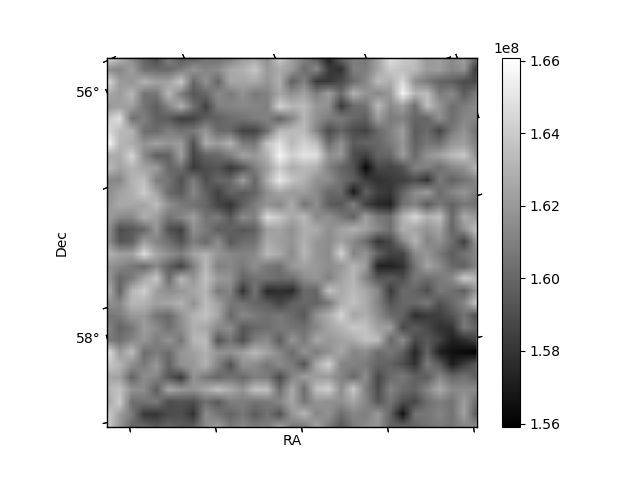
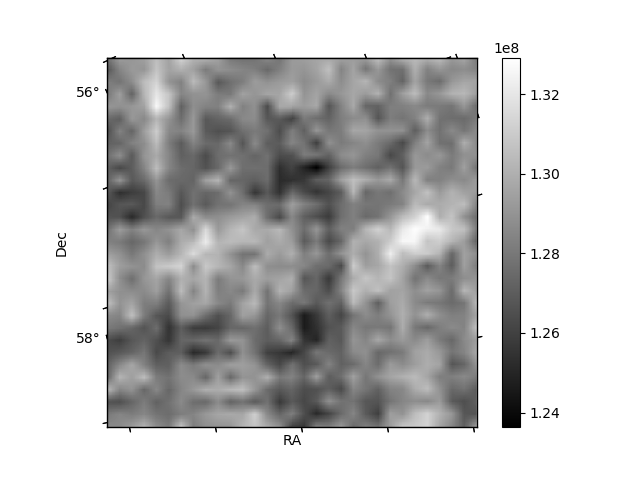
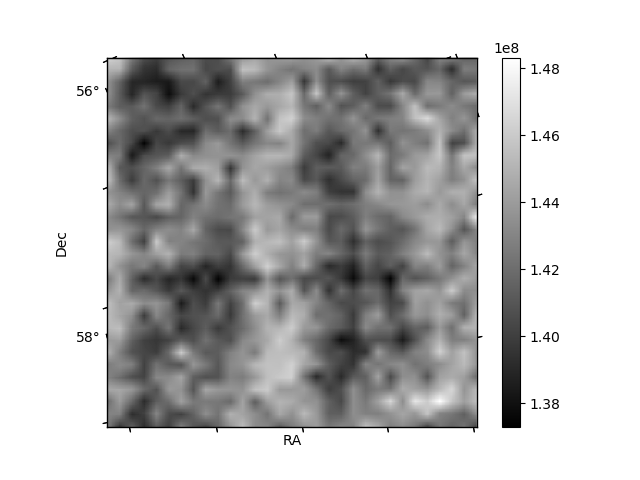
Histogram calculated using DETX and DETY for each event in the final _common_clean file
| Quadrant A | 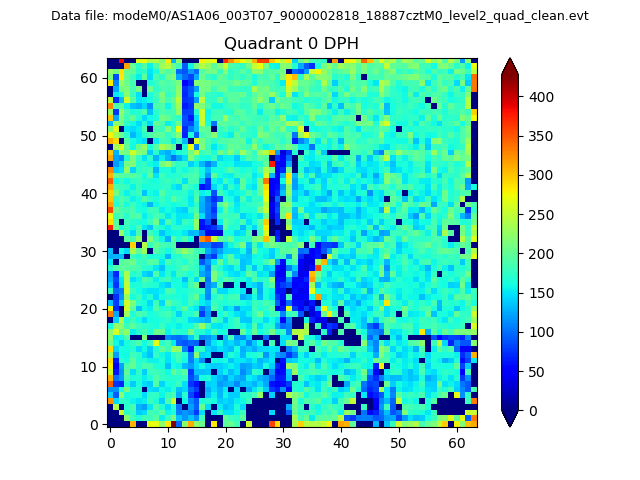 |
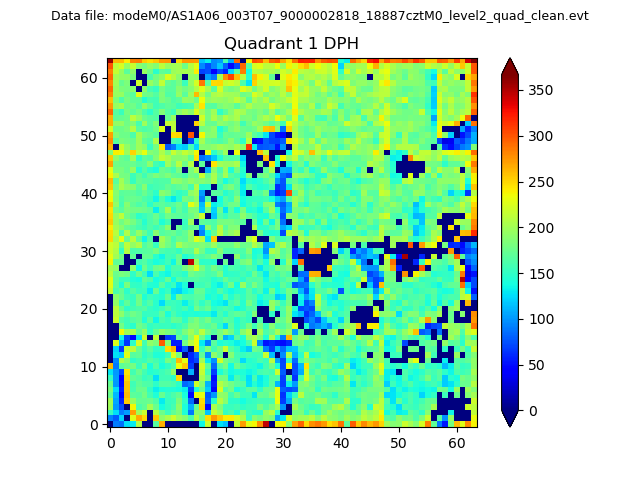 |
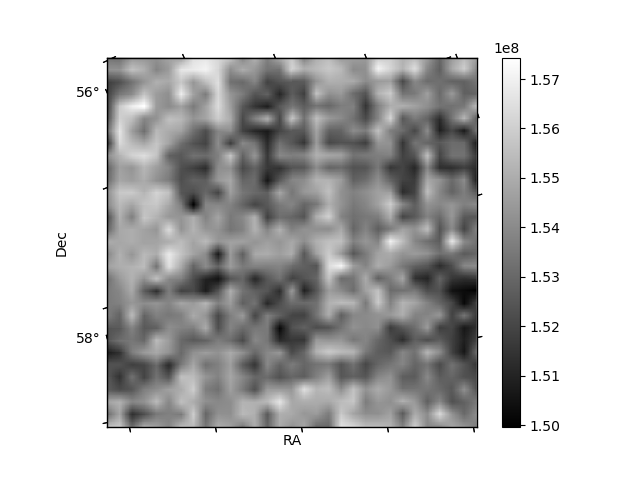
Quadrant B |
|---|---|---|---|
| Quadrant D |  |
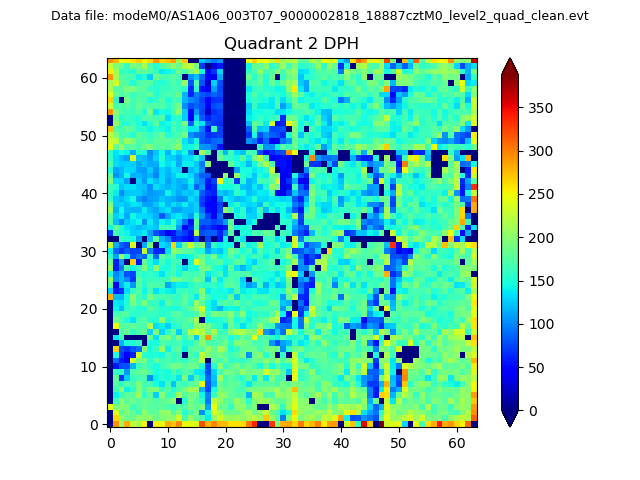 |
Quadrant C |
| Plot type | Count rate plots | Images |
|---|---|---|
| Comparison with Poisson distribution Blue bars denote a histogram of data divided into 1 sec bins. Red curve is a Poisson curve with rate = median count rate of data. |
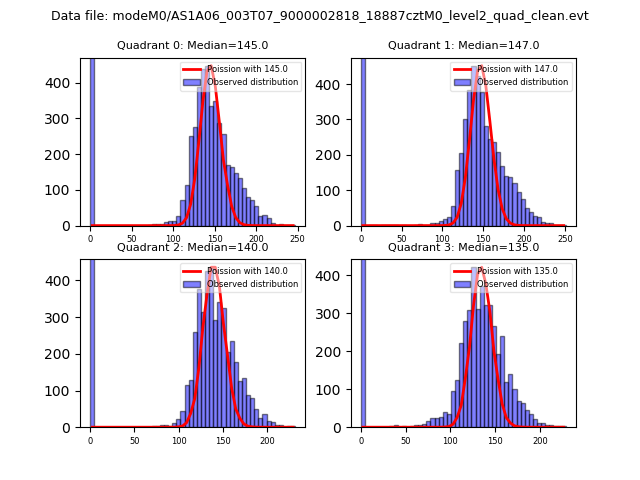 |
 |
| Quadrant-wise count rates Data is divided into 100 sec bins |
 |
|
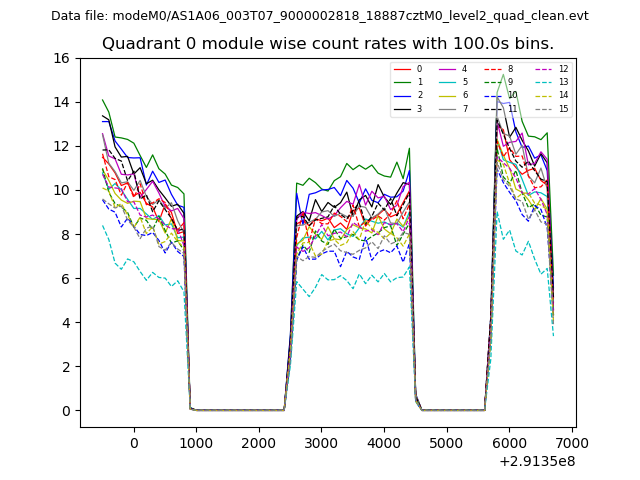
| Module-wise count rates for Quadrant A Data is divided into 100 sec bins |
 |
 |
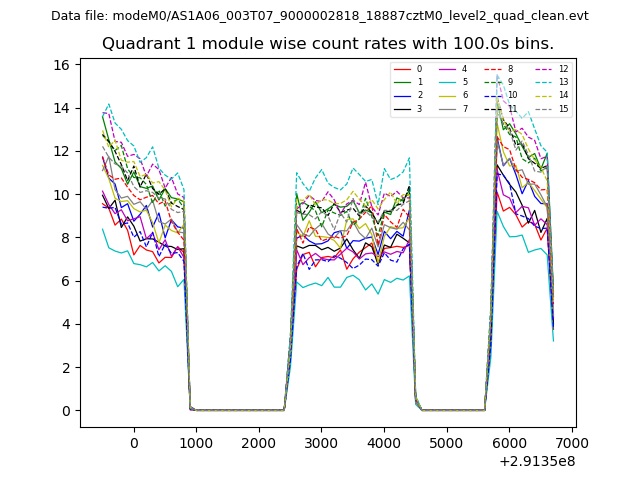
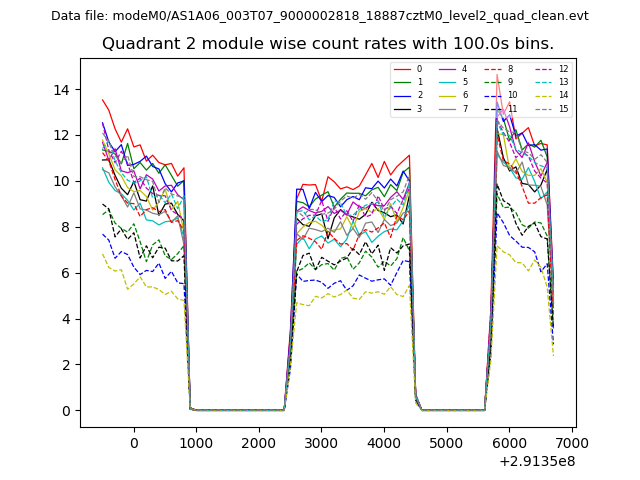
| Module-wise count rates for Quadrant B Data is divided into 100 sec bins |
 |
 |
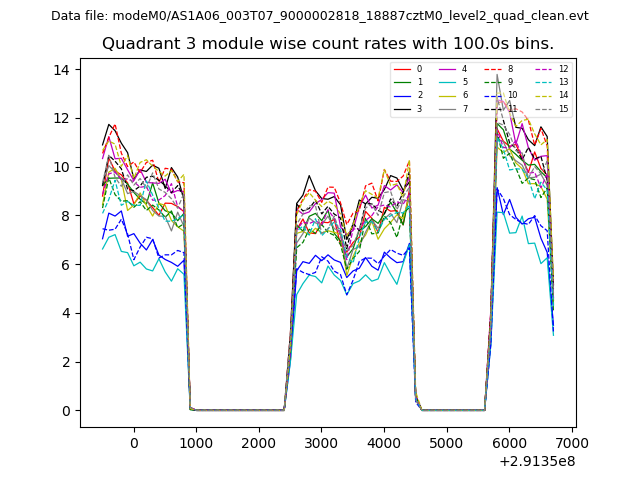
| Module-wise count rates for Quadrant C Data is divided into 100 sec bins |
 |
 |
| Module-wise count rates for Quadrant D Data is divided into 100 sec bins |
 |
 |
| Parameter | Plot |
|---|---|
| CZT HV Monitor | 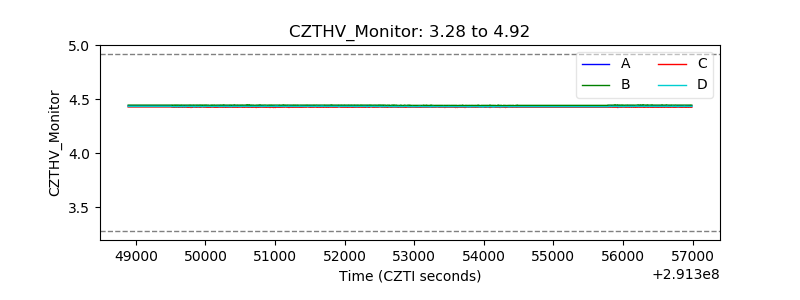 |
| D_VDD | 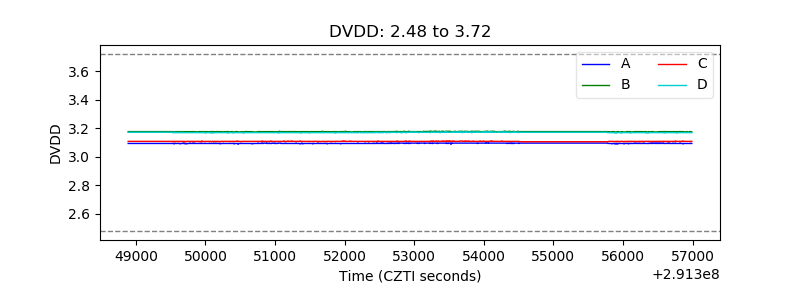 |
| Temperature 1 | 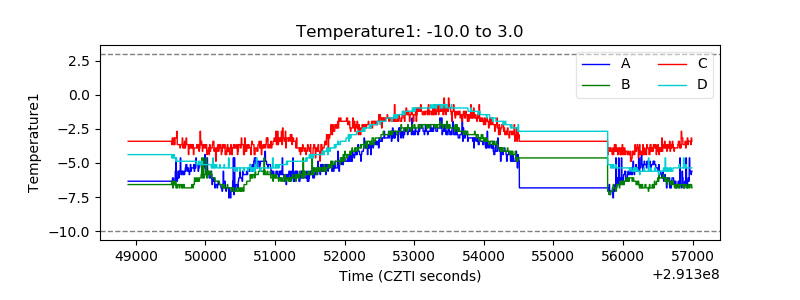 |
| Veto HV Monitor | 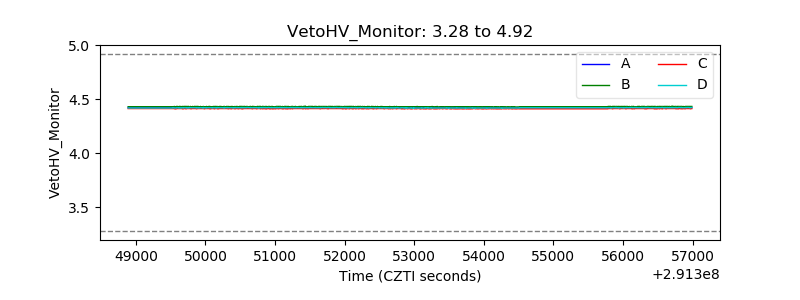 |
| Veto LLD | 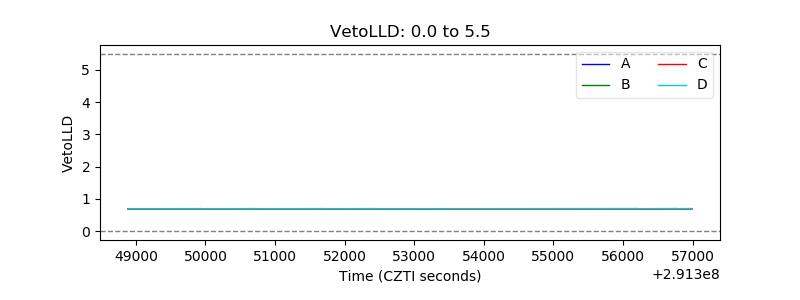 |
| Alpha Counter | 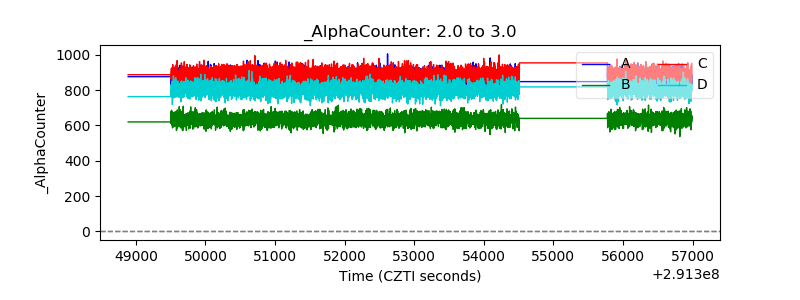 |
| _CPM_Rate | 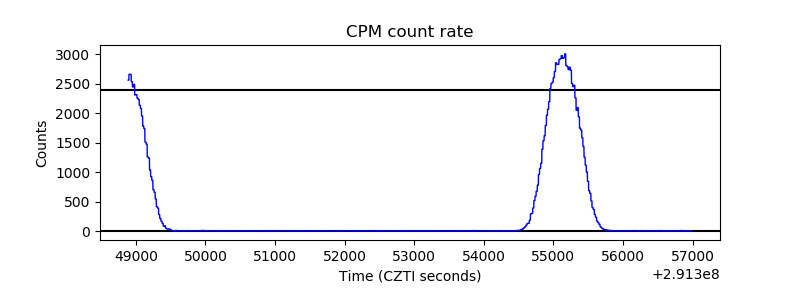 |
| CZT Counter | 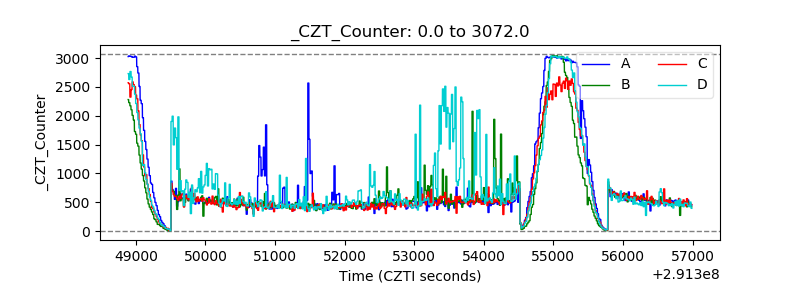 |
| +2.5 Volts monitor | 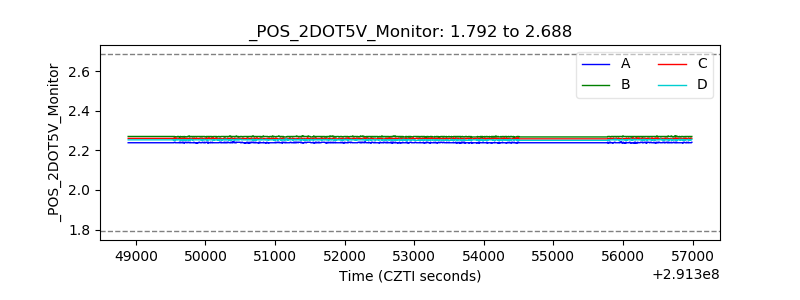 |
| +5 Volts monitor | 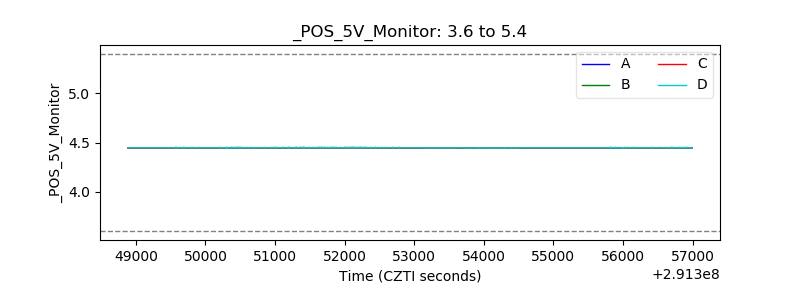 |
| _ROLL_ROT | 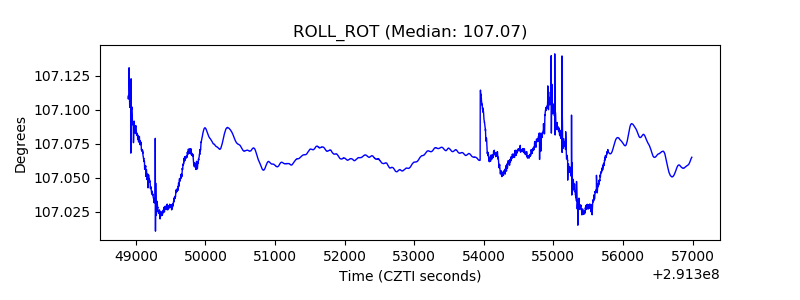 |
| _Roll_DEC | 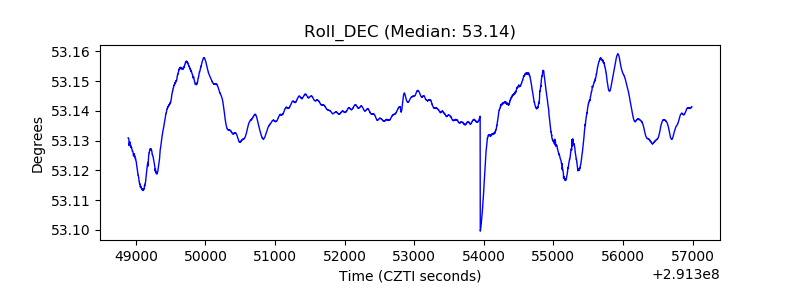 |
| _Roll_RA | 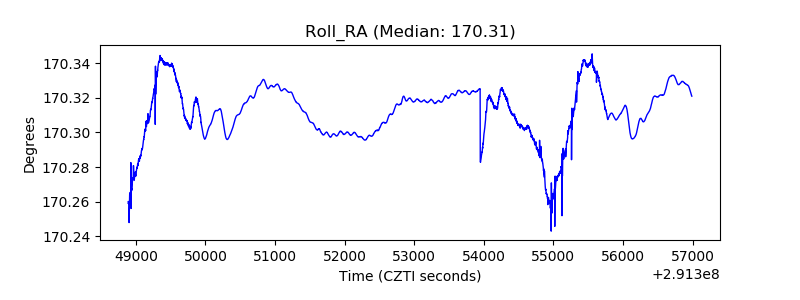 |
| Veto Counter |  |