| Param | Original file | Final file |
|---|---|---|
| Filename | modeM0/AS1A06_003T07_9000002818_18888cztM0_level2.evt | modeM0/AS1A06_003T07_9000002818_18888cztM0_level2_quad_clean.evt |
| Size (bytes) | 460,581,120 | 90,754,560 |
| Size | 439.2 MB | 86.6 MB |
| Events in quadrant A | 3,350,559 | 593,913 |
| Events in quadrant B | 3,711,820 | 603,457 |
| Events in quadrant C | 3,200,814 | 563,318 |
| Events in quadrant D | 3,260,801 | 551,106 |
| Mode SS | |||
|---|---|---|---|
| Quadrant | BADHDUFLAG | Total packets | Discarded packets |
| A | 0 | 126 | 0 |
| B | 0 | 126 | 0 |
| C | 0 | 126 | 0 |
| D | 0 | 126 | 0 |
| Mode M9 | |||
|---|---|---|---|
| Quadrant | BADHDUFLAG | Total packets | Discarded packets |
| A | 0 | 22 | 0 |
| B | 0 | 23 | 0 |
| C | 0 | 23 | 0 |
| D | 0 | 23 | 0 |
| Mode M0 | |||
|---|---|---|---|
| Quadrant | BADHDUFLAG | Total packets | Discarded packets |
| A | 0 | 13718 | 2 |
| B | 0 | 14969 | 2 |
| C | 0 | 13287 | 2 |
| D | 0 | 13666 | 2 |
| Quadrant | Total seconds | Saturated seconds | Saturation percentage |
|---|---|---|---|
| A | 6260 | 41 | 0.654952% |
| B | 6260 | 63 | 1.006390% |
| C | 6260 | 55 | 0.878594% |
| D | 6260 | 29 | 0.463259% |
Noise dominated data is calculated using 1-second bins in cleaned event files. If a bin has >2000 counts, and if more than 50% of those come from <1% of pixels, then it is considered to be noise-dominated and hence unusable.
| Quadrant | # 1 sec bins | Bins with >0 counts | Bins with >2000 counts | High rate bins dominated by noise | Noise dominated (total time) | Noise dominated (detector-on time) | Marked lightcurve |
|---|---|---|---|---|---|---|---|
| A | 7610 | 6262 | 9 | 9 | 0.12% | 0.14% | 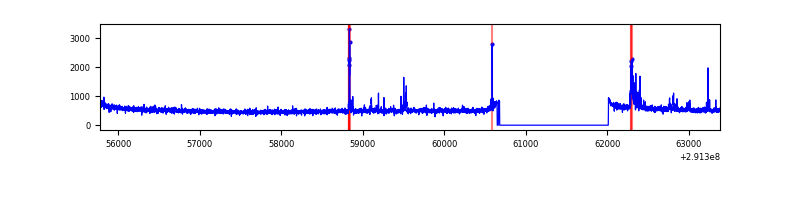 |
| B | 7610 | 6262 | 9 | 9 | 0.12% | 0.14% | 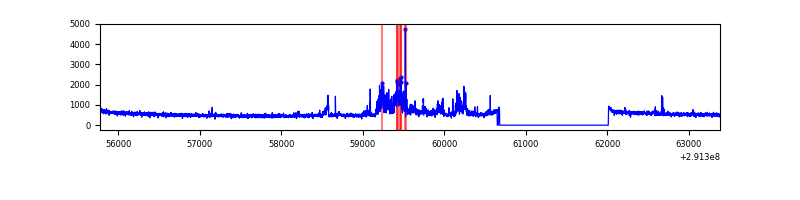 |
| C | 7610 | 6262 | 0 | 0 | 0.00% | 0.00% | 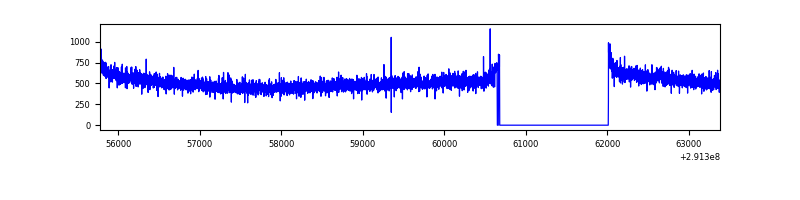 |
| D | 7610 | 6262 | 8 | 8 | 0.11% | 0.13% | 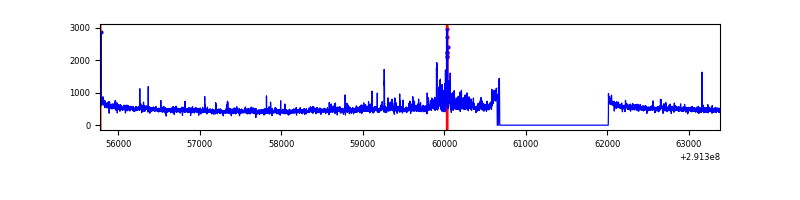 |
Top three noisy pixels from each quadrant. If the there are fewer than three noisy pixels in the level2.evt file, extra rows are filled as -1
| Pixel properties | Quadrant properties | ||||||
|---|---|---|---|---|---|---|---|
| Quadrant | DetID | PixID | Counts | Sigma | Mean | Median | Sigma |
| A | 6 | 16 | 148972 | 897.19 | 829 | 816 | 165.1 |
| A | 13 | 254 | 9451 | 52.29 | 829 | 816 | 165.1 |
| A | 0 | 226 | 7214 | 38.74 | 829 | 816 | 165.1 |
| B | 12 | 18 | 331384 | 2164.42 | 826 | 807 | 152.7 |
| B | 0 | 190 | 50088 | 322.66 | 826 | 807 | 152.7 |
| B | 0 | 189 | 41616 | 267.19 | 826 | 807 | 152.7 |
| C | 14 | 238 | 125887 | 694.99 | 782 | 787 | 180.0 |
| C | 3 | 233 | 27195 | 146.71 | 782 | 787 | 180.0 |
| C | 13 | 61 | 5528 | 26.34 | 782 | 787 | 180.0 |
| D | 7 | 238 | 146246 | 764.9 | 792 | 772 | 190.2 |
| D | 9 | 1 | 43161 | 222.88 | 792 | 772 | 190.2 |
| D | 2 | 234 | 22559 | 114.56 | 792 | 772 | 190.2 |
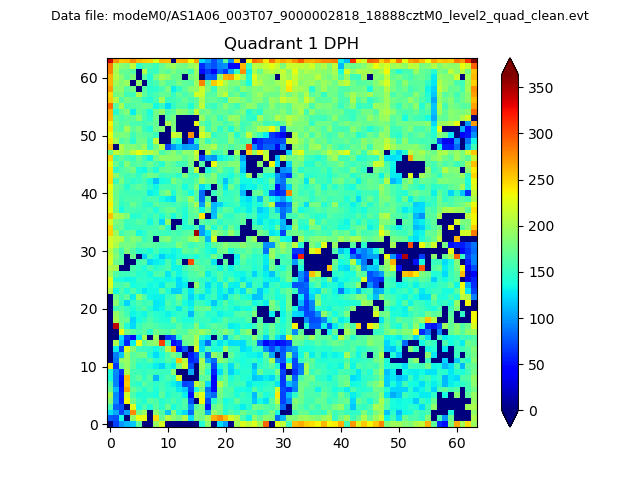
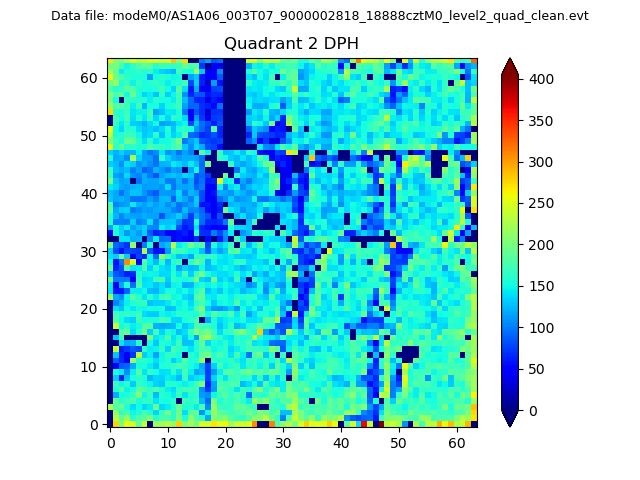
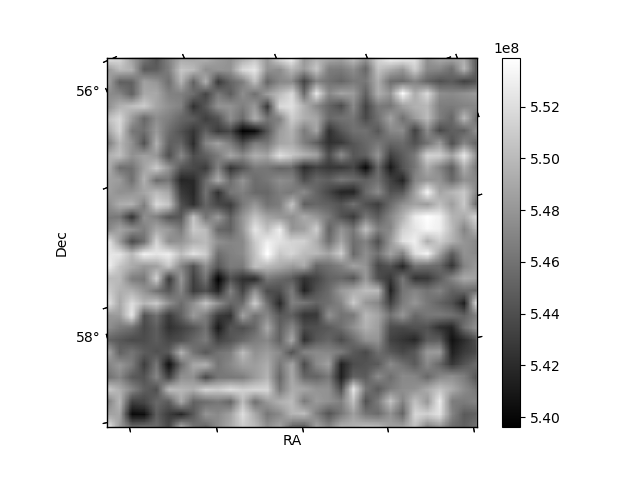
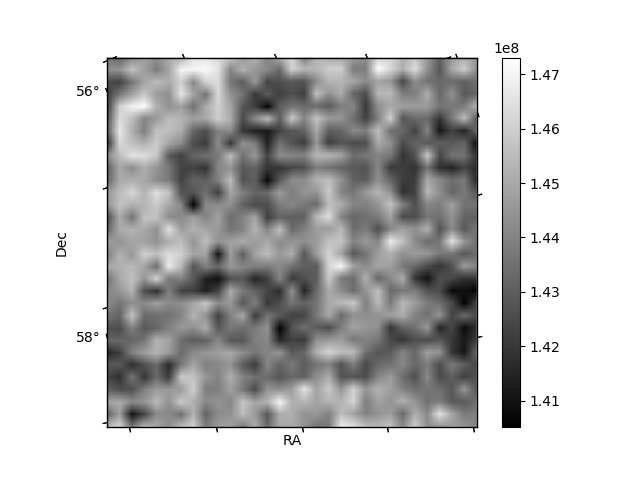
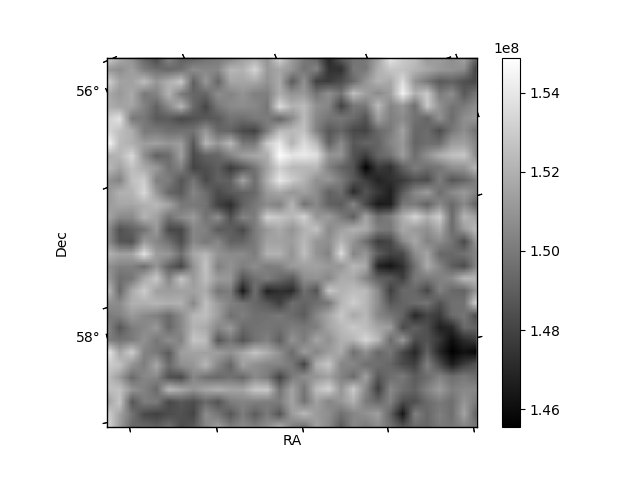
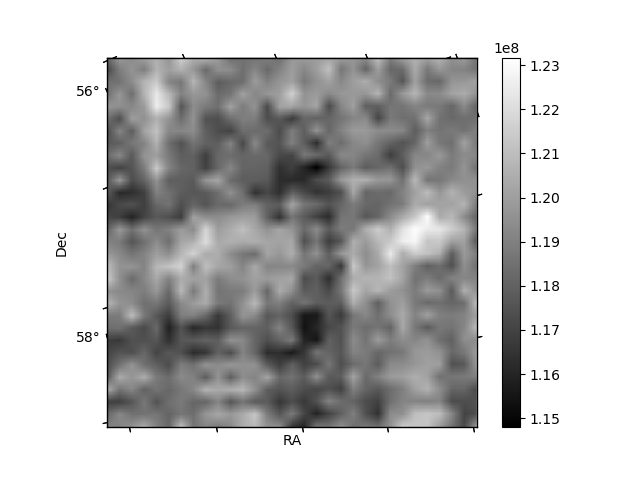
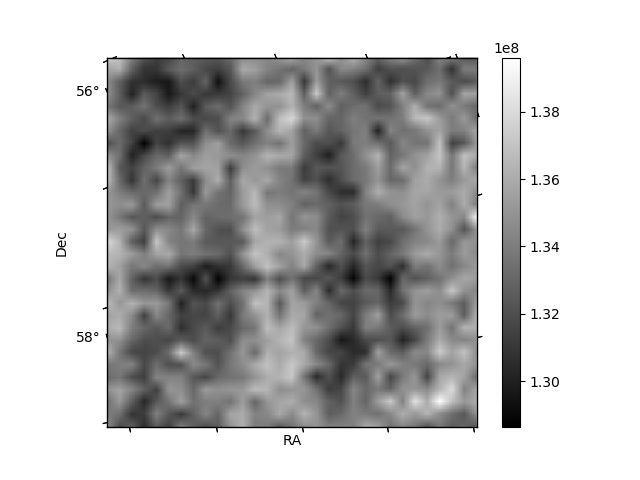
Histogram calculated using DETX and DETY for each event in the final _common_clean file
| Quadrant A |  |
 |
Quadrant B |
|---|---|---|---|
| Quadrant D | 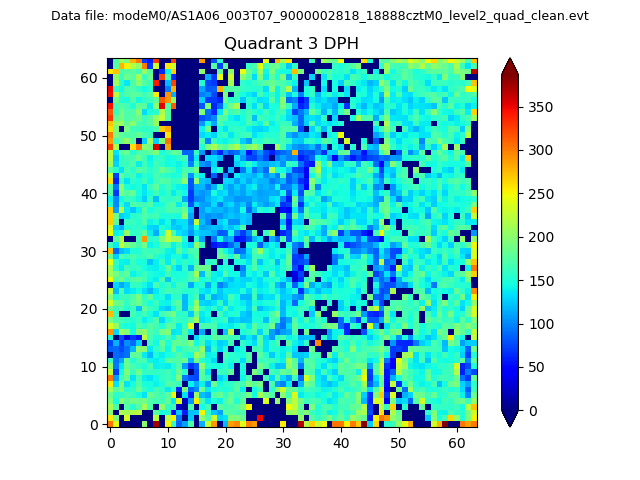 |
 |
Quadrant C |
| Plot type | Count rate plots | Images |
|---|---|---|
| Comparison with Poisson distribution Blue bars denote a histogram of data divided into 1 sec bins. Red curve is a Poisson curve with rate = median count rate of data. |
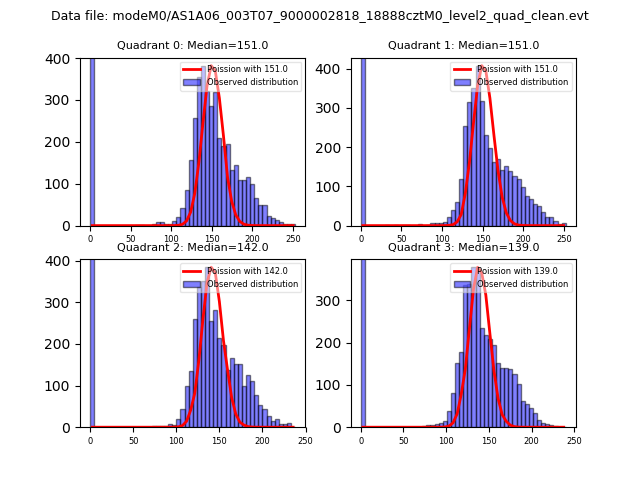 |
 |
| Quadrant-wise count rates Data is divided into 100 sec bins |
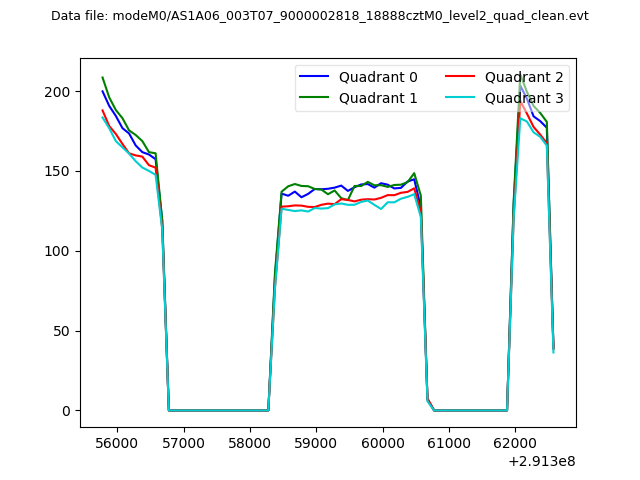 |
|
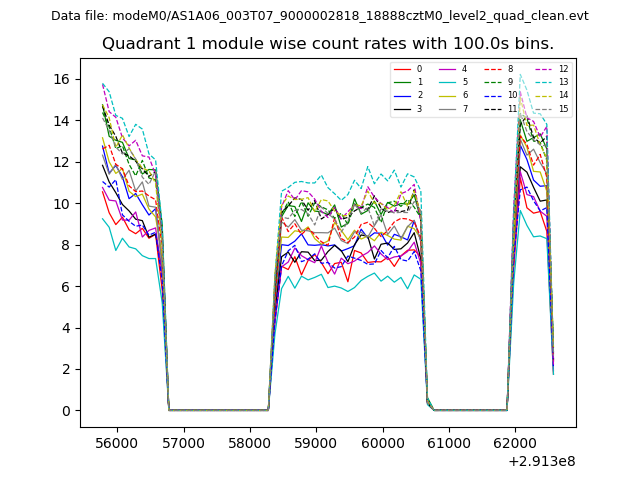
| Module-wise count rates for Quadrant A Data is divided into 100 sec bins |
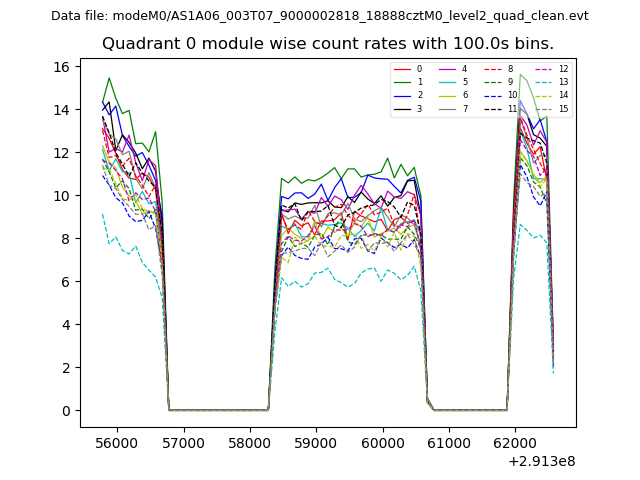 |
 |
| Module-wise count rates for Quadrant B Data is divided into 100 sec bins |
 |
 |
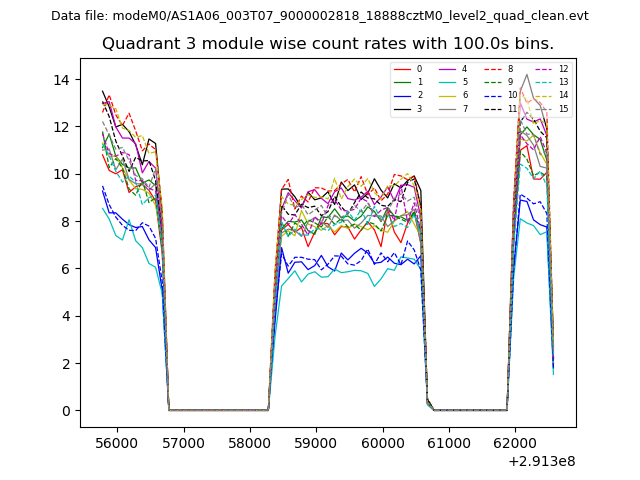
| Module-wise count rates for Quadrant C Data is divided into 100 sec bins |
 |
 |
| Module-wise count rates for Quadrant D Data is divided into 100 sec bins |
 |
 |
| Parameter | Plot |
|---|---|
| CZT HV Monitor |  |
| D_VDD | 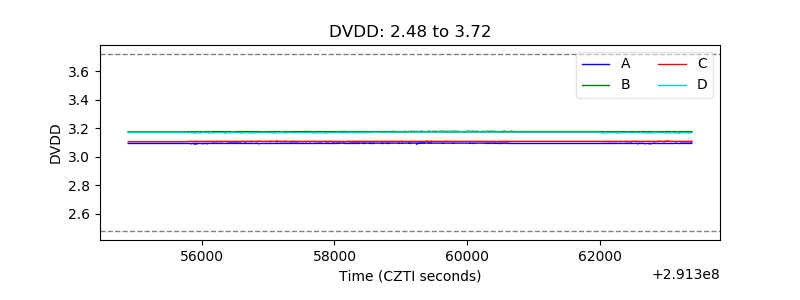 |
| Temperature 1 | 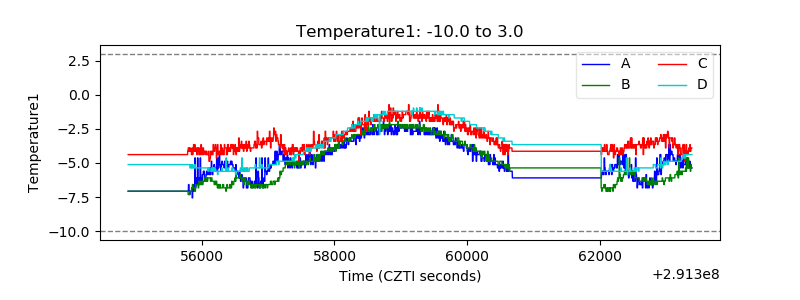 |
| Veto HV Monitor | 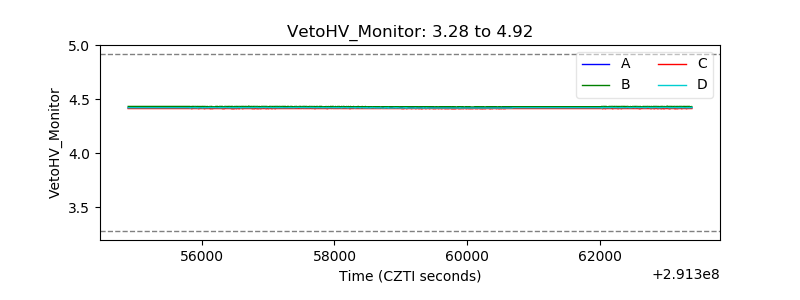 |
| Veto LLD | 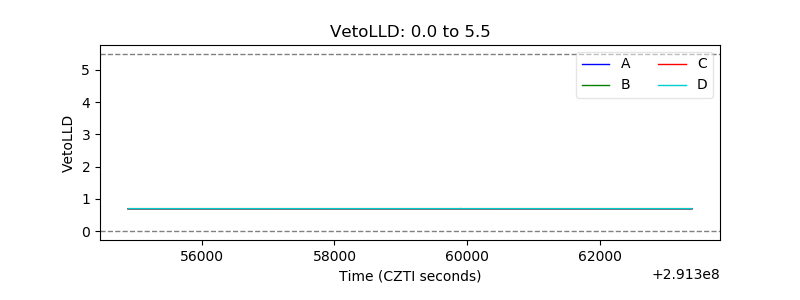 |
| Alpha Counter | 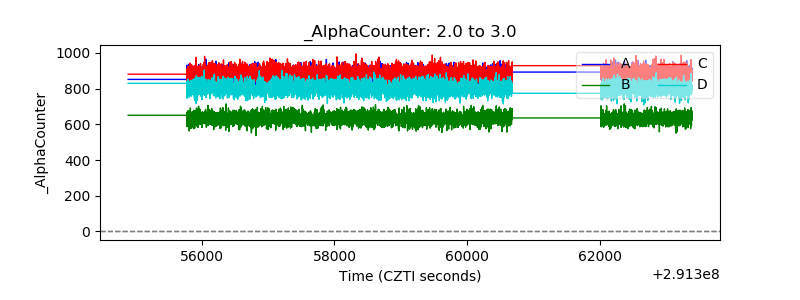 |
| _CPM_Rate | 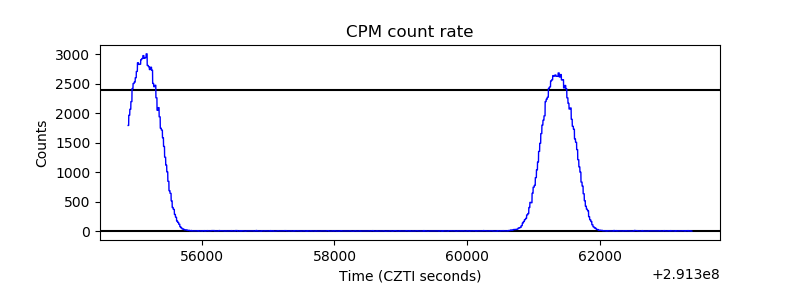 |
| CZT Counter | 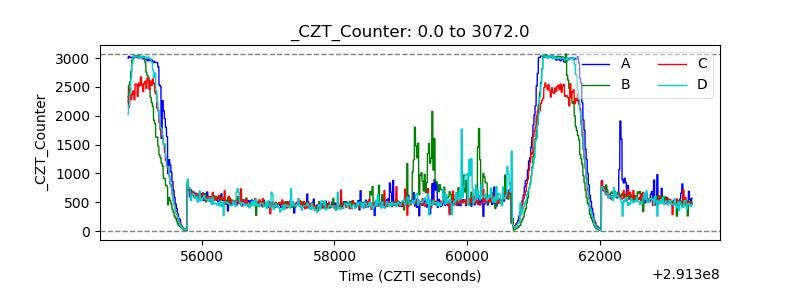 |
| +2.5 Volts monitor |  |
| +5 Volts monitor |  |
| _ROLL_ROT | 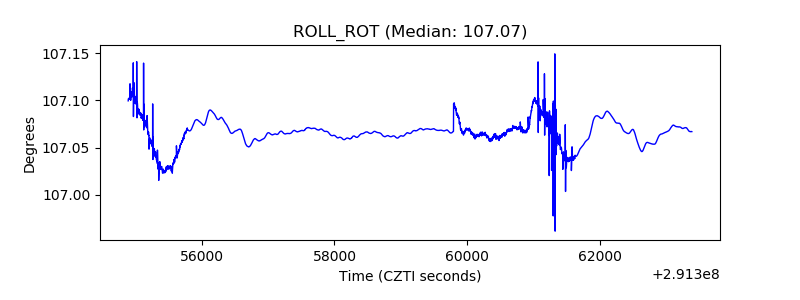 |
| _Roll_DEC | 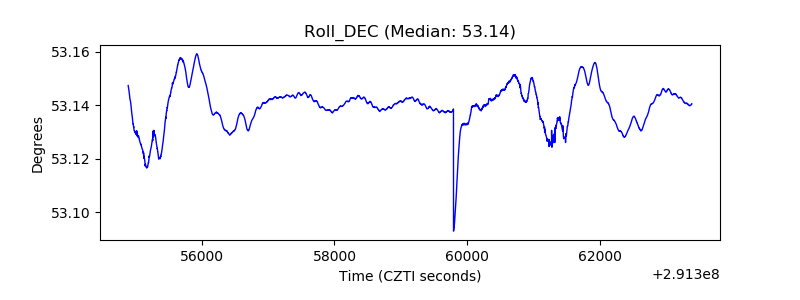 |
| _Roll_RA | 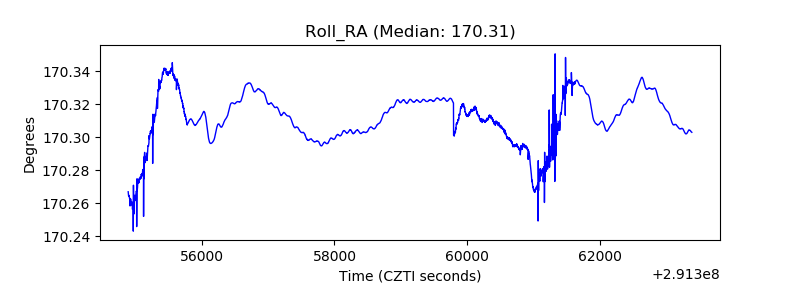 |
| Veto Counter | 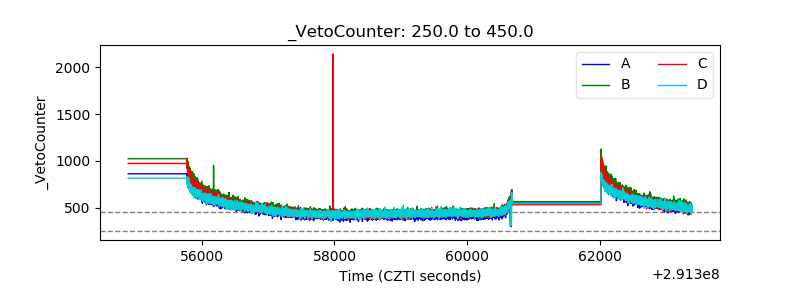 |