| Param | Original file | Final file |
|---|---|---|
| Filename | modeM0/AS1A06_003T07_9000002818_18891cztM0_level2.evt | modeM0/AS1A06_003T07_9000002818_18891cztM0_level2_quad_clean.evt |
| Size (bytes) | 605,617,920 | 91,065,600 |
| Size | 577.6 MB | 86.8 MB |
| Events in quadrant A | 4,192,863 | 583,934 |
| Events in quadrant B | 6,540,848 | 570,355 |
| Events in quadrant C | 3,476,380 | 564,255 |
| Events in quadrant D | 3,662,814 | 557,762 |
| Mode SS | |||
|---|---|---|---|
| Quadrant | BADHDUFLAG | Total packets | Discarded packets |
| A | 0 | 140 | 0 |
| B | 0 | 140 | 0 |
| C | 0 | 140 | 0 |
| D | 0 | 140 | 0 |
| Mode M9 | |||
|---|---|---|---|
| Quadrant | BADHDUFLAG | Total packets | Discarded packets |
| A | 0 | 15 | 0 |
| B | 0 | 16 | 0 |
| C | 0 | 16 | 0 |
| D | 0 | 16 | 0 |
| Mode M0 | |||
|---|---|---|---|
| Quadrant | BADHDUFLAG | Total packets | Discarded packets |
| A | 0 | 16610 | 2 |
| B | 0 | 23929 | 2 |
| C | 0 | 14458 | 2 |
| D | 0 | 15361 | 3 |
| Quadrant | Total seconds | Saturated seconds | Saturation percentage |
|---|---|---|---|
| A | 6907 | 276 | 3.995946% |
| B | 6907 | 1286 | 18.618793% |
| C | 6907 | 163 | 2.359925% |
| D | 6906 | 135 | 1.954822% |
Noise dominated data is calculated using 1-second bins in cleaned event files. If a bin has >2000 counts, and if more than 50% of those come from <1% of pixels, then it is considered to be noise-dominated and hence unusable.
| Quadrant | # 1 sec bins | Bins with >0 counts | Bins with >2000 counts | High rate bins dominated by noise | Noise dominated (total time) | Noise dominated (detector-on time) | Marked lightcurve |
|---|---|---|---|---|---|---|---|
| A | 7912 | 6908 | 88 | 88 | 1.11% | 1.27% | 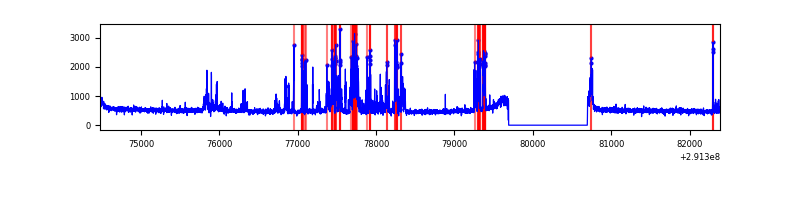 |
| B | 7912 | 6908 | 659 | 659 | 8.33% | 9.54% | 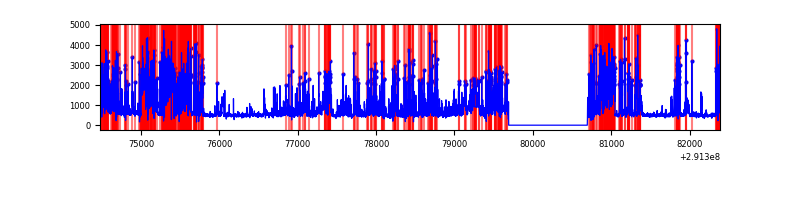 |
| C | 7912 | 6908 | 0 | 0 | 0.00% | 0.00% | 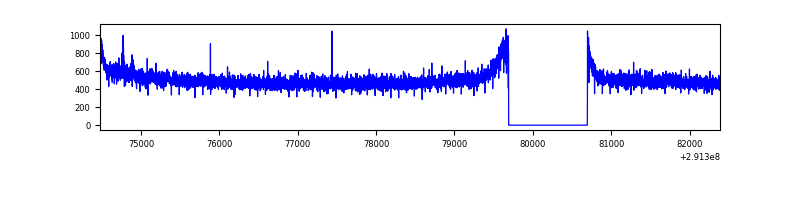 |
| D | 7911 | 6907 | 29 | 29 | 0.37% | 0.42% | 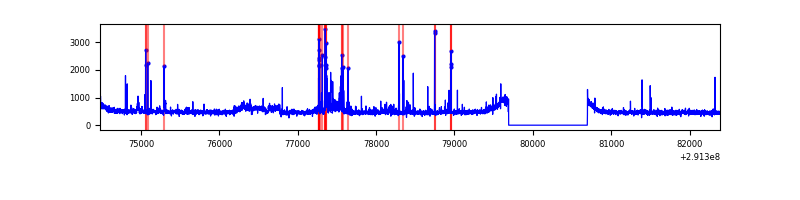 |
Top three noisy pixels from each quadrant. If the there are fewer than three noisy pixels in the level2.evt file, extra rows are filled as -1
| Pixel properties | Quadrant properties | ||||||
|---|---|---|---|---|---|---|---|
| Quadrant | DetID | PixID | Counts | Sigma | Mean | Median | Sigma |
| A | 6 | 16 | 749159 | 4213.5 | 888 | 871 | 177.6 |
| A | 8 | 205 | 17550 | 93.92 | 888 | 871 | 177.6 |
| A | 13 | 254 | 8667 | 43.9 | 888 | 871 | 177.6 |
| B | 3 | 112 | 2960286 | 19900.27 | 806 | 787 | 148.7 |
| B | 5 | 128 | 127444 | 851.67 | 806 | 787 | 148.7 |
| B | 0 | 189 | 112340 | 750.11 | 806 | 787 | 148.7 |
| C | 14 | 238 | 131284 | 668.6 | 841 | 843 | 195.1 |
| C | 3 | 233 | 62861 | 317.88 | 841 | 843 | 195.1 |
| C | 13 | 61 | 5916 | 26.0 | 841 | 843 | 195.1 |
| D | 14 | 34 | 141944 | 684.31 | 860 | 835 | 206.2 |
| D | 1 | 52 | 140005 | 674.91 | 860 | 835 | 206.2 |
| D | 9 | 1 | 45871 | 218.4 | 860 | 835 | 206.2 |
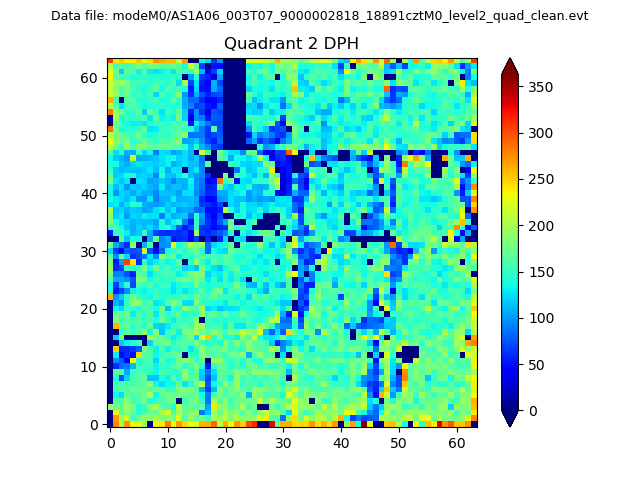
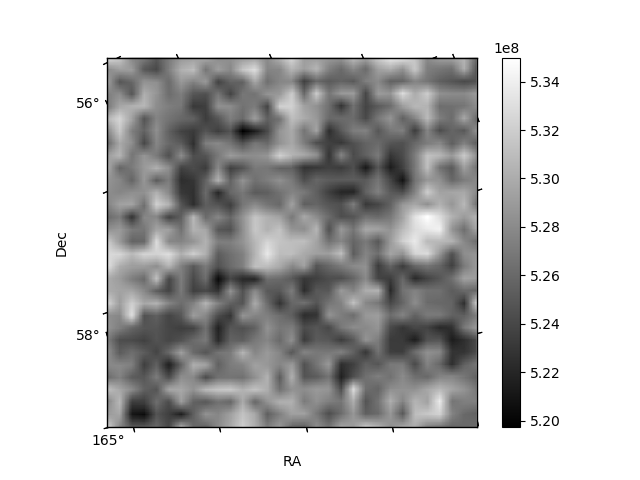
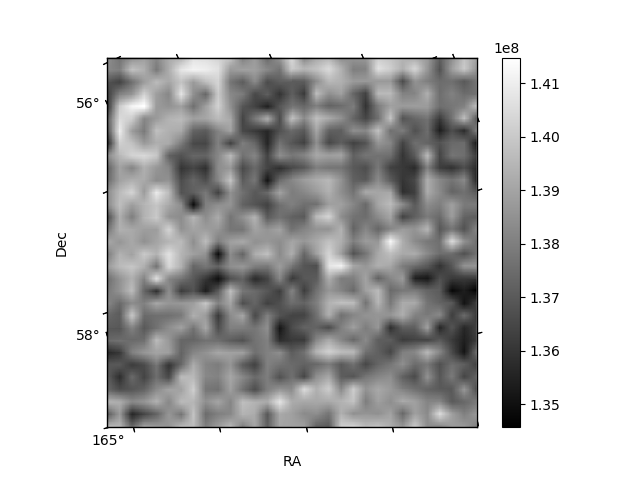
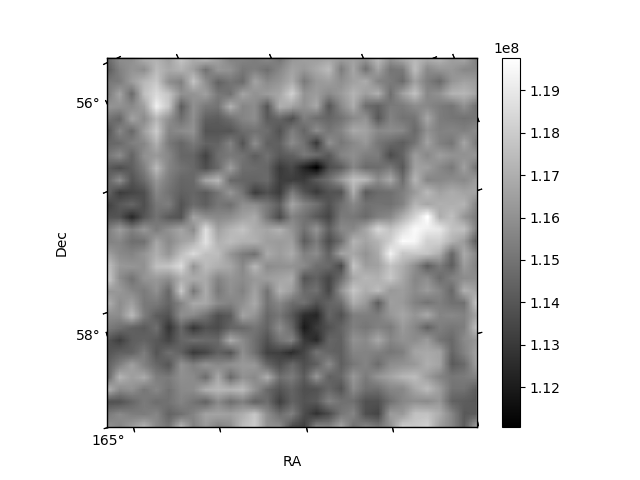
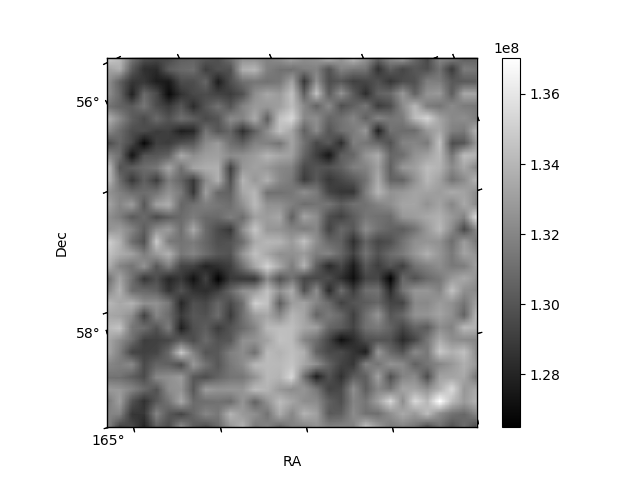
Histogram calculated using DETX and DETY for each event in the final _common_clean file
| Quadrant A | 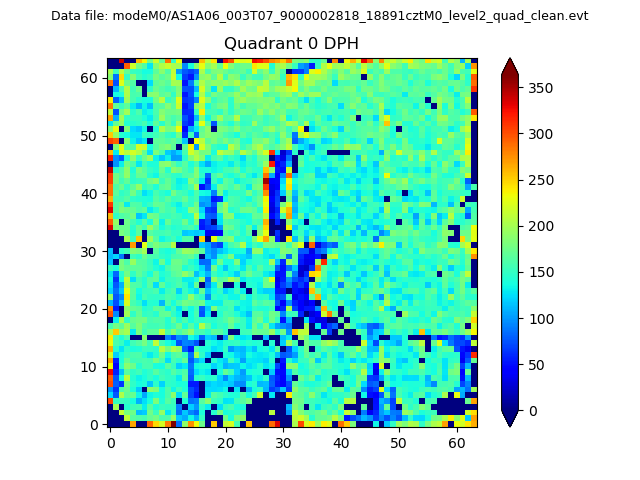 |
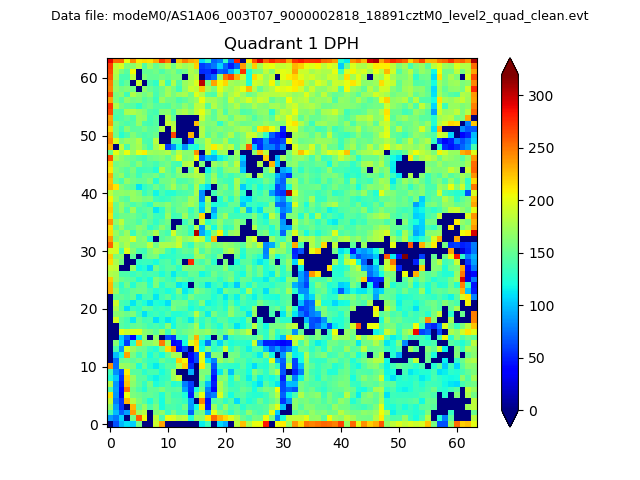 |
Quadrant B |
|---|---|---|---|
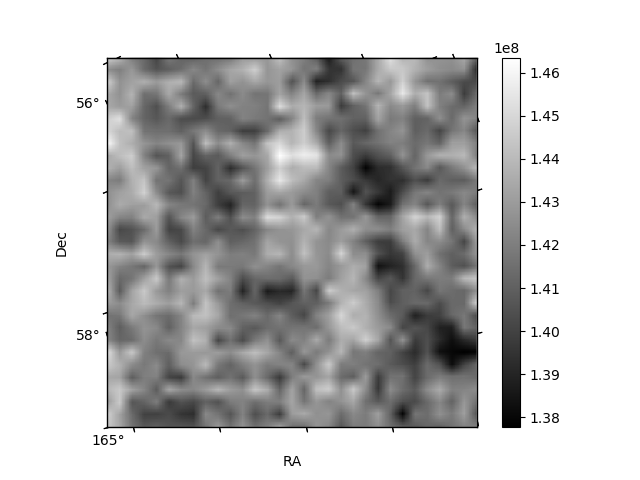
| Quadrant D | 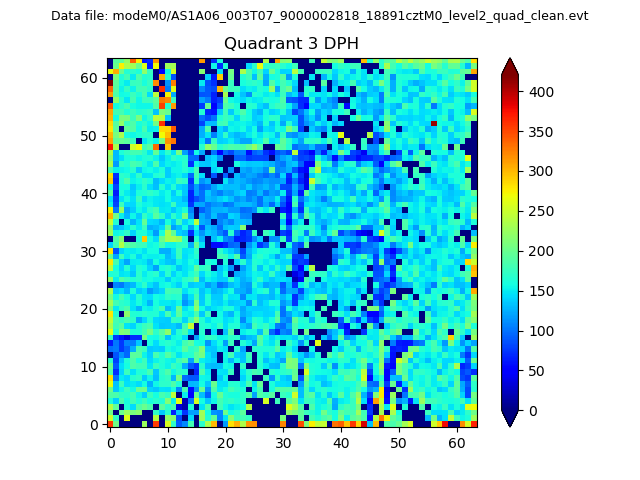 |
 |
Quadrant C |
| Plot type | Count rate plots | Images |
|---|---|---|
| Comparison with Poisson distribution Blue bars denote a histogram of data divided into 1 sec bins. Red curve is a Poisson curve with rate = median count rate of data. |
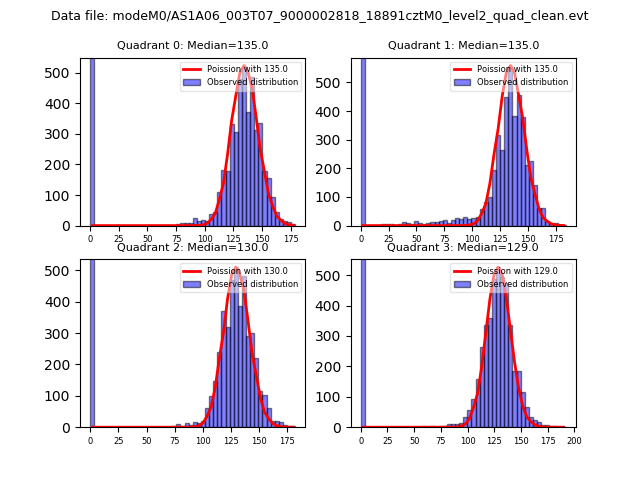 |
 |
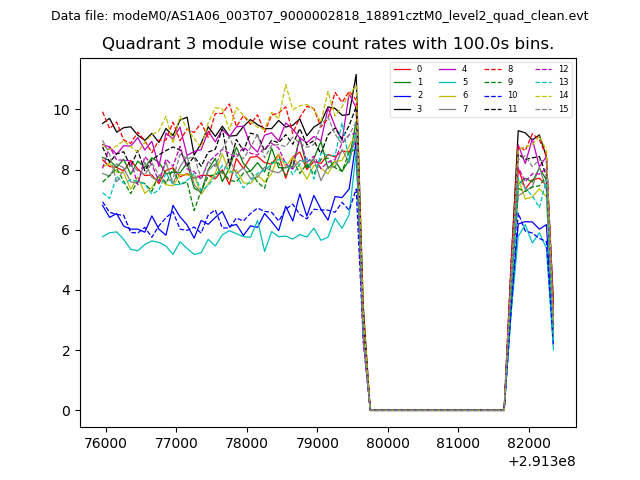
| Quadrant-wise count rates Data is divided into 100 sec bins |
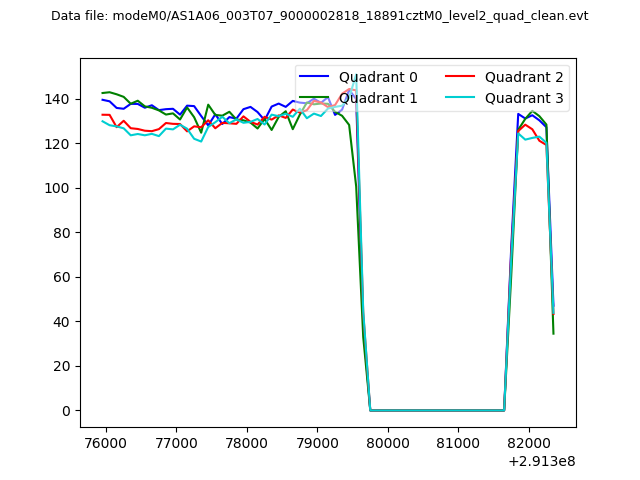 |
|
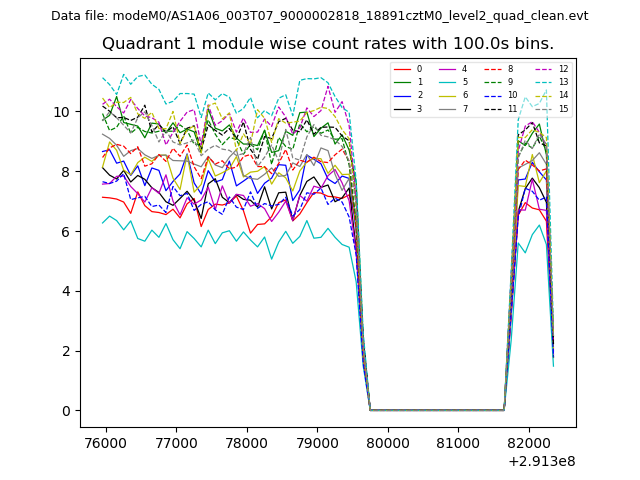
| Module-wise count rates for Quadrant A Data is divided into 100 sec bins |
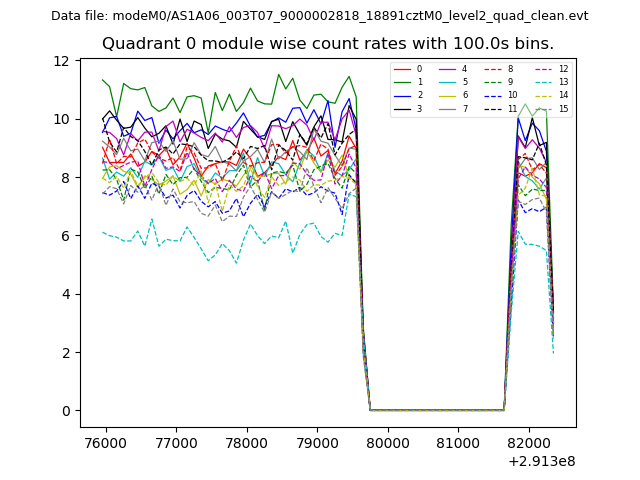 |
 |
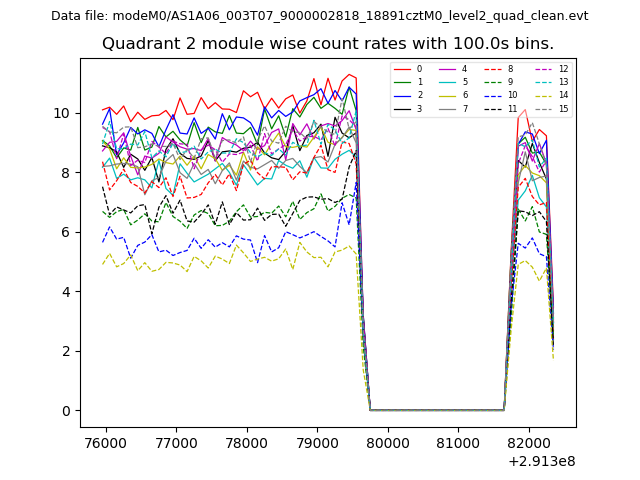
| Module-wise count rates for Quadrant B Data is divided into 100 sec bins |
 |
 |
| Module-wise count rates for Quadrant C Data is divided into 100 sec bins |
 |
 |
| Module-wise count rates for Quadrant D Data is divided into 100 sec bins |
 |
 |
| Parameter | Plot |
|---|---|
| CZT HV Monitor | 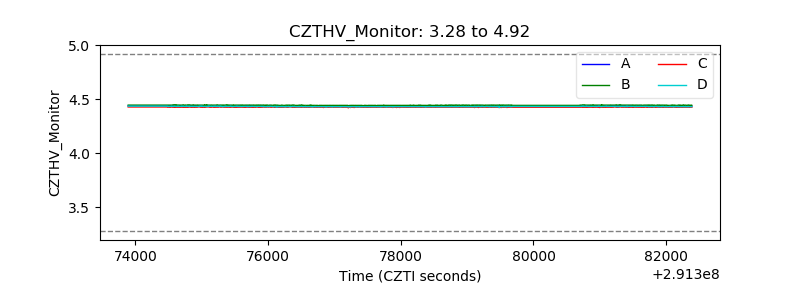 |
| D_VDD | 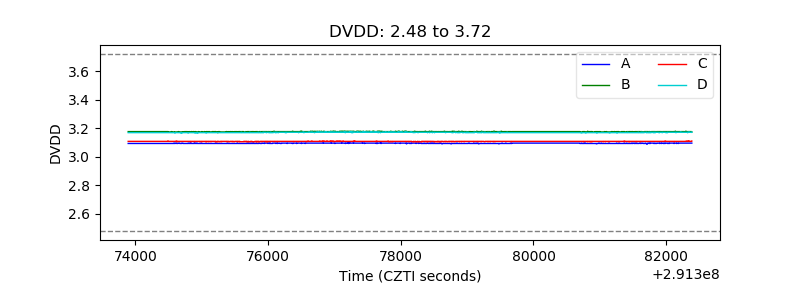 |
| Temperature 1 | 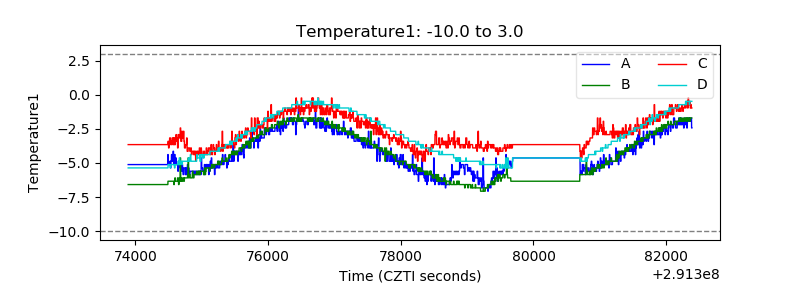 |
| Veto HV Monitor | 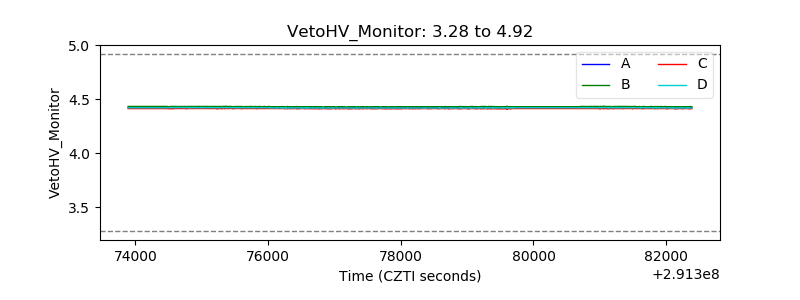 |
| Veto LLD | 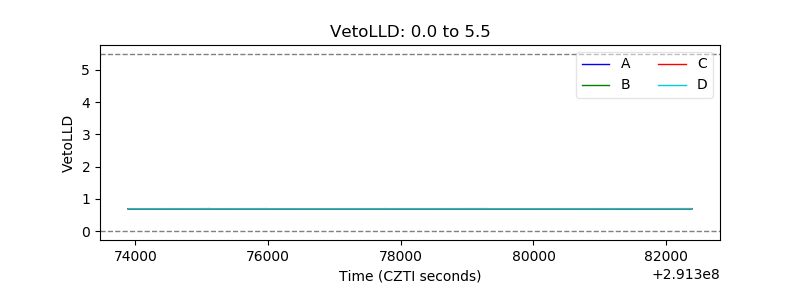 |
| Alpha Counter | 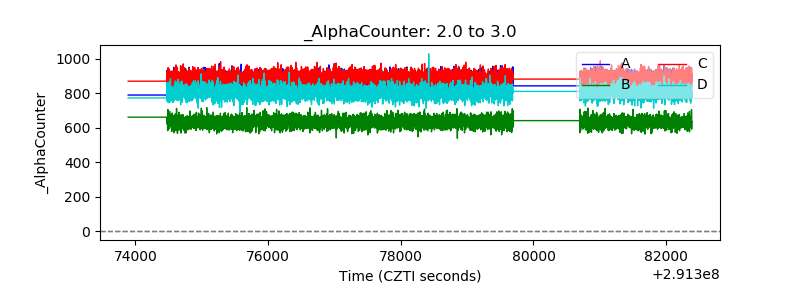 |
| _CPM_Rate | 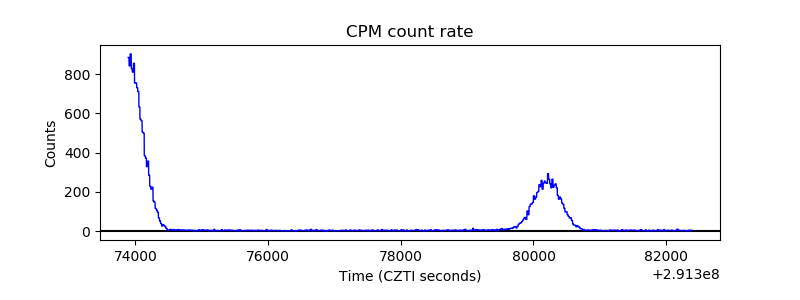 |
| CZT Counter | 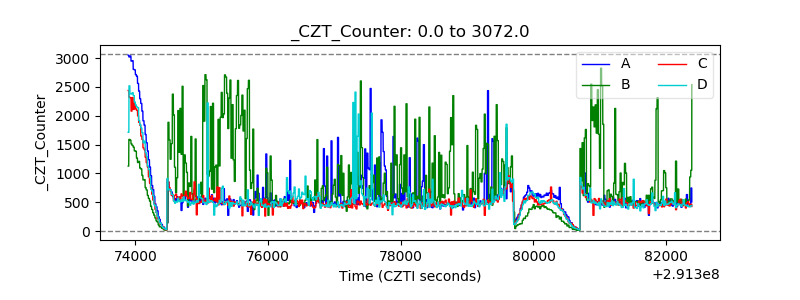 |
| +2.5 Volts monitor |  |
| +5 Volts monitor |  |
| _ROLL_ROT | 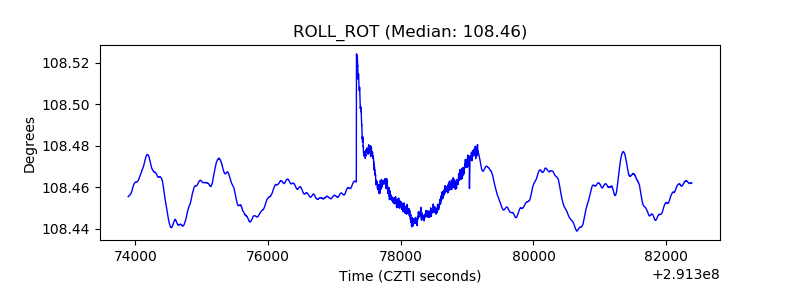 |
| _Roll_DEC | 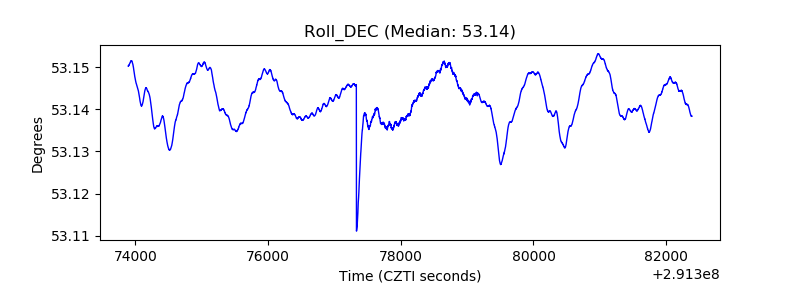 |
| _Roll_RA | 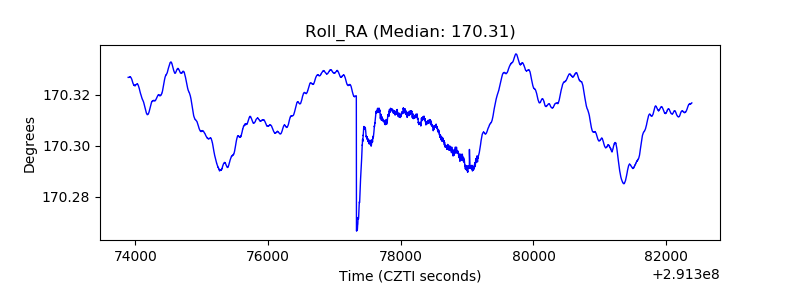 |
| Veto Counter | 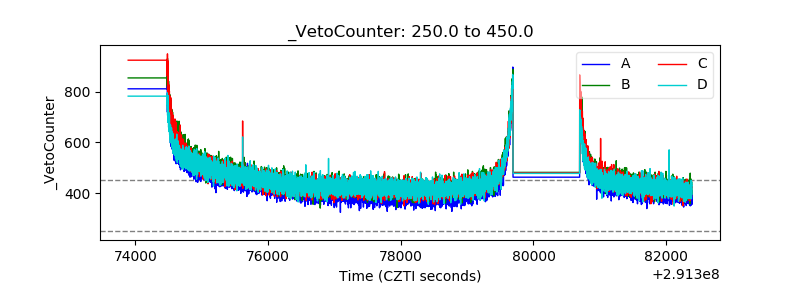 |