| Param | Original file | Final file |
|---|---|---|
| Filename | modeM0/AS1A06_003T07_9000002818_18892cztM0_level2.evt | modeM0/AS1A06_003T07_9000002818_18892cztM0_level2_quad_clean.evt |
| Size (bytes) | 644,768,640 | 90,668,160 |
| Size | 614.9 MB | 86.5 MB |
| Events in quadrant A | 3,263,071 | 659,886 |
| Events in quadrant B | 9,092,710 | 382,469 |
| Events in quadrant C | 3,081,317 | 635,299 |
| Events in quadrant D | 3,655,998 | 621,357 |
| Mode SS | |||
|---|---|---|---|
| Quadrant | BADHDUFLAG | Total packets | Discarded packets |
| A | 0 | 128 | 0 |
| B | 0 | 128 | 0 |
| C | 0 | 128 | 0 |
| D | 0 | 128 | 0 |
| Mode M9 | |||
|---|---|---|---|
| Quadrant | BADHDUFLAG | Total packets | Discarded packets |
| A | 0 | 7 | 0 |
| B | 0 | 7 | 0 |
| C | 0 | 7 | 0 |
| D | 0 | 7 | 0 |
| Mode M0 | |||
|---|---|---|---|
| Quadrant | BADHDUFLAG | Total packets | Discarded packets |
| A | 0 | 13811 | 1 |
| B | 0 | 31338 | 1 |
| C | 0 | 13173 | 1 |
| D | 0 | 15122 | 2 |
| Quadrant | Total seconds | Saturated seconds | Saturation percentage |
|---|---|---|---|
| A | 6389 | 122 | 1.909532% |
| B | 6389 | 3492 | 54.656441% |
| C | 6389 | 123 | 1.925184% |
| D | 6388 | 209 | 3.271760% |
Noise dominated data is calculated using 1-second bins in cleaned event files. If a bin has >2000 counts, and if more than 50% of those come from <1% of pixels, then it is considered to be noise-dominated and hence unusable.
| Quadrant | # 1 sec bins | Bins with >0 counts | Bins with >2000 counts | High rate bins dominated by noise | Noise dominated (total time) | Noise dominated (detector-on time) | Marked lightcurve |
|---|---|---|---|---|---|---|---|
| A | 7019 | 6390 | 23 | 23 | 0.33% | 0.36% | 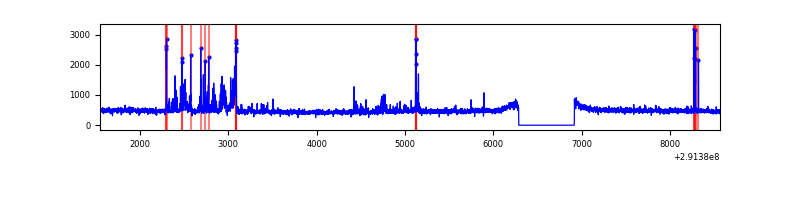 |
| B | 7018 | 6389 | 1642 | 1642 | 23.40% | 25.70% | 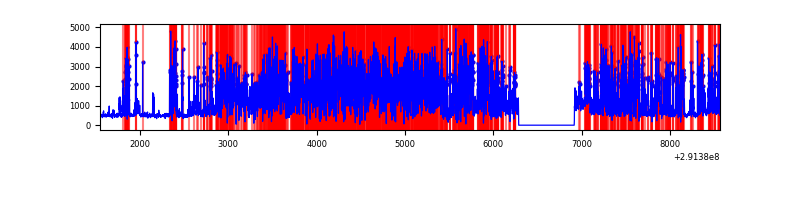 |
| C | 7019 | 6390 | 1 | 1 | 0.01% | 0.02% | 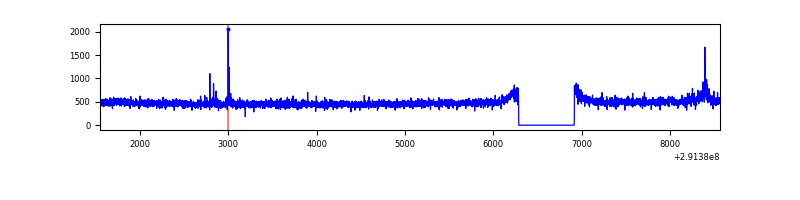 |
| D | 7018 | 6389 | 101 | 101 | 1.44% | 1.58% | 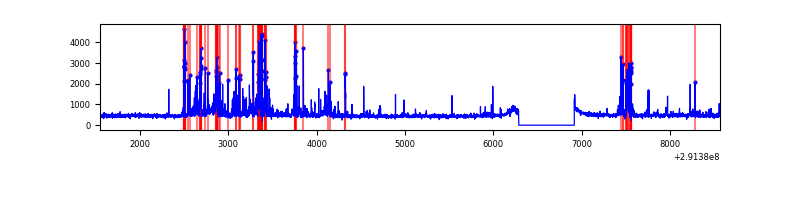 |
Top three noisy pixels from each quadrant. If the there are fewer than three noisy pixels in the level2.evt file, extra rows are filled as -1
| Pixel properties | Quadrant properties | ||||||
|---|---|---|---|---|---|---|---|
| Quadrant | DetID | PixID | Counts | Sigma | Mean | Median | Sigma |
| A | 6 | 16 | 286861 | 1855.04 | 771 | 755 | 154.2 |
| A | 13 | 254 | 8379 | 49.43 | 771 | 755 | 154.2 |
| A | 0 | 226 | 6567 | 37.68 | 771 | 755 | 154.2 |
| B | 3 | 112 | 6807668 | 69328.18 | 513 | 500 | 98.2 |
| B | 7 | 220 | 122333 | 1240.82 | 513 | 500 | 98.2 |
| B | 0 | 189 | 72327 | 731.53 | 513 | 500 | 98.2 |
| C | 14 | 238 | 114469 | 666.09 | 737 | 742 | 170.7 |
| C | 3 | 233 | 72147 | 418.21 | 737 | 742 | 170.7 |
| C | 0 | 207 | 21793 | 123.29 | 737 | 742 | 170.7 |
| D | 1 | 52 | 425146 | 2320.59 | 746 | 722 | 182.9 |
| D | 7 | 96 | 160743 | 874.93 | 746 | 722 | 182.9 |
| D | 10 | 199 | 93774 | 508.77 | 746 | 722 | 182.9 |
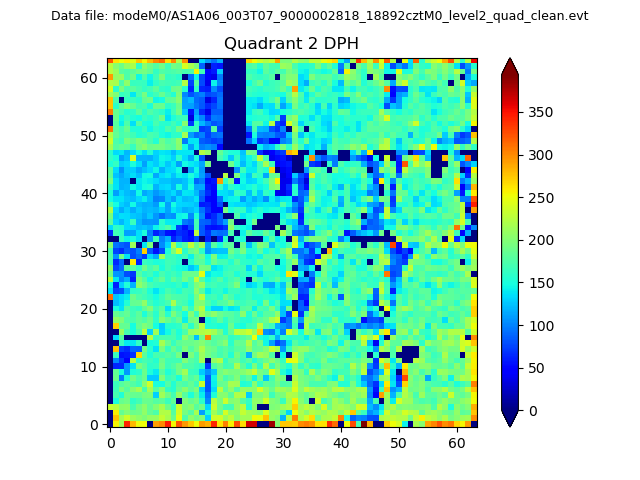
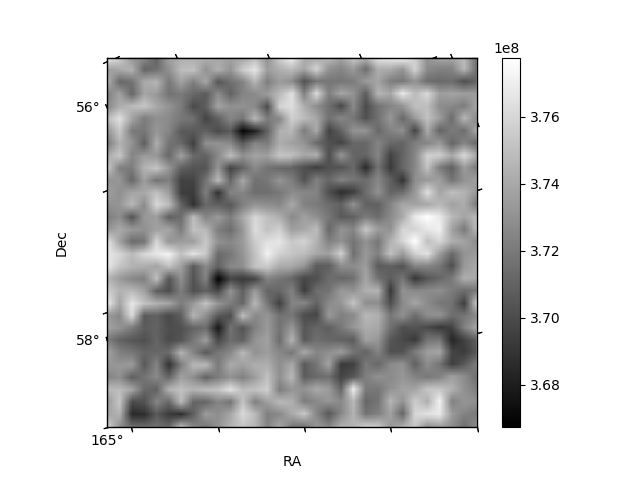
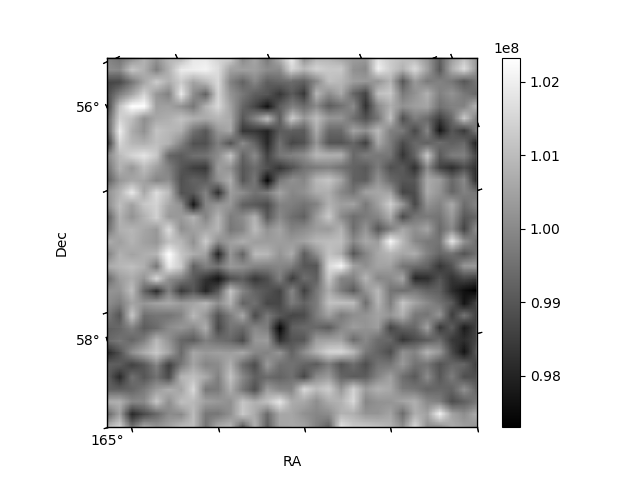
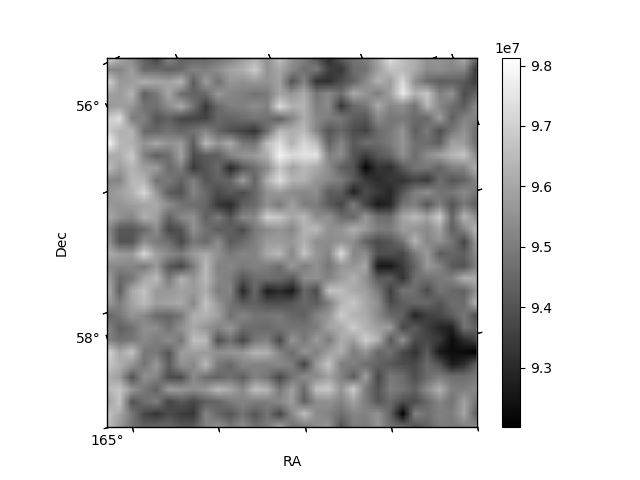
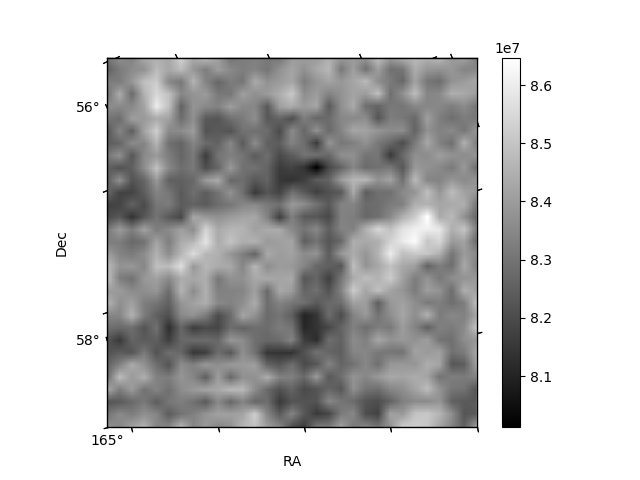
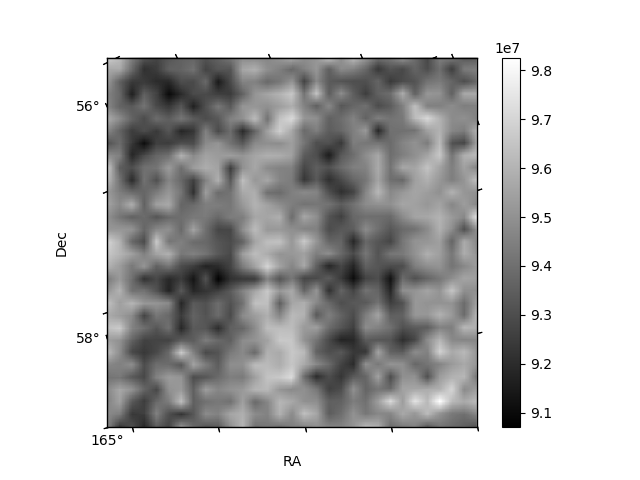
Histogram calculated using DETX and DETY for each event in the final _common_clean file
| Quadrant A | 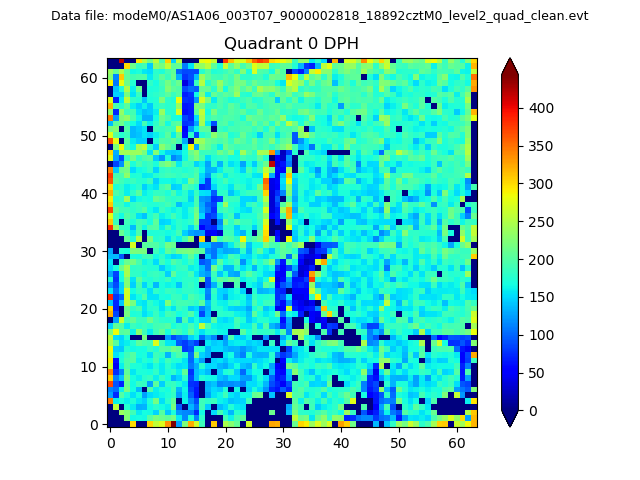 |
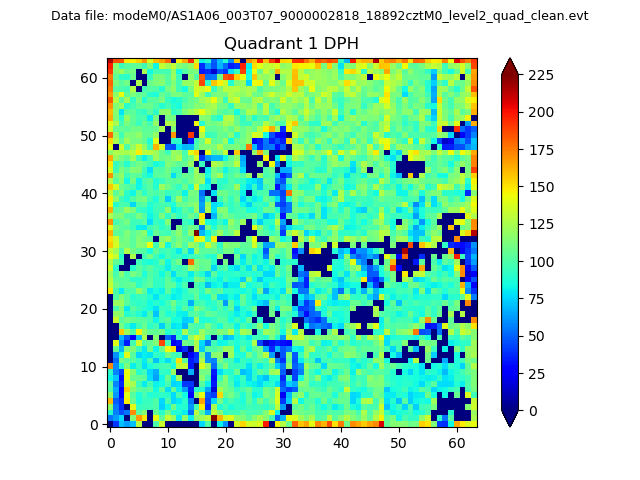 |
Quadrant B |
|---|---|---|---|
| Quadrant D | 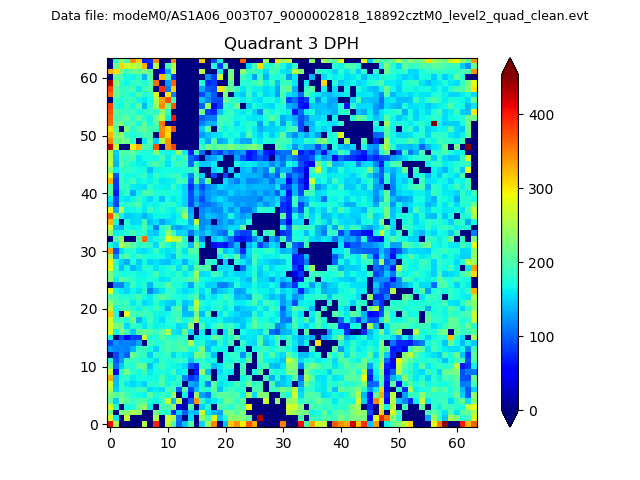 |
 |
Quadrant C |
| Plot type | Count rate plots | Images |
|---|---|---|
| Comparison with Poisson distribution Blue bars denote a histogram of data divided into 1 sec bins. Red curve is a Poisson curve with rate = median count rate of data. |
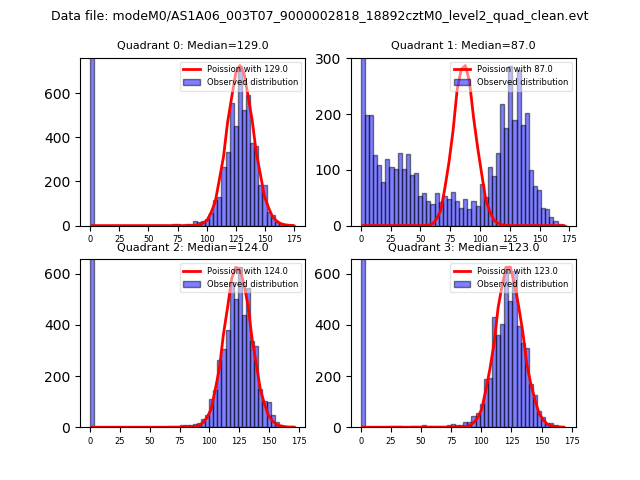 |
 |
| Quadrant-wise count rates Data is divided into 100 sec bins |
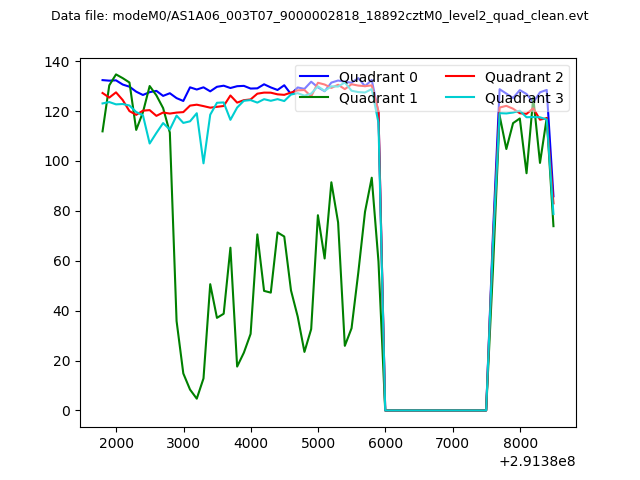 |
|
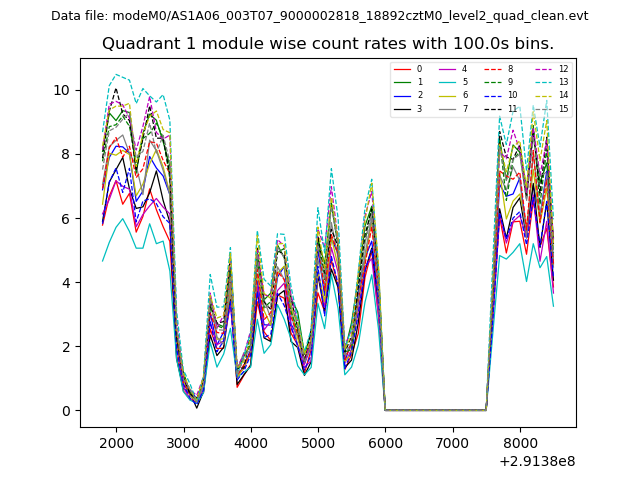
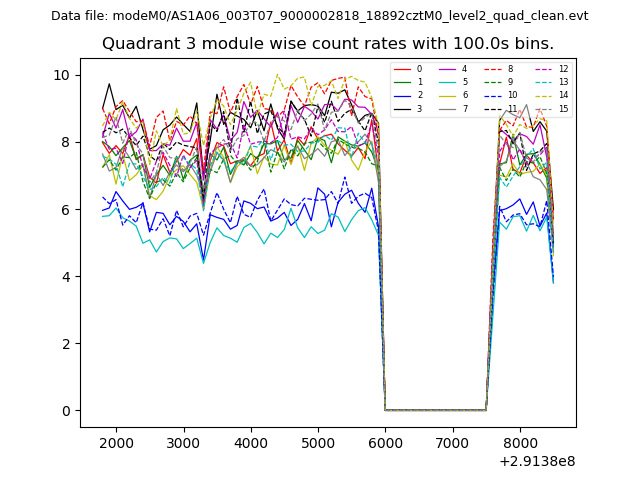
| Module-wise count rates for Quadrant A Data is divided into 100 sec bins |
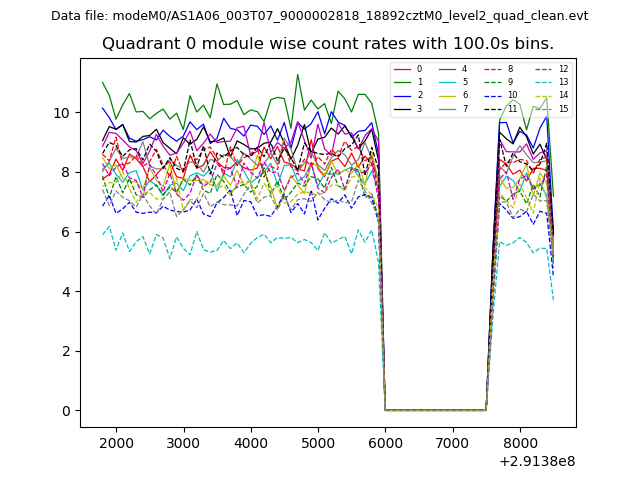 |
 |
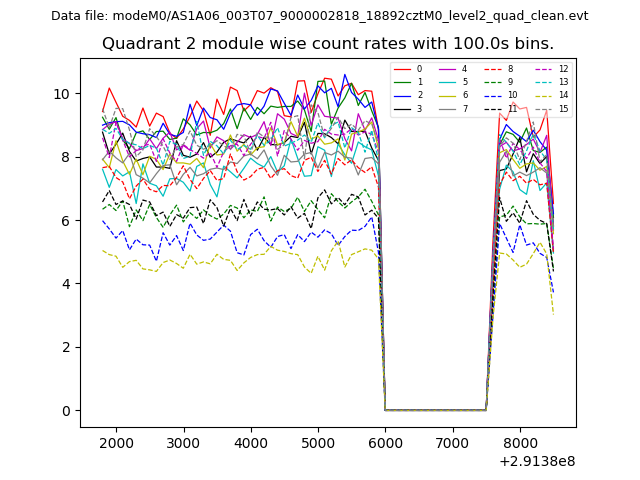
| Module-wise count rates for Quadrant B Data is divided into 100 sec bins |
 |
 |
| Module-wise count rates for Quadrant C Data is divided into 100 sec bins |
 |
 |
| Module-wise count rates for Quadrant D Data is divided into 100 sec bins |
 |
 |
| Parameter | Plot |
|---|---|
| CZT HV Monitor | 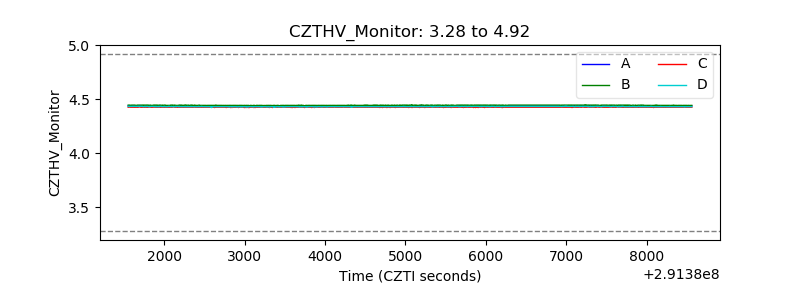 |
| D_VDD | 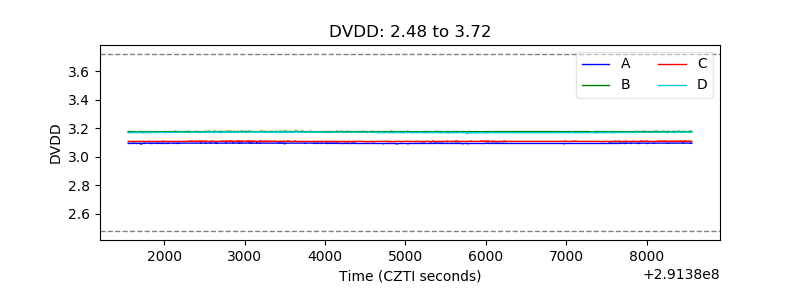 |
| Temperature 1 | 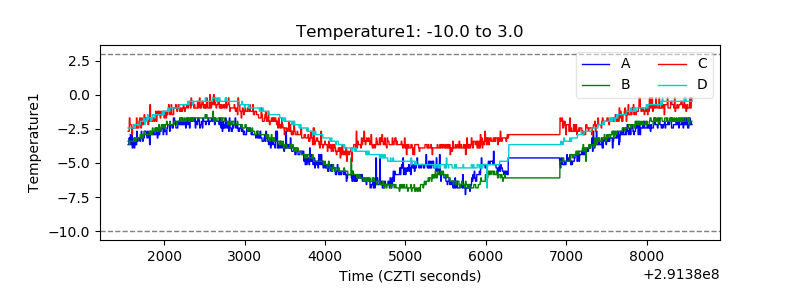 |
| Veto HV Monitor | 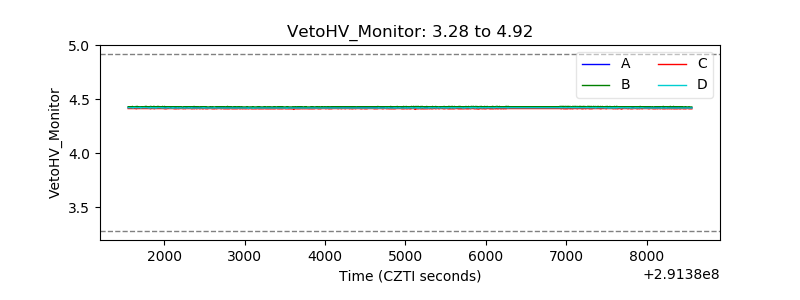 |
| Veto LLD | 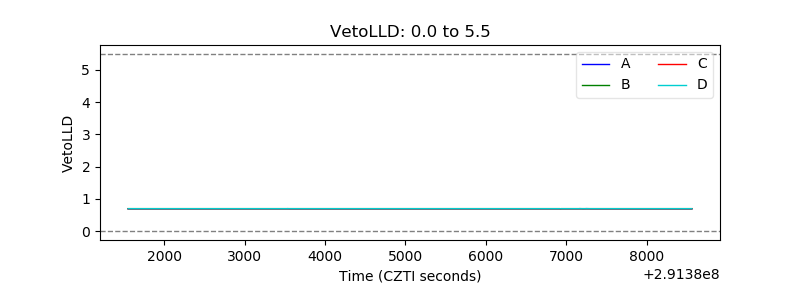 |
| Alpha Counter | 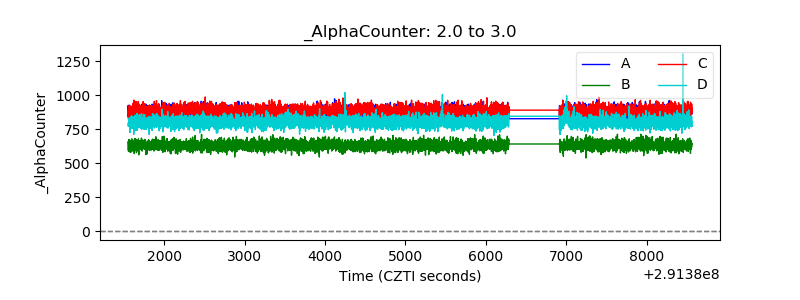 |
| _CPM_Rate | 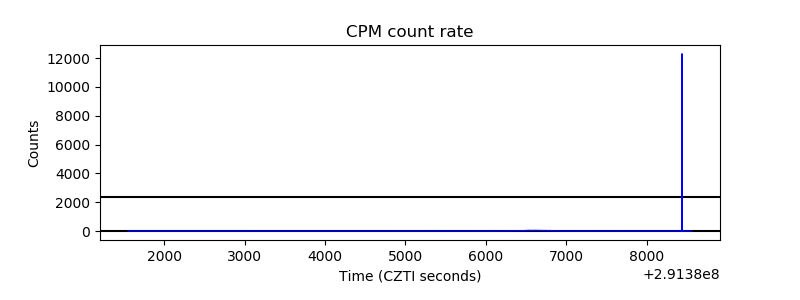 |
| CZT Counter | 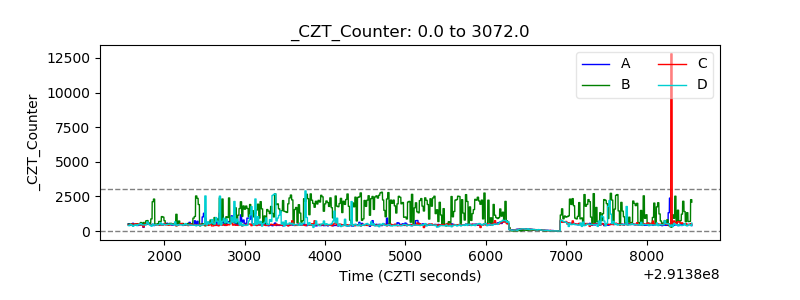 |
| +2.5 Volts monitor | 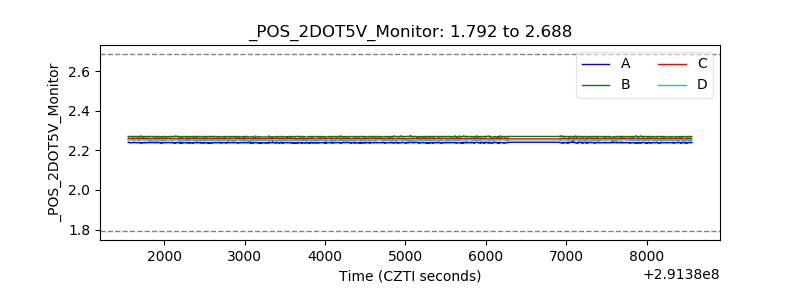 |
| +5 Volts monitor |  |
| _ROLL_ROT | 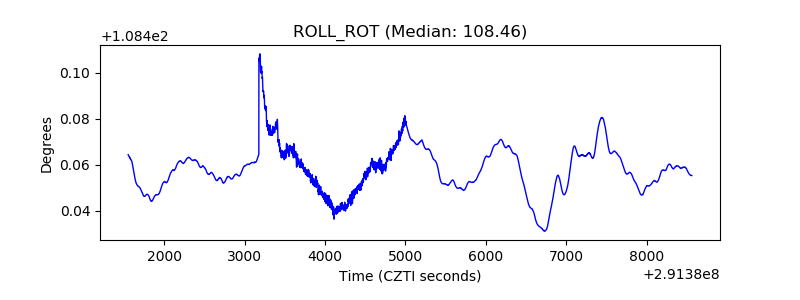 |
| _Roll_DEC | 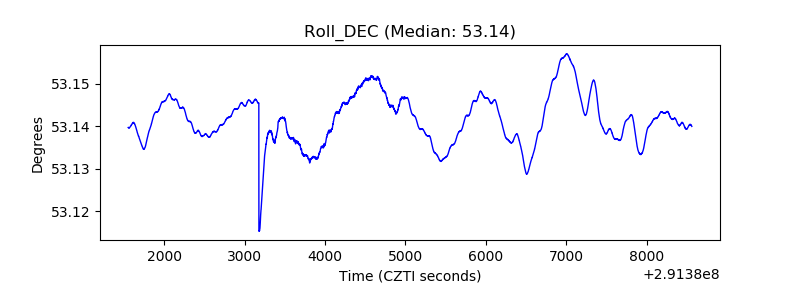 |
| _Roll_RA | 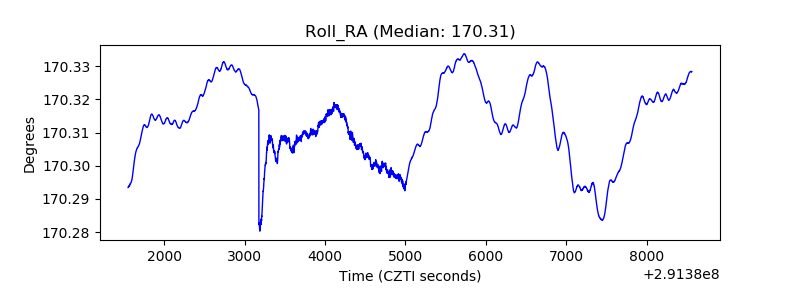 |
| Veto Counter | 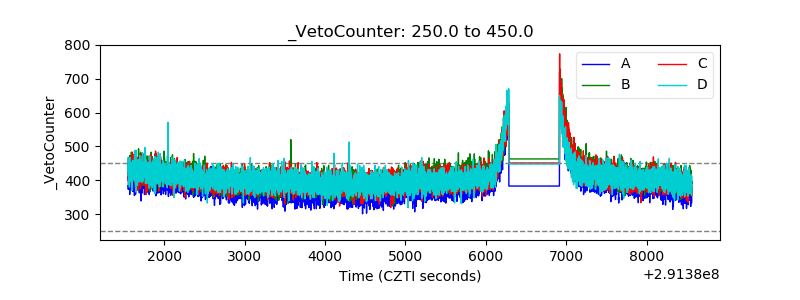 |