| Param | Original file | Final file |
|---|---|---|
| Filename | modeM0/AS1A06_003T07_9000002818_18894cztM0_level2.evt | modeM0/AS1A06_003T07_9000002818_18894cztM0_level2_quad_clean.evt |
| Size (bytes) | 664,853,760 | 107,853,120 |
| Size | 634.1 MB | 102.9 MB |
| Events in quadrant A | 3,689,300 | 719,093 |
| Events in quadrant B | 7,502,849 | 646,856 |
| Events in quadrant C | 3,723,474 | 692,961 |
| Events in quadrant D | 4,693,975 | 667,880 |
| Mode SS | |||
|---|---|---|---|
| Quadrant | BADHDUFLAG | Total packets | Discarded packets |
| A | 0 | 162 | 0 |
| B | 0 | 162 | 0 |
| C | 0 | 162 | 0 |
| D | 0 | 162 | 0 |
| Mode M9 | |||
|---|---|---|---|
| Quadrant | BADHDUFLAG | Total packets | Discarded packets |
| A | 0 | 2 | 0 |
| B | 0 | 2 | 0 |
| C | 0 | 2 | 0 |
| D | 0 | 2 | 0 |
| Mode M0 | |||
|---|---|---|---|
| Quadrant | BADHDUFLAG | Total packets | Discarded packets |
| A | 0 | 16097 | 4 |
| B | 0 | 27465 | 4 |
| C | 0 | 16063 | 4 |
| D | 0 | 19165 | 4 |
| Quadrant | Total seconds | Saturated seconds | Saturation percentage |
|---|---|---|---|
| A | 7741 | 142 | 1.834388% |
| B | 7741 | 1455 | 18.796021% |
| C | 7741 | 189 | 2.441545% |
| D | 7742 | 324 | 4.184965% |
Noise dominated data is calculated using 1-second bins in cleaned event files. If a bin has >2000 counts, and if more than 50% of those come from <1% of pixels, then it is considered to be noise-dominated and hence unusable.
| Quadrant | # 1 sec bins | Bins with >0 counts | Bins with >2000 counts | High rate bins dominated by noise | Noise dominated (total time) | Noise dominated (detector-on time) | Marked lightcurve |
|---|---|---|---|---|---|---|---|
| A | 8051 | 7745 | 0 | 0 | 0.00% | 0.00% | 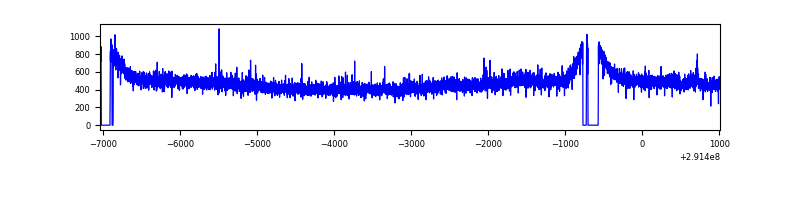 |
| B | 8051 | 7745 | 902 | 902 | 11.20% | 11.65% | 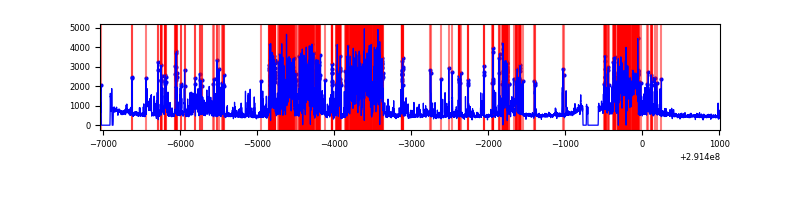 |
| C | 8051 | 7745 | 0 | 0 | 0.00% | 0.00% | 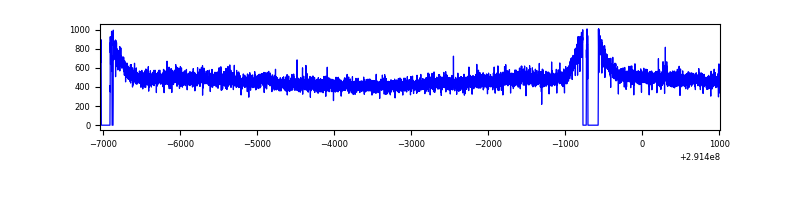 |
| D | 8052 | 7746 | 166 | 166 | 2.06% | 2.14% | 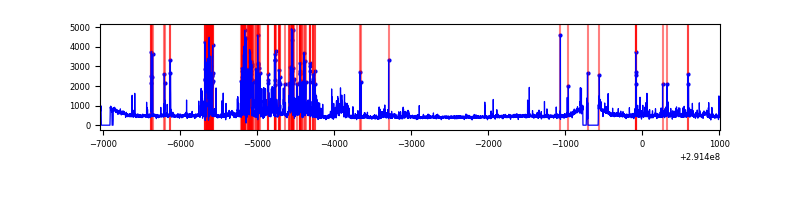 |
Top three noisy pixels from each quadrant. If the there are fewer than three noisy pixels in the level2.evt file, extra rows are filled as -1
| Pixel properties | Quadrant properties | ||||||
|---|---|---|---|---|---|---|---|
| Quadrant | DetID | PixID | Counts | Sigma | Mean | Median | Sigma |
| A | 9 | 143 | 19528 | 96.9 | 949 | 928 | 191.9 |
| A | 6 | 16 | 11315 | 54.11 | 949 | 928 | 191.9 |
| A | 13 | 254 | 10262 | 48.63 | 949 | 928 | 191.9 |
| B | 3 | 112 | 3642241 | 21483.67 | 879 | 854 | 169.5 |
| B | 7 | 220 | 208026 | 1222.29 | 879 | 854 | 169.5 |
| B | 0 | 189 | 115698 | 677.56 | 879 | 854 | 169.5 |
| C | 14 | 238 | 140198 | 653.23 | 908 | 911 | 213.2 |
| C | 3 | 233 | 40358 | 185.0 | 908 | 911 | 213.2 |
| C | 13 | 61 | 6426 | 25.86 | 908 | 911 | 213.2 |
| D | 12 | 1 | 516278 | 2304.1 | 915 | 886 | 223.7 |
| D | 7 | 238 | 438869 | 1958.04 | 915 | 886 | 223.7 |
| D | 9 | 1 | 93509 | 414.08 | 915 | 886 | 223.7 |
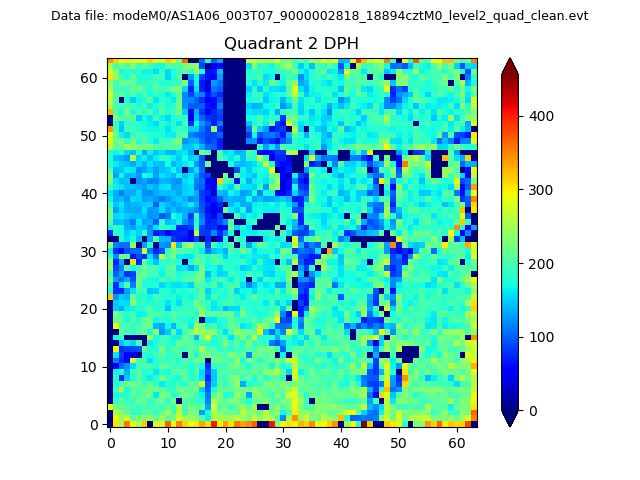
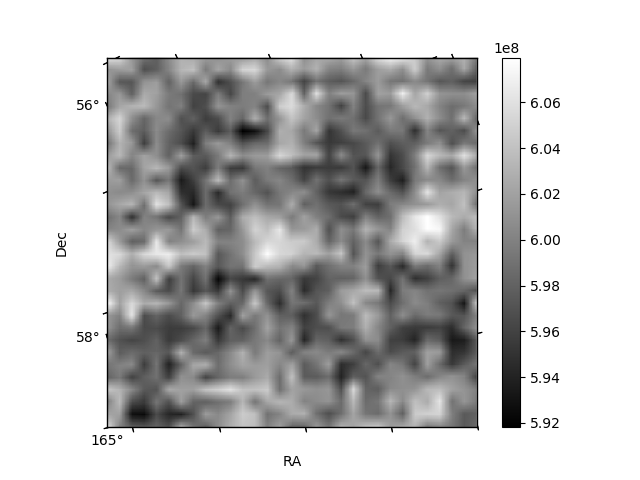
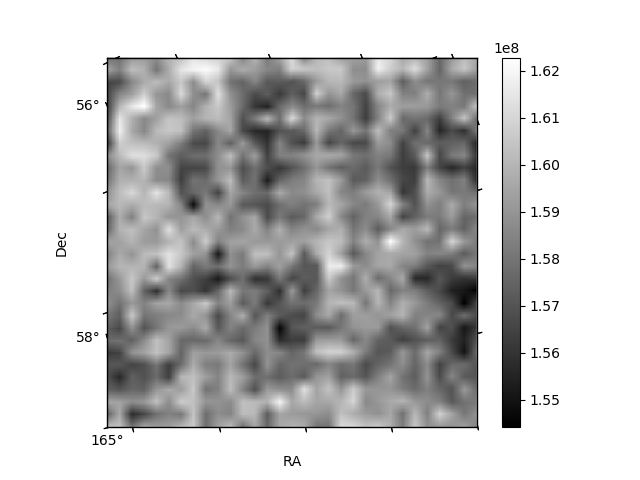
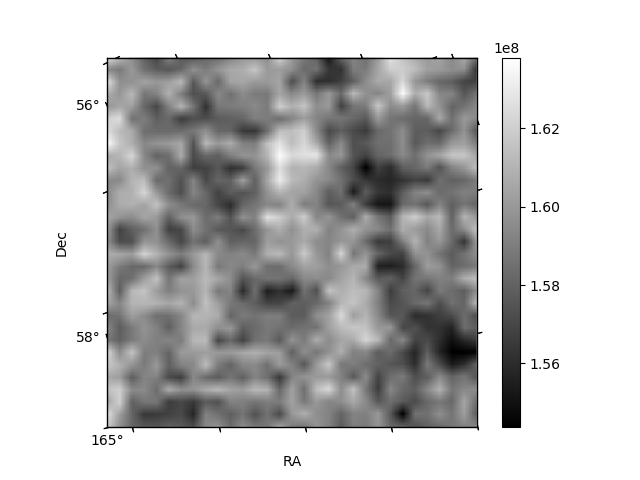
Histogram calculated using DETX and DETY for each event in the final _common_clean file
| Quadrant A | 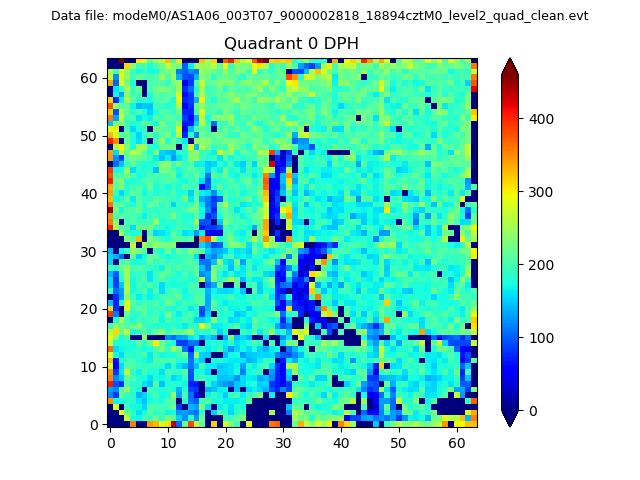 |
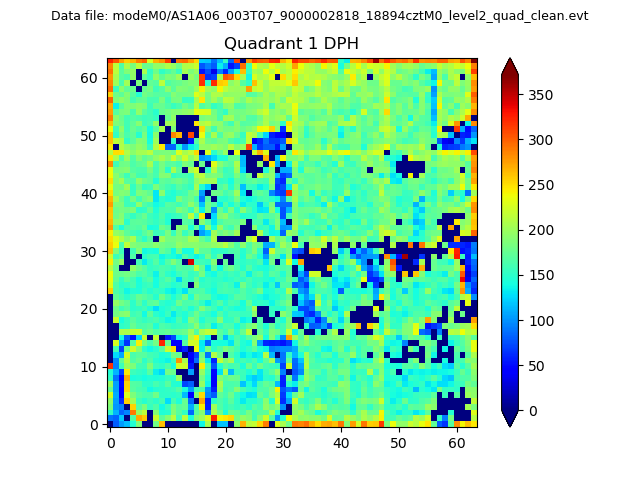 |
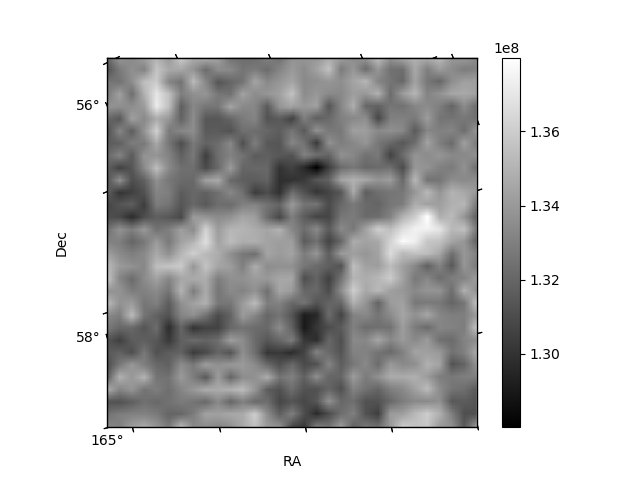
Quadrant B |
|---|---|---|---|
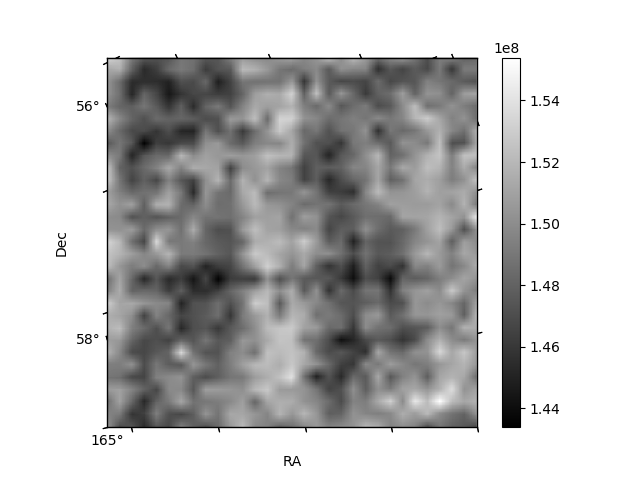
| Quadrant D | 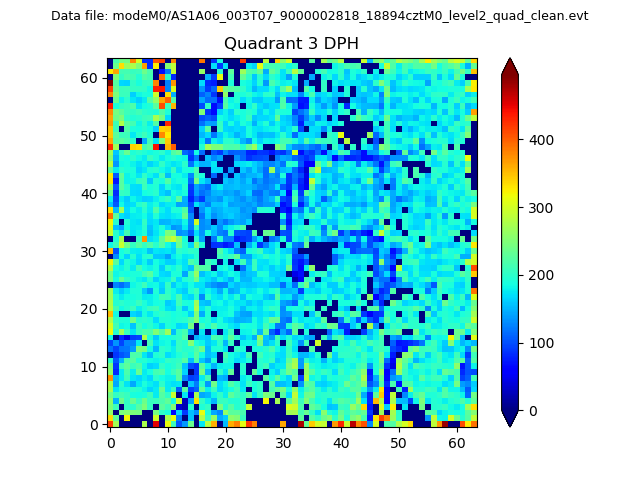 |
 |
Quadrant C |
| Plot type | Count rate plots | Images |
|---|---|---|
| Comparison with Poisson distribution Blue bars denote a histogram of data divided into 1 sec bins. Red curve is a Poisson curve with rate = median count rate of data. |
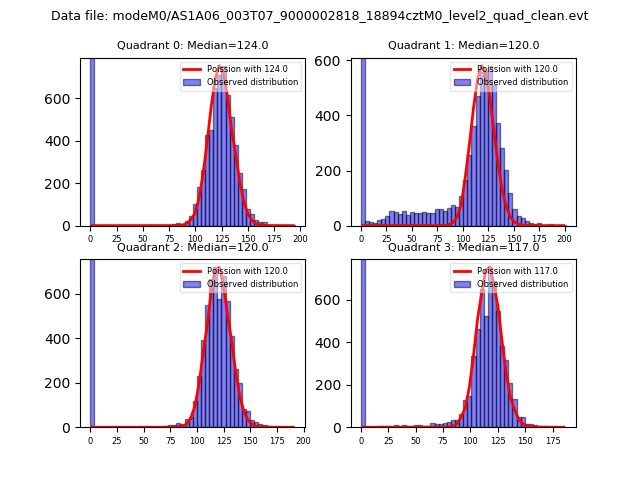 |
 |
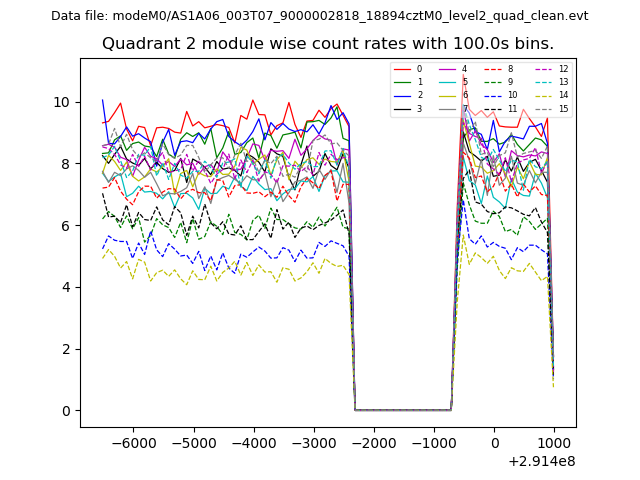
| Quadrant-wise count rates Data is divided into 100 sec bins |
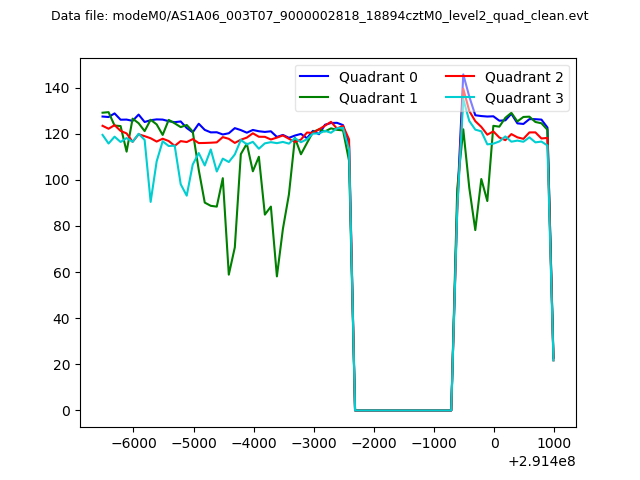 |
|
| Module-wise count rates for Quadrant A Data is divided into 100 sec bins |
 |
 |
| Module-wise count rates for Quadrant B Data is divided into 100 sec bins |
 |
 |
| Module-wise count rates for Quadrant C Data is divided into 100 sec bins |
 |
 |
| Module-wise count rates for Quadrant D Data is divided into 100 sec bins |
 |
 |
| Parameter | Plot |
|---|---|
| CZT HV Monitor | 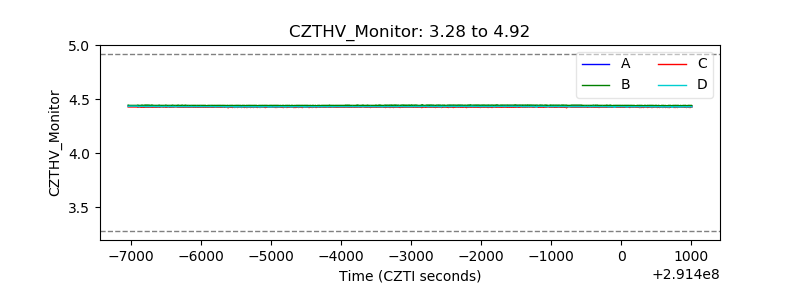 |
| D_VDD | 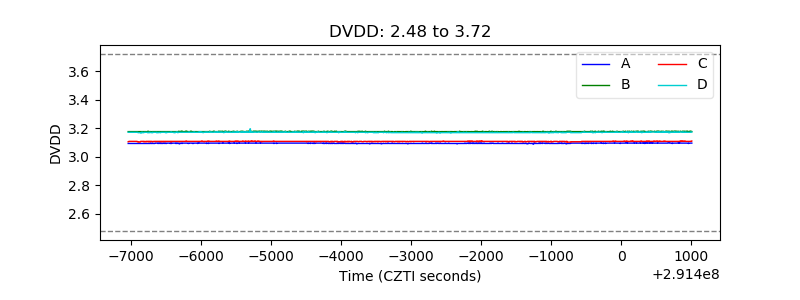 |
| Temperature 1 | 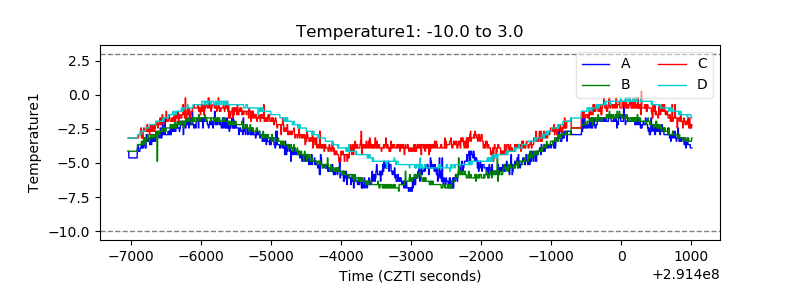 |
| Veto HV Monitor | 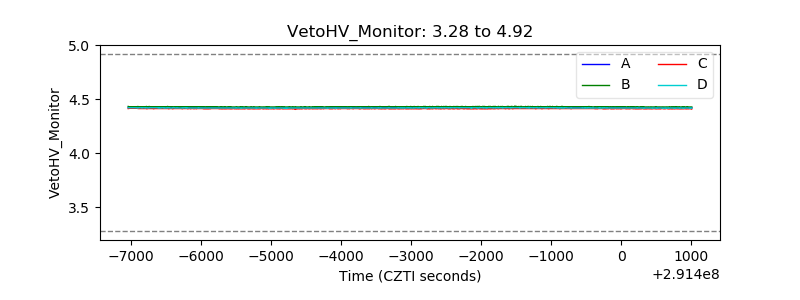 |
| Veto LLD | 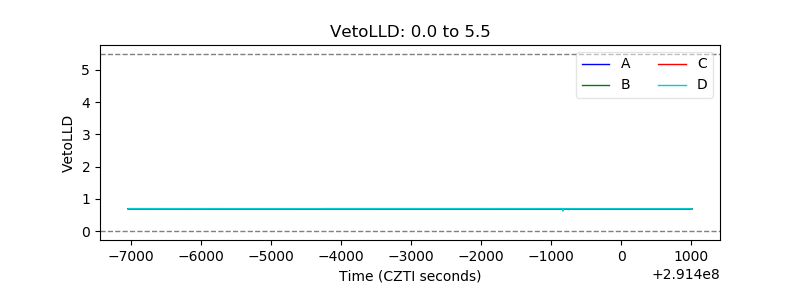 |
| Alpha Counter | 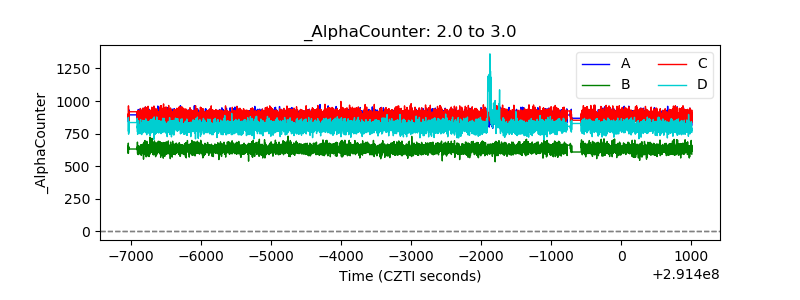 |
| _CPM_Rate | 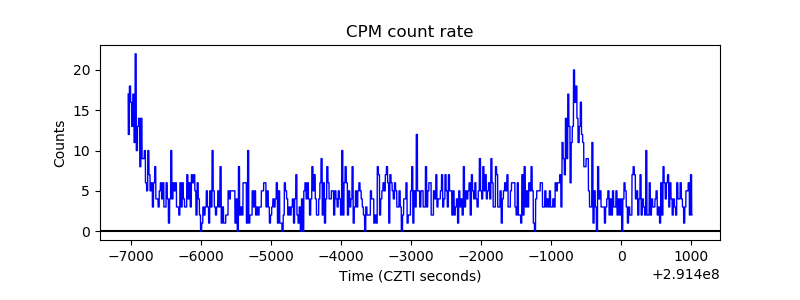 |
| CZT Counter | 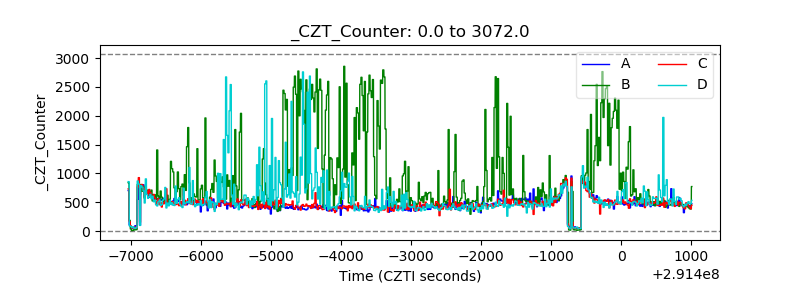 |
| +2.5 Volts monitor |  |
| +5 Volts monitor |  |
| _ROLL_ROT | 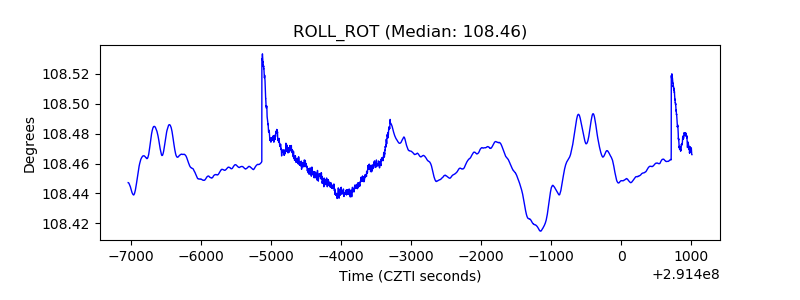 |
| _Roll_DEC |  |
| _Roll_RA | 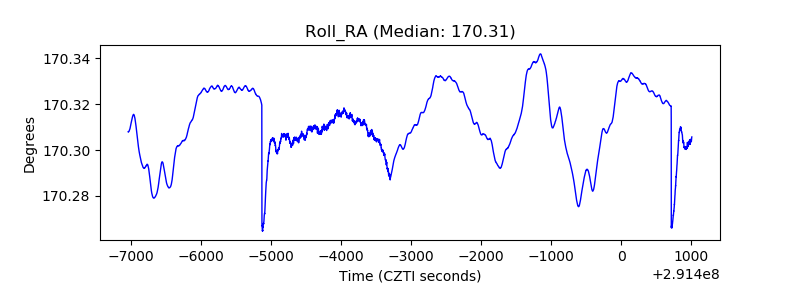 |
| Veto Counter |  |