| Param | Original file | Final file |
|---|---|---|
| Filename | modeM0/AS1A06_003T07_9000002818_18895cztM0_level2.evt | modeM0/AS1A06_003T07_9000002818_18895cztM0_level2_quad_clean.evt |
| Size (bytes) | 524,180,160 | 101,537,280 |
| Size | 499.9 MB | 96.8 MB |
| Events in quadrant A | 3,319,925 | 667,677 |
| Events in quadrant B | 4,808,566 | 640,638 |
| Events in quadrant C | 3,285,902 | 645,060 |
| Events in quadrant D | 3,981,013 | 629,634 |
| Mode SS | |||
|---|---|---|---|
| Quadrant | BADHDUFLAG | Total packets | Discarded packets |
| A | 0 | 144 | 0 |
| B | 0 | 144 | 0 |
| C | 0 | 144 | 0 |
| D | 0 | 144 | 0 |
| Mode M9 | |||
|---|---|---|---|
| Quadrant | BADHDUFLAG | Total packets | Discarded packets |
| A | 0 | 4 | 0 |
| B | 0 | 4 | 0 |
| C | 0 | 4 | 0 |
| D | 0 | 4 | 0 |
| Mode M0 | |||
|---|---|---|---|
| Quadrant | BADHDUFLAG | Total packets | Discarded packets |
| A | 0 | 14548 | 1 |
| B | 0 | 18989 | 1 |
| C | 0 | 14396 | 1 |
| D | 0 | 16757 | 1 |
| Quadrant | Total seconds | Saturated seconds | Saturation percentage |
|---|---|---|---|
| A | 7058 | 29 | 0.410881% |
| B | 7059 | 523 | 7.408981% |
| C | 7059 | 67 | 0.949143% |
| D | 7059 | 135 | 1.912452% |
Noise dominated data is calculated using 1-second bins in cleaned event files. If a bin has >2000 counts, and if more than 50% of those come from <1% of pixels, then it is considered to be noise-dominated and hence unusable.
| Quadrant | # 1 sec bins | Bins with >0 counts | Bins with >2000 counts | High rate bins dominated by noise | Noise dominated (total time) | Noise dominated (detector-on time) | Marked lightcurve |
|---|---|---|---|---|---|---|---|
| A | 7463 | 7059 | 0 | 0 | 0.00% | 0.00% | 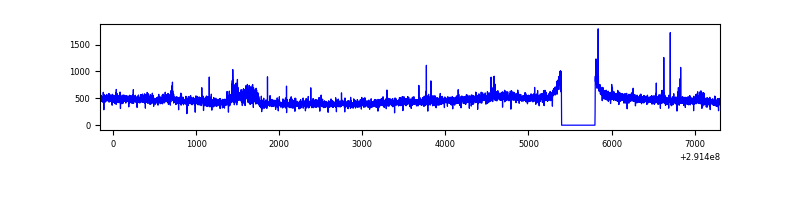 |
| B | 7464 | 7060 | 320 | 320 | 4.29% | 4.53% | 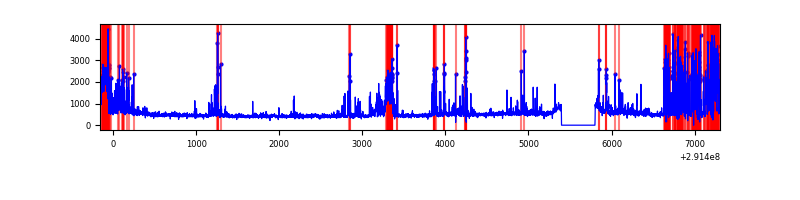 |
| C | 7464 | 7060 | 0 | 0 | 0.00% | 0.00% | 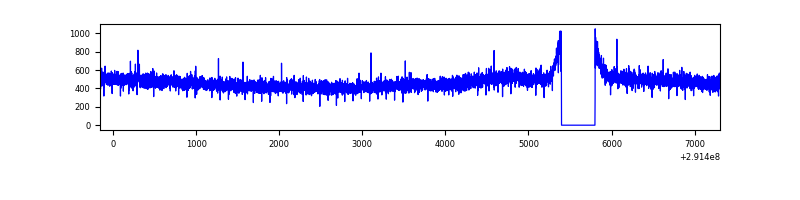 |
| D | 7464 | 7060 | 75 | 75 | 1.00% | 1.06% | 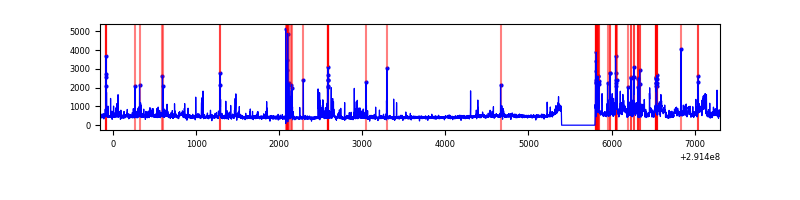 |
Top three noisy pixels from each quadrant. If the there are fewer than three noisy pixels in the level2.evt file, extra rows are filled as -1
| Pixel properties | Quadrant properties | ||||||
|---|---|---|---|---|---|---|---|
| Quadrant | DetID | PixID | Counts | Sigma | Mean | Median | Sigma |
| A | 6 | 16 | 64596 | 376.36 | 835 | 818 | 169.5 |
| A | 9 | 143 | 21777 | 123.68 | 835 | 818 | 169.5 |
| A | 0 | 13 | 9772 | 52.84 | 835 | 818 | 169.5 |
| B | 3 | 112 | 1373829 | 8879.5 | 806 | 784 | 154.6 |
| B | 7 | 220 | 125441 | 806.16 | 806 | 784 | 154.6 |
| B | 4 | 216 | 49298 | 313.74 | 806 | 784 | 154.6 |
| C | 14 | 238 | 125198 | 659.31 | 804 | 806 | 188.7 |
| C | 3 | 233 | 22059 | 112.65 | 804 | 806 | 188.7 |
| C | 0 | 207 | 6744 | 31.47 | 804 | 806 | 188.7 |
| D | 7 | 238 | 254515 | 1282.65 | 810 | 785 | 197.8 |
| D | 12 | 110 | 248422 | 1251.85 | 810 | 785 | 197.8 |
| D | 12 | 1 | 227375 | 1145.46 | 810 | 785 | 197.8 |
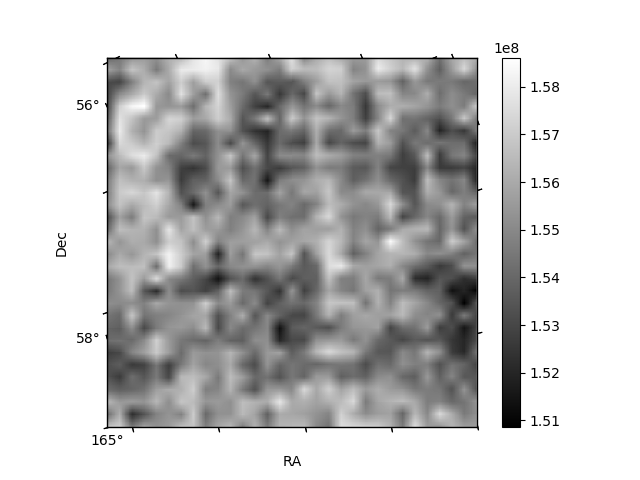
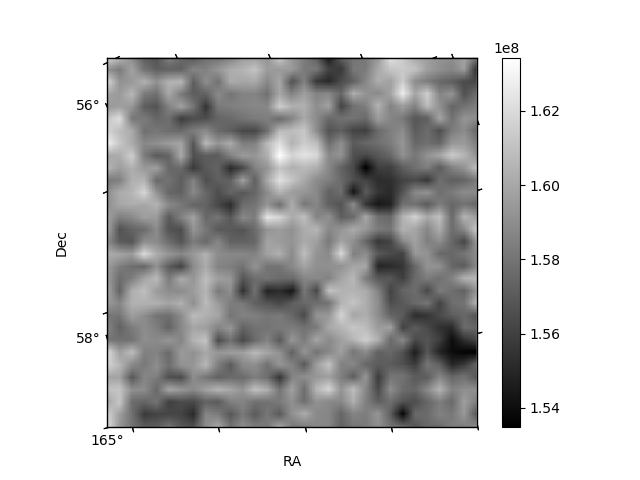
Histogram calculated using DETX and DETY for each event in the final _common_clean file
| Quadrant A | 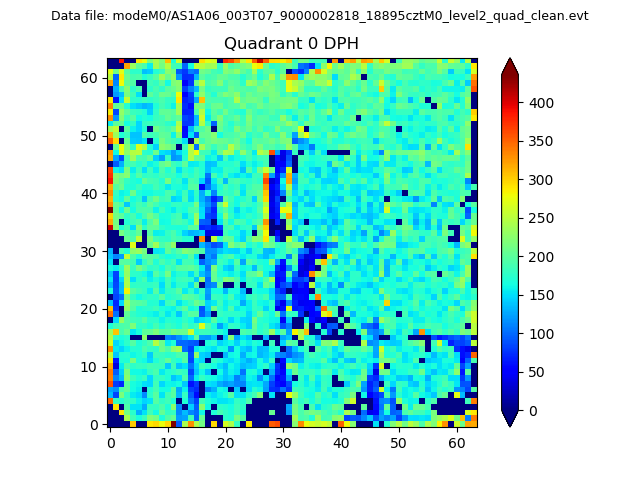 |
 |
Quadrant B |
|---|---|---|---|
| Quadrant D | 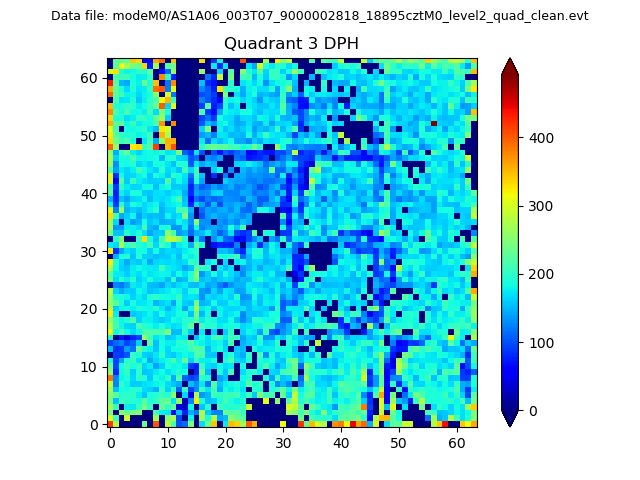 |
 |
Quadrant C |
| Plot type | Count rate plots | Images |
|---|---|---|
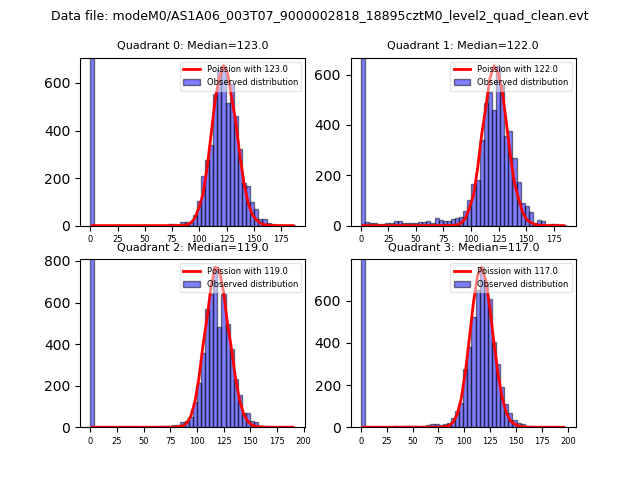
| Comparison with Poisson distribution Blue bars denote a histogram of data divided into 1 sec bins. Red curve is a Poisson curve with rate = median count rate of data. |
 |
 |
| Quadrant-wise count rates Data is divided into 100 sec bins |
 |
|
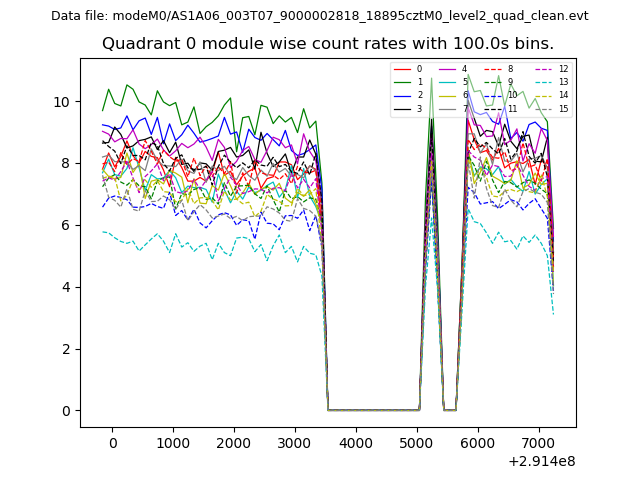
| Module-wise count rates for Quadrant A Data is divided into 100 sec bins |
 |
 |
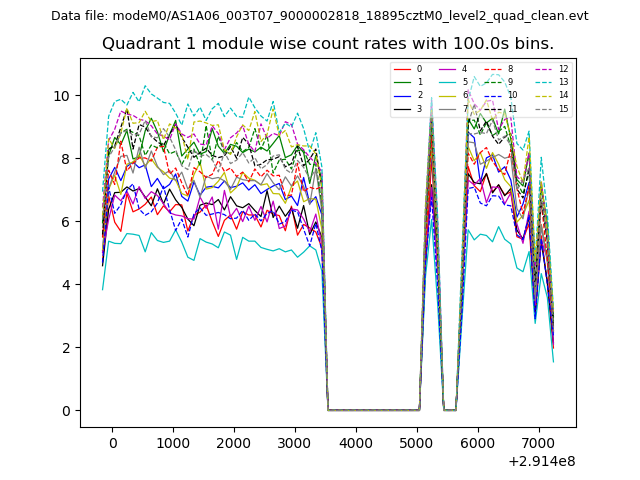
| Module-wise count rates for Quadrant B Data is divided into 100 sec bins |
 |
 |
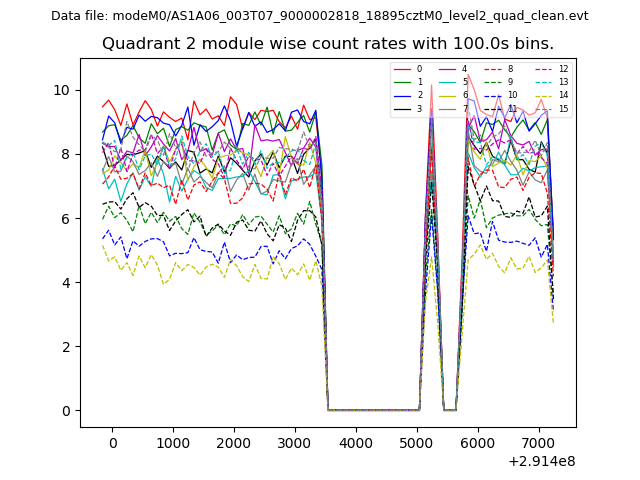
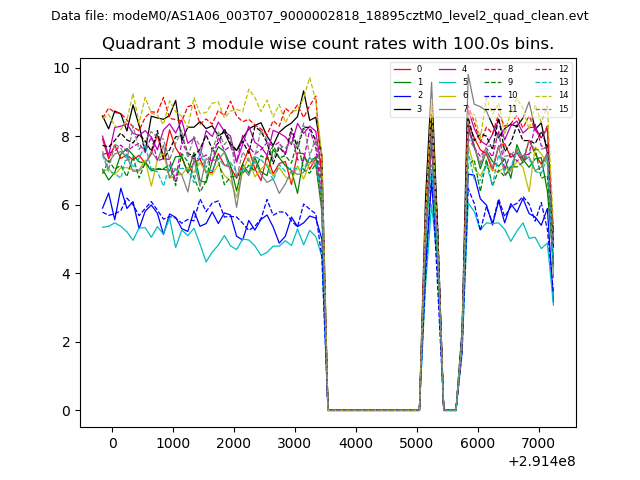
| Module-wise count rates for Quadrant C Data is divided into 100 sec bins |
 |
 |
| Module-wise count rates for Quadrant D Data is divided into 100 sec bins |
 |
 |
| Parameter | Plot |
|---|---|
| CZT HV Monitor | 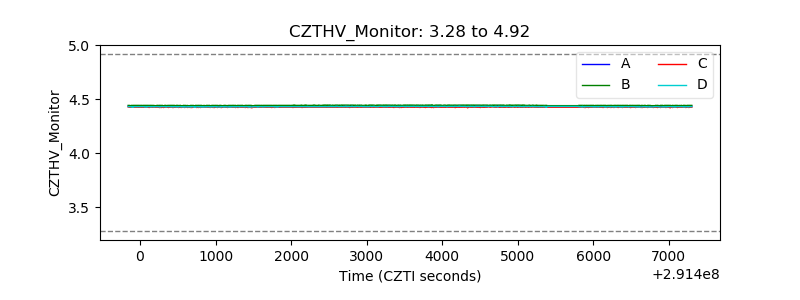 |
| D_VDD | 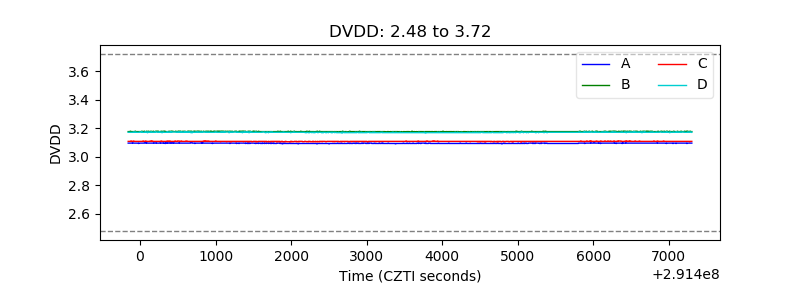 |
| Temperature 1 | 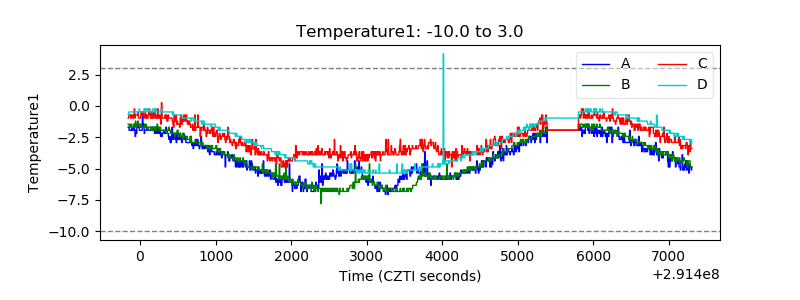 |
| Veto HV Monitor | 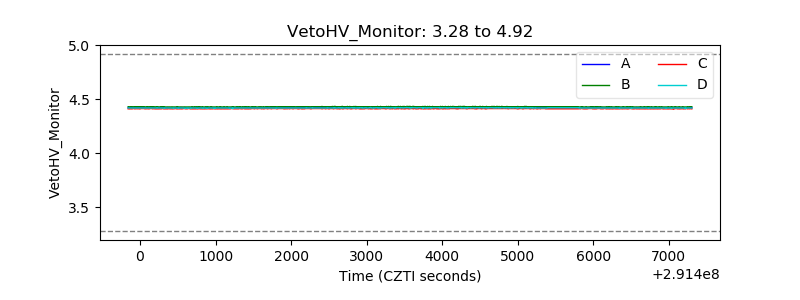 |
| Veto LLD | 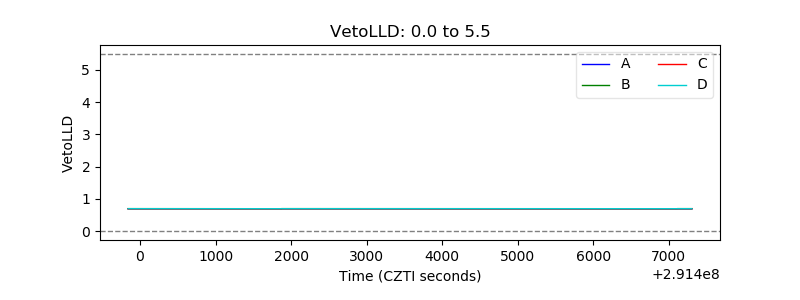 |
| Alpha Counter | 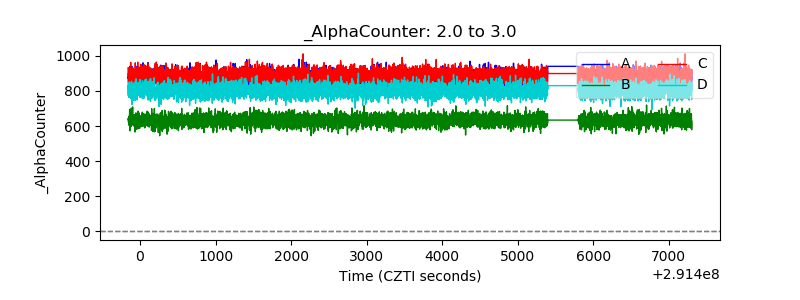 |
| _CPM_Rate | 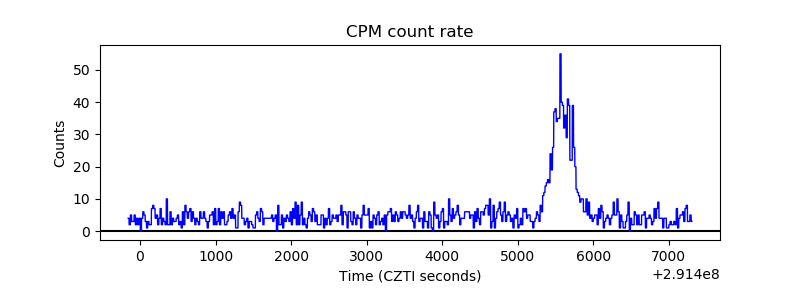 |
| CZT Counter |  |
| +2.5 Volts monitor |  |
| +5 Volts monitor |  |
| _ROLL_ROT | 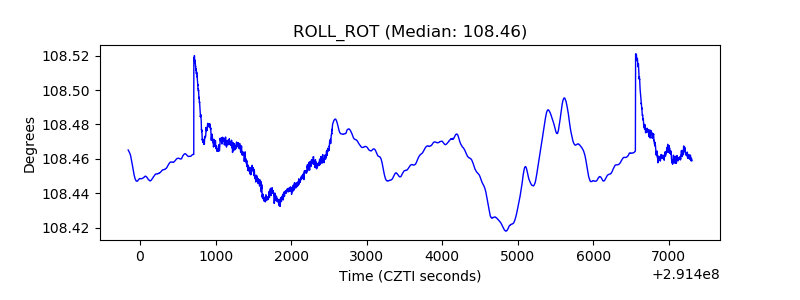 |
| _Roll_DEC | 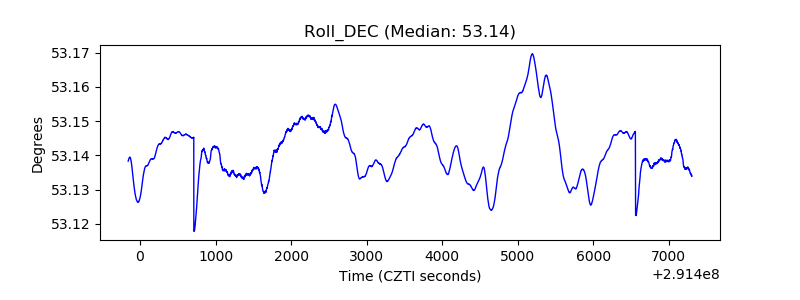 |
| _Roll_RA | 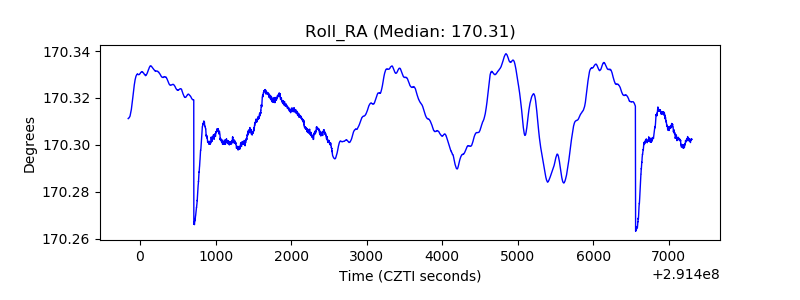 |
| Veto Counter | 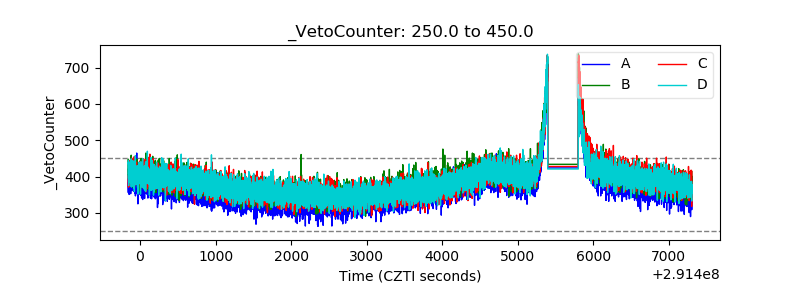 |