| Param | Original file | Final file |
|---|---|---|
| Filename | modeM0/AS1A06_003T07_9000002818_18897cztM0_level2.evt | modeM0/AS1A06_003T07_9000002818_18897cztM0_level2_quad_clean.evt |
| Size (bytes) | 1,023,641,280 | 176,224,320 |
| Size | 976.2 MB | 168.1 MB |
| Events in quadrant A | 5,699,993 | 1,151,766 |
| Events in quadrant B | 9,905,506 | 1,096,017 |
| Events in quadrant C | 5,831,655 | 1,123,870 |
| Events in quadrant D | 8,710,557 | 1,092,323 |
| Mode SS | |||
|---|---|---|---|
| Quadrant | BADHDUFLAG | Total packets | Discarded packets |
| A | 0 | 256 | 0 |
| B | 0 | 256 | 0 |
| C | 0 | 256 | 0 |
| D | 0 | 256 | 0 |
| Mode M9 | |||
|---|---|---|---|
| Quadrant | BADHDUFLAG | Total packets | Discarded packets |
| A | 0 | 14 | 0 |
| B | 0 | 14 | 0 |
| C | 0 | 14 | 0 |
| D | 0 | 14 | 0 |
| Mode M0 | |||
|---|---|---|---|
| Quadrant | BADHDUFLAG | Total packets | Discarded packets |
| A | 0 | 25694 | 2 |
| B | 0 | 37897 | 2 |
| C | 0 | 25678 | 2 |
| D | 0 | 34666 | 2 |
| Quadrant | Total seconds | Saturated seconds | Saturation percentage |
|---|---|---|---|
| A | 12630 | 42 | 0.332542% |
| B | 12630 | 1182 | 9.358670% |
| C | 12630 | 101 | 0.799683% |
| D | 12630 | 417 | 3.301663% |
Noise dominated data is calculated using 1-second bins in cleaned event files. If a bin has >2000 counts, and if more than 50% of those come from <1% of pixels, then it is considered to be noise-dominated and hence unusable.
| Quadrant | # 1 sec bins | Bins with >0 counts | Bins with >2000 counts | High rate bins dominated by noise | Noise dominated (total time) | Noise dominated (detector-on time) | Marked lightcurve |
|---|---|---|---|---|---|---|---|
| A | 14030 | 12632 | 0 | 0 | 0.00% | 0.00% | 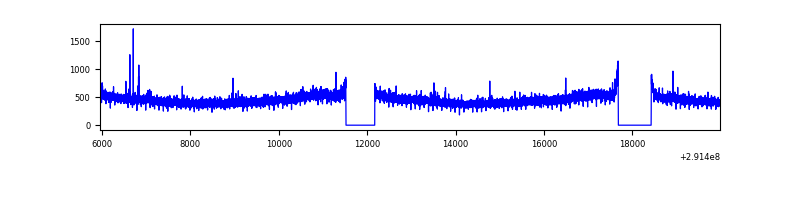 |
| B | 14030 | 12631 | 709 | 709 | 5.05% | 5.61% | 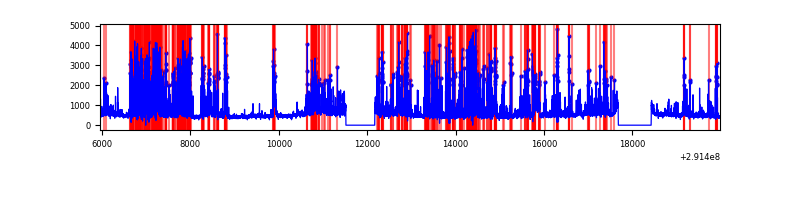 |
| C | 14030 | 12632 | 0 | 0 | 0.00% | 0.00% | 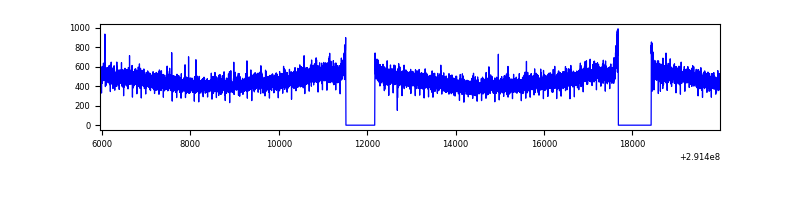 |
| D | 14030 | 12632 | 231 | 231 | 1.65% | 1.83% | 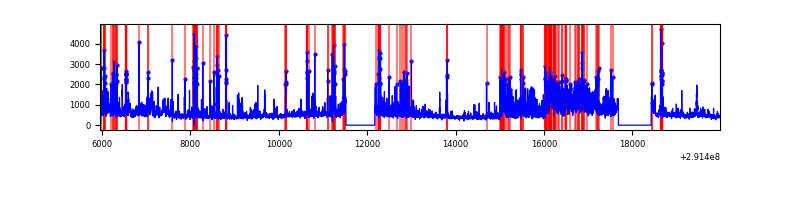 |
Top three noisy pixels from each quadrant. If the there are fewer than three noisy pixels in the level2.evt file, extra rows are filled as -1
| Pixel properties | Quadrant properties | ||||||
|---|---|---|---|---|---|---|---|
| Quadrant | DetID | PixID | Counts | Sigma | Mean | Median | Sigma |
| A | 9 | 143 | 21223 | 66.98 | 1470 | 1437 | 295.4 |
| A | 13 | 254 | 17595 | 54.7 | 1470 | 1437 | 295.4 |
| A | 0 | 226 | 12989 | 39.1 | 1470 | 1437 | 295.4 |
| B | 3 | 112 | 4104996 | 15314.03 | 1416 | 1379 | 268.0 |
| B | 10 | 247 | 78364 | 287.3 | 1416 | 1379 | 268.0 |
| B | 4 | 216 | 36280 | 130.24 | 1416 | 1379 | 268.0 |
| C | 14 | 238 | 222315 | 664.95 | 1422 | 1428 | 332.2 |
| C | 3 | 233 | 62737 | 184.56 | 1422 | 1428 | 332.2 |
| C | 13 | 61 | 10063 | 25.99 | 1422 | 1428 | 332.2 |
| D | 1 | 52 | 1868748 | 5439.45 | 1423 | 1381 | 343.3 |
| D | 12 | 110 | 503689 | 1463.17 | 1423 | 1381 | 343.3 |
| D | 12 | 1 | 450953 | 1309.56 | 1423 | 1381 | 343.3 |
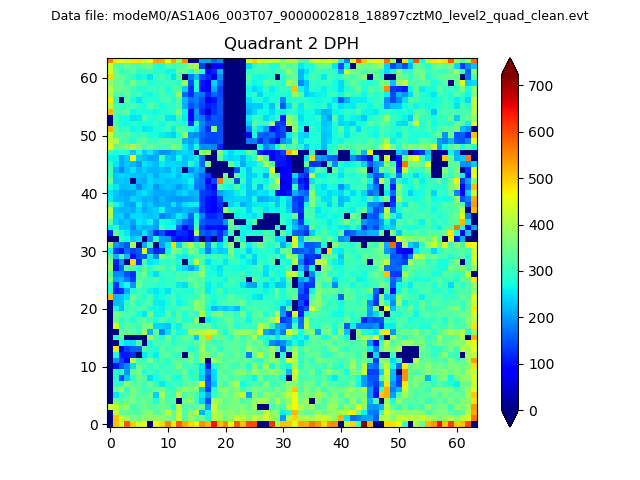
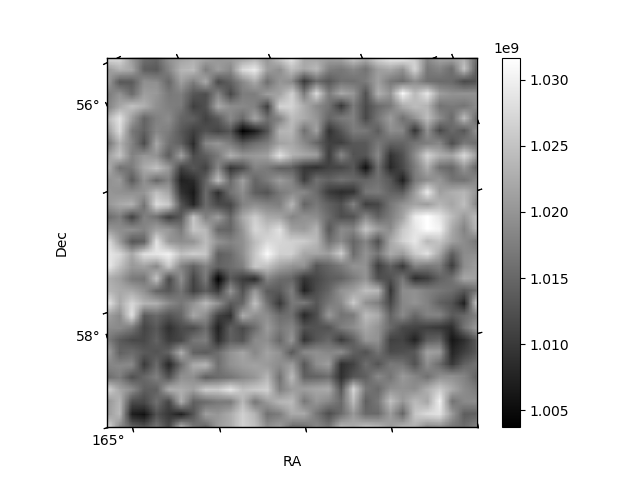
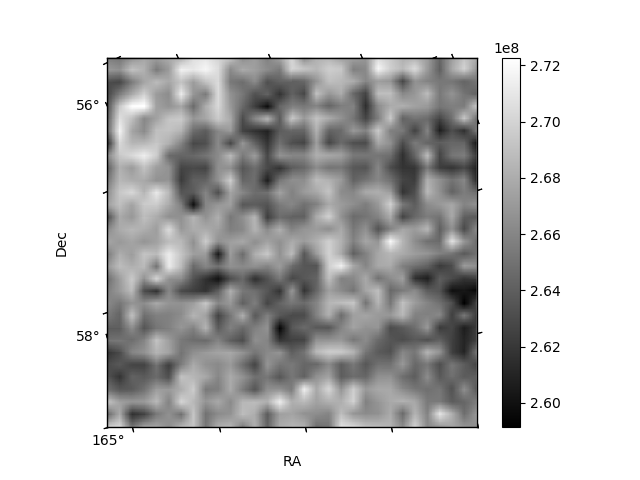
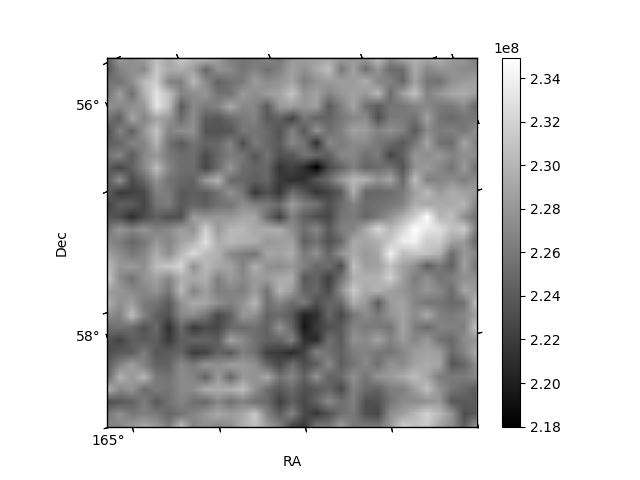
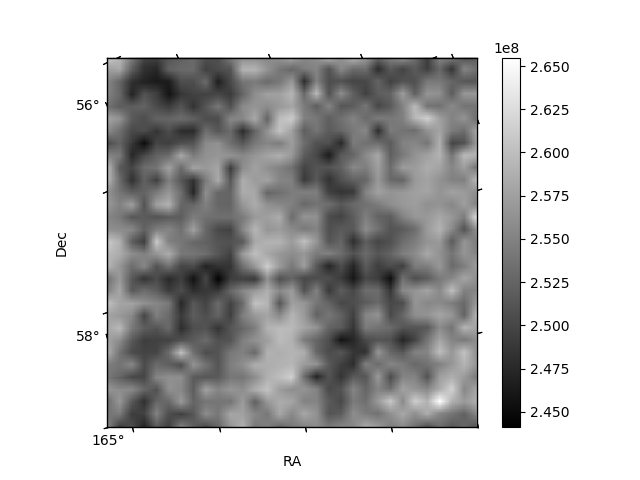
Histogram calculated using DETX and DETY for each event in the final _common_clean file
| Quadrant A | 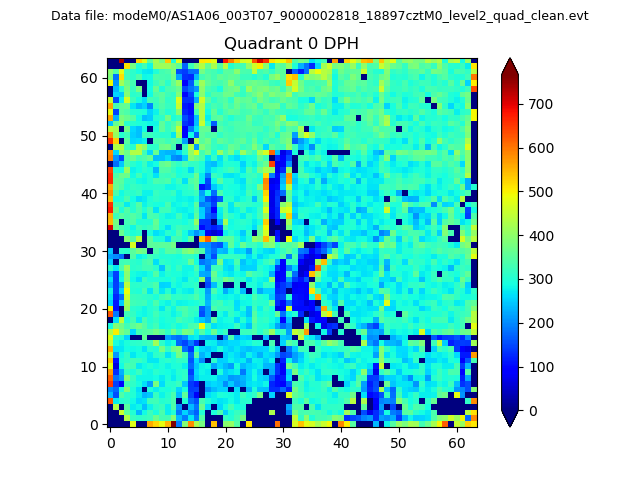 |
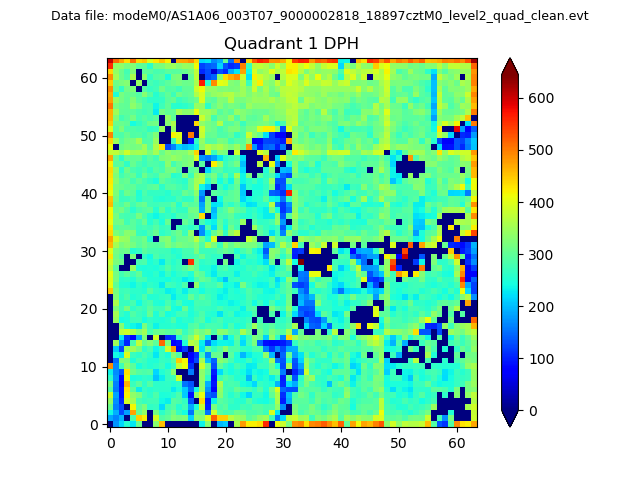 |
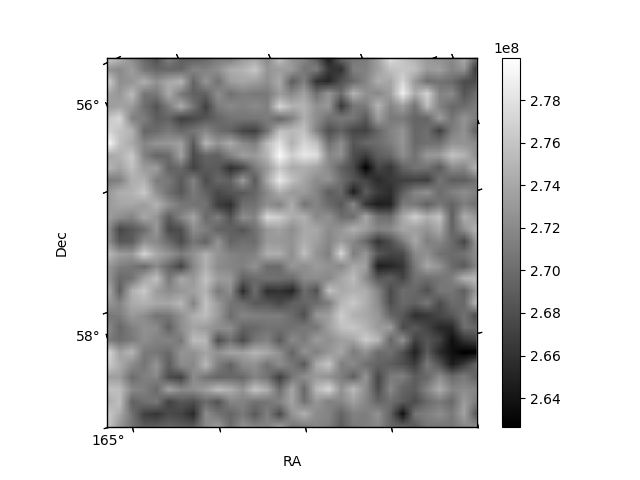
Quadrant B |
|---|---|---|---|
| Quadrant D | 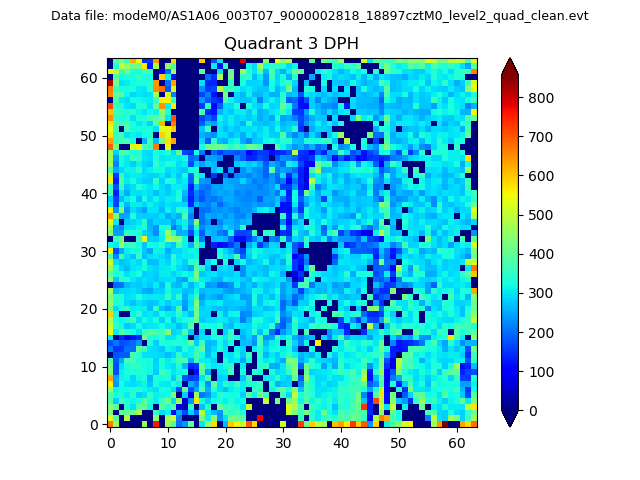 |
 |
Quadrant C |
| Plot type | Count rate plots | Images |
|---|---|---|
| Comparison with Poisson distribution Blue bars denote a histogram of data divided into 1 sec bins. Red curve is a Poisson curve with rate = median count rate of data. |
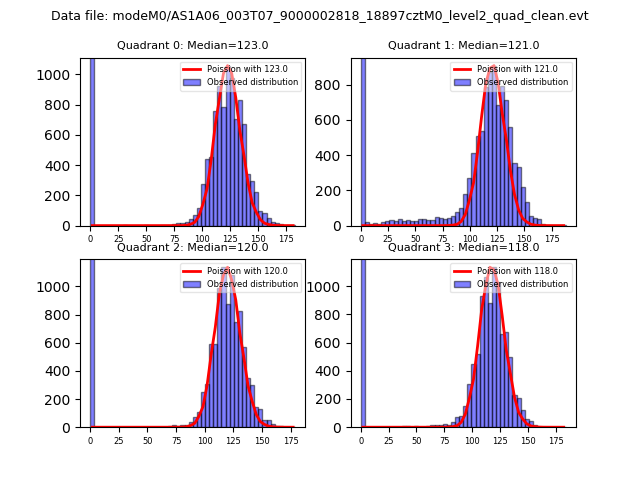 |
 |
| Quadrant-wise count rates Data is divided into 100 sec bins |
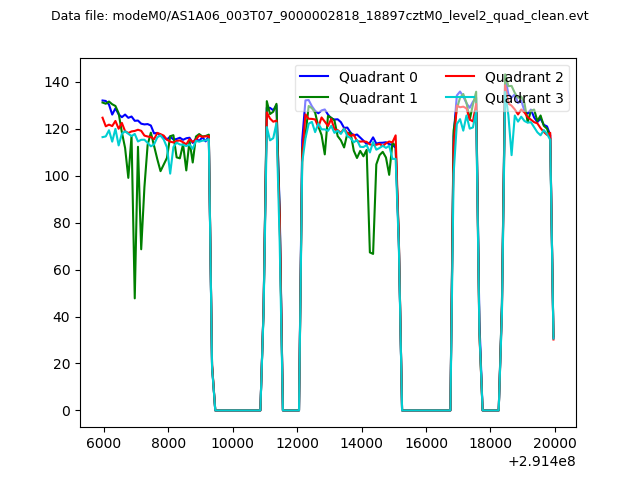 |
|
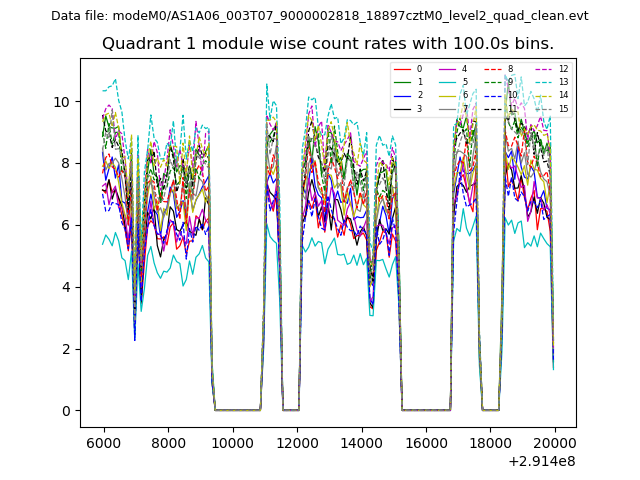
| Module-wise count rates for Quadrant A Data is divided into 100 sec bins |
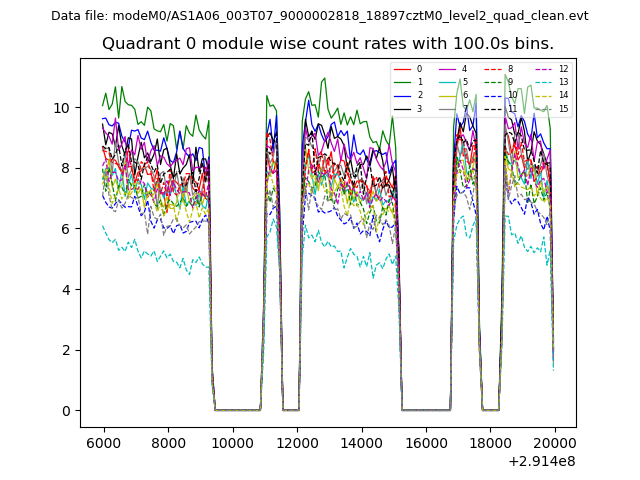 |
 |
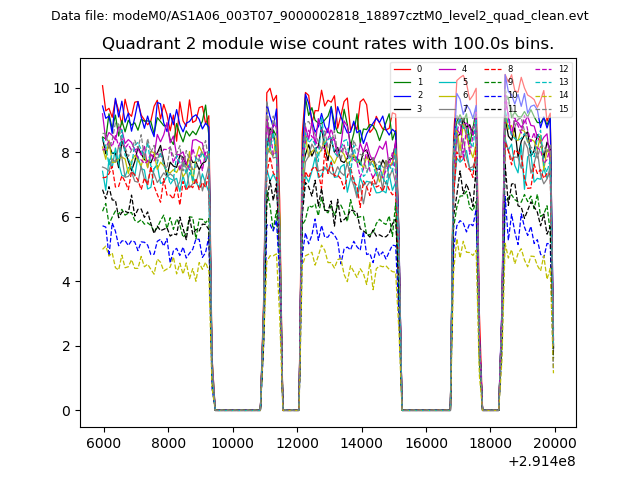
| Module-wise count rates for Quadrant B Data is divided into 100 sec bins |
 |
 |
| Module-wise count rates for Quadrant C Data is divided into 100 sec bins |
 |
 |
| Module-wise count rates for Quadrant D Data is divided into 100 sec bins |
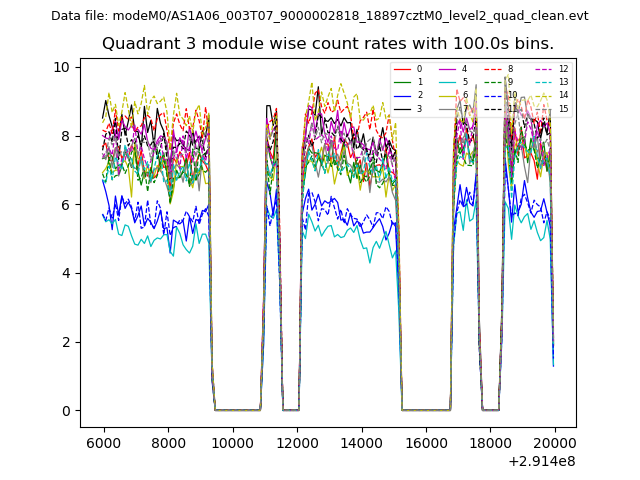 |
 |
| Parameter | Plot |
|---|---|
| CZT HV Monitor | 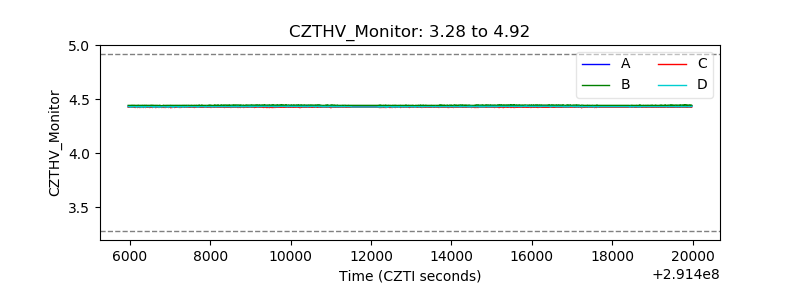 |
| D_VDD | 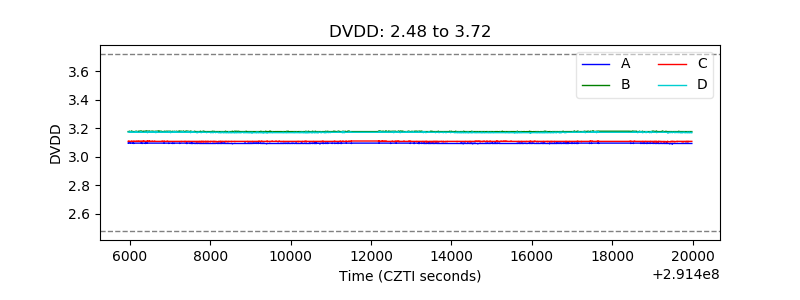 |
| Temperature 1 | 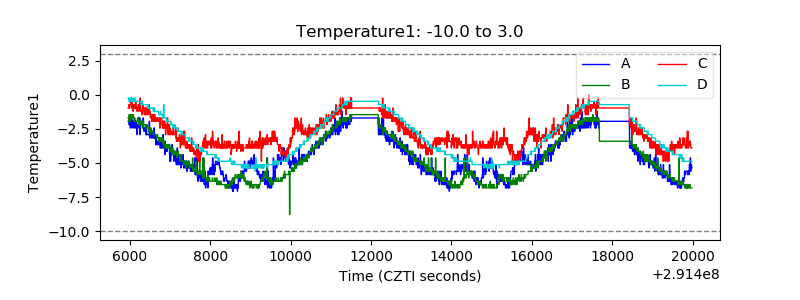 |
| Veto HV Monitor | 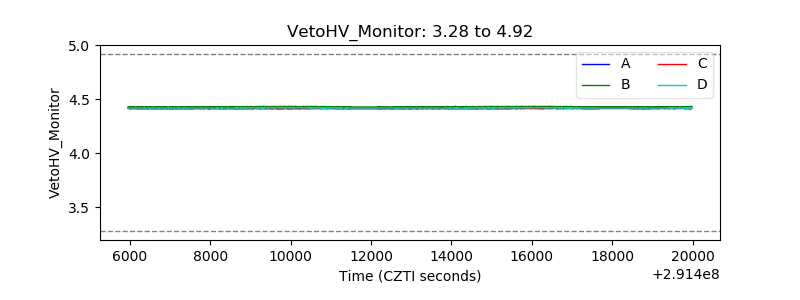 |
| Veto LLD | 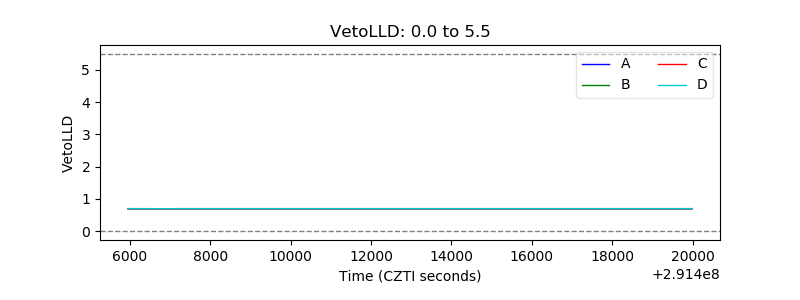 |
| Alpha Counter | 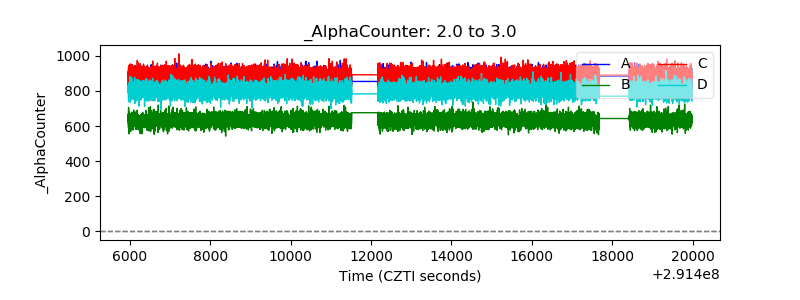 |
| _CPM_Rate | 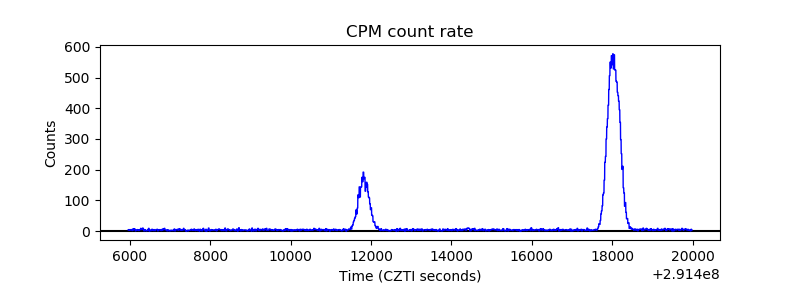 |
| CZT Counter | 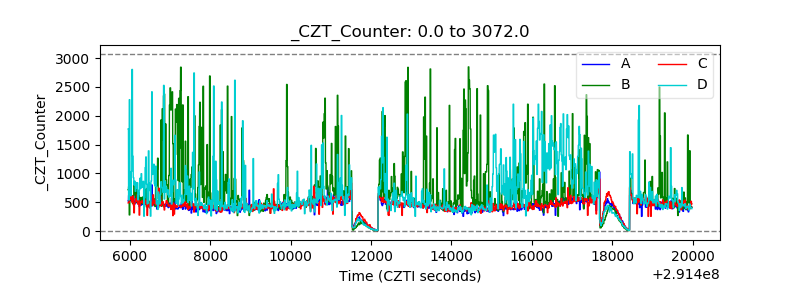 |
| +2.5 Volts monitor |  |
| +5 Volts monitor |  |
| _ROLL_ROT | 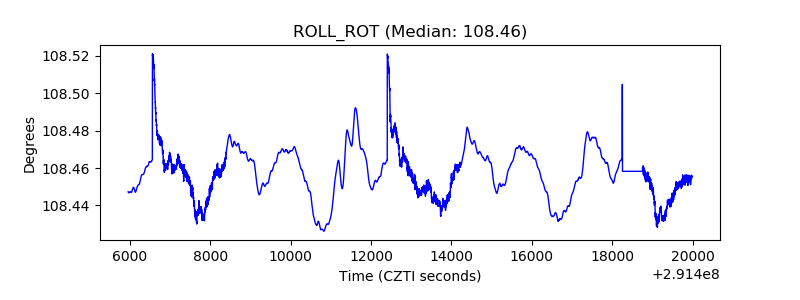 |
| _Roll_DEC | 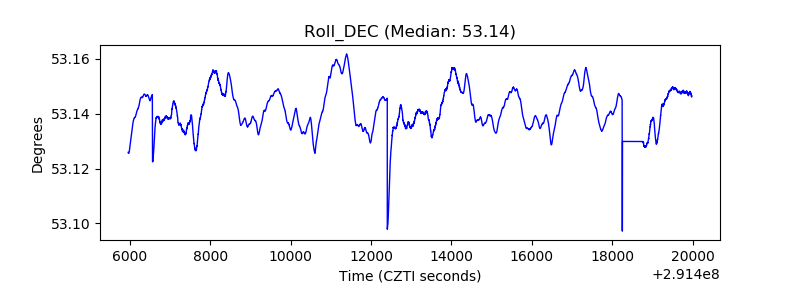 |
| _Roll_RA | 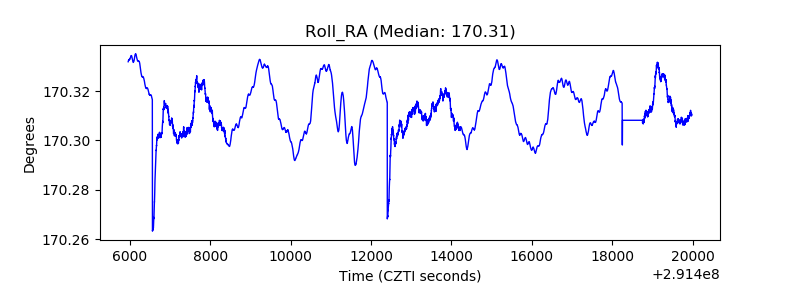 |
| Veto Counter | 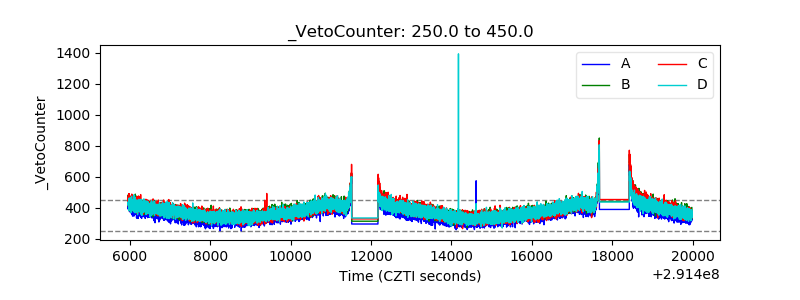 |