| Param | Original file | Final file |
|---|---|---|
| Filename | modeM0/AS1A05_163T01_9000002820_18899cztM0_level2.evt | modeM0/AS1A05_163T01_9000002820_18899cztM0_level2_quad_clean.evt |
| Size (bytes) | 380,767,680 | 65,390,400 |
| Size | 363.1 MB | 62.4 MB |
| Events in quadrant A | 2,380,933 | 415,314 |
| Events in quadrant B | 3,339,762 | 422,612 |
| Events in quadrant C | 2,341,708 | 413,588 |
| Events in quadrant D | 3,135,228 | 384,199 |
| Mode M0 | |||
|---|---|---|---|
| Quadrant | BADHDUFLAG | Total packets | Discarded packets |
| A | 0 | 10309 | 1 |
| B | 0 | 13216 | 1 |
| C | 0 | 10172 | 1 |
| D | 0 | 12738 | 1 |
| Mode SS | |||
|---|---|---|---|
| Quadrant | BADHDUFLAG | Total packets | Discarded packets |
| A | 0 | 100 | 0 |
| B | 0 | 100 | 0 |
| C | 0 | 100 | 0 |
| D | 0 | 100 | 0 |
| Mode M9 | |||
|---|---|---|---|
| Quadrant | BADHDUFLAG | Total packets | Discarded packets |
| A | 0 | 11 | 0 |
| B | 0 | 11 | 0 |
| C | 0 | 11 | 0 |
| D | 0 | 11 | 0 |
| Quadrant | Total seconds | Saturated seconds | Saturation percentage |
|---|---|---|---|
| A | 4904 | 28 | 0.570962% |
| B | 4904 | 255 | 5.199837% |
| C | 4904 | 41 | 0.836052% |
| D | 4904 | 261 | 5.322186% |
Noise dominated data is calculated using 1-second bins in cleaned event files. If a bin has >2000 counts, and if more than 50% of those come from <1% of pixels, then it is considered to be noise-dominated and hence unusable.
| Quadrant | # 1 sec bins | Bins with >0 counts | Bins with >2000 counts | High rate bins dominated by noise | Noise dominated (total time) | Noise dominated (detector-on time) | Marked lightcurve |
|---|---|---|---|---|---|---|---|
| A | 5989 | 4905 | 12 | 12 | 0.20% | 0.24% | 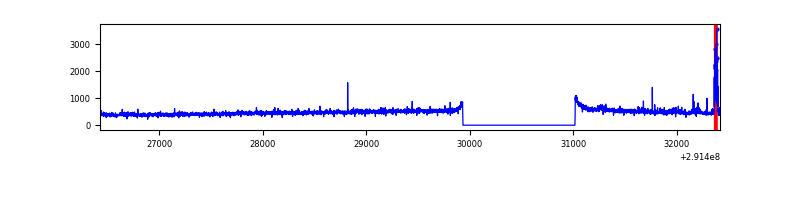 |
| B | 5989 | 4905 | 137 | 137 | 2.29% | 2.79% | 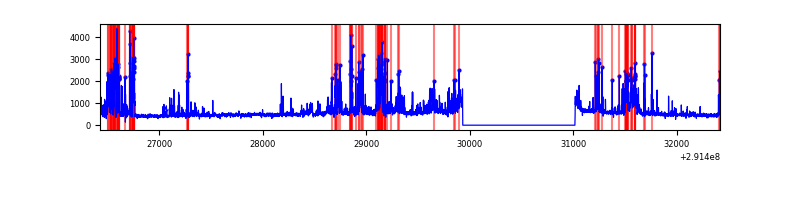 |
| C | 5989 | 4905 | 0 | 0 | 0.00% | 0.00% | 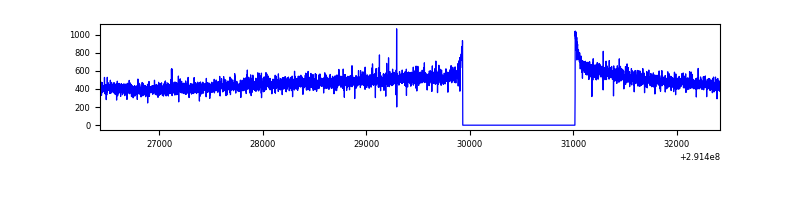 |
| D | 5989 | 4905 | 177 | 177 | 2.96% | 3.61% | 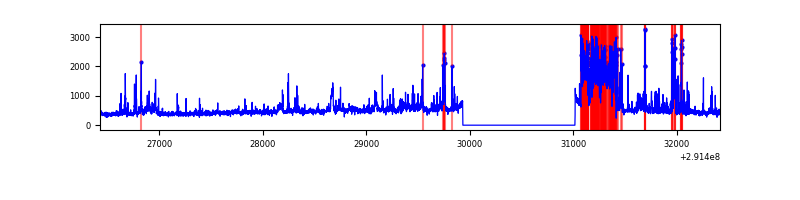 |
Top three noisy pixels from each quadrant. If the there are fewer than three noisy pixels in the level2.evt file, extra rows are filled as -1
| Pixel properties | Quadrant properties | ||||||
|---|---|---|---|---|---|---|---|
| Quadrant | DetID | PixID | Counts | Sigma | Mean | Median | Sigma |
| A | 14 | 235 | 84401 | 696.2 | 594 | 583 | 120.4 |
| A | 13 | 254 | 7078 | 53.95 | 594 | 583 | 120.4 |
| A | 9 | 143 | 6496 | 49.11 | 594 | 583 | 120.4 |
| B | 3 | 112 | 929809 | 8249.59 | 588 | 574 | 112.6 |
| B | 4 | 216 | 43803 | 383.78 | 588 | 574 | 112.6 |
| B | 0 | 189 | 39213 | 343.03 | 588 | 574 | 112.6 |
| C | 14 | 238 | 88275 | 658.96 | 573 | 577 | 133.1 |
| C | 3 | 233 | 20459 | 149.39 | 573 | 577 | 133.1 |
| C | 13 | 61 | 4093 | 26.42 | 573 | 577 | 133.1 |
| D | 1 | 52 | 672294 | 4887.35 | 565 | 549 | 137.4 |
| D | 7 | 238 | 207662 | 1506.87 | 565 | 549 | 137.4 |
| D | 12 | 110 | 52292 | 376.46 | 565 | 549 | 137.4 |
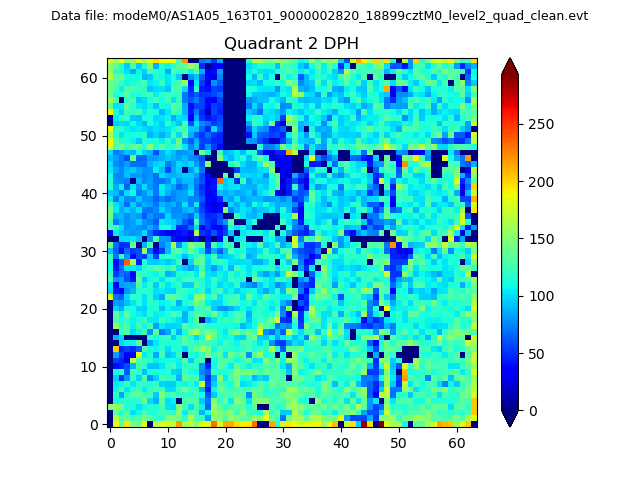
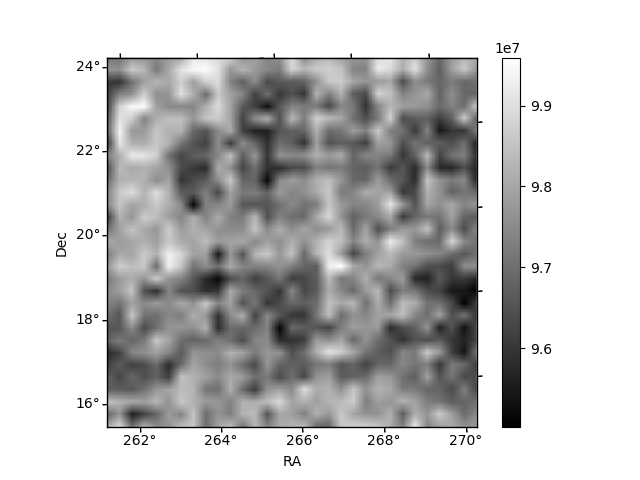
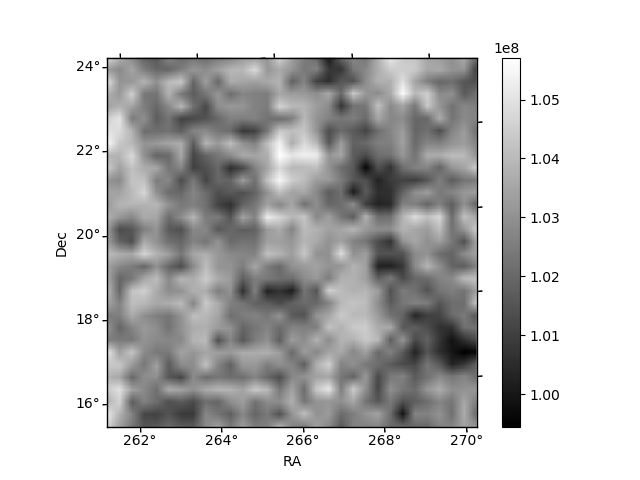
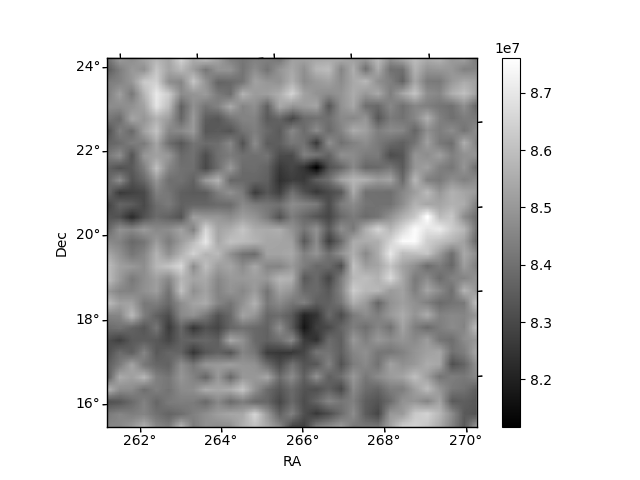
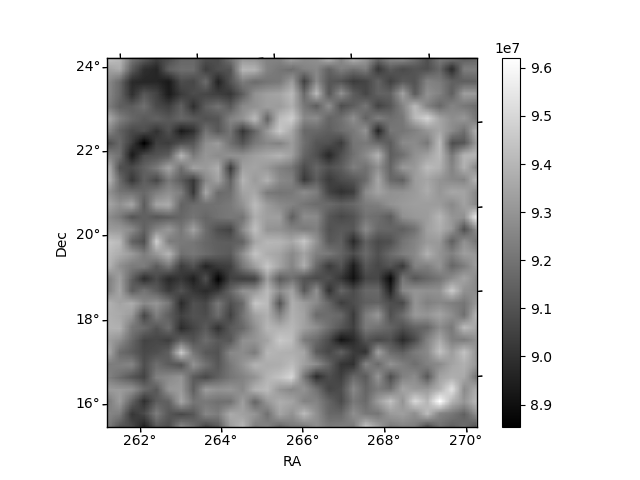
Histogram calculated using DETX and DETY for each event in the final _common_clean file
| Quadrant A | 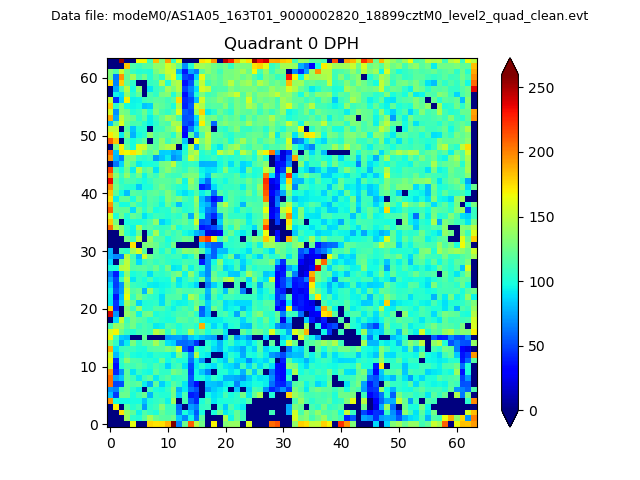 |
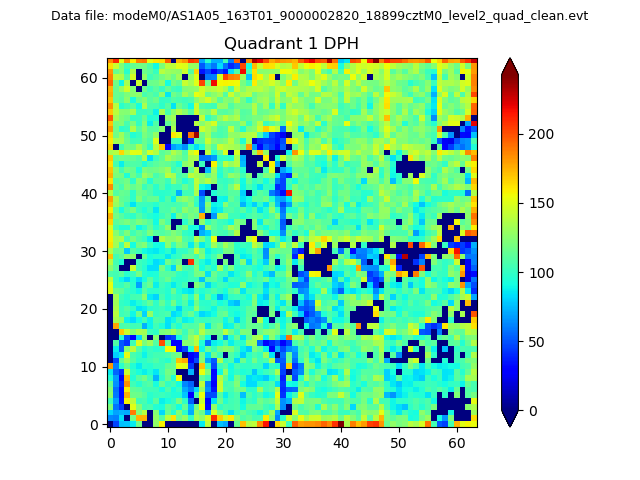 |
Quadrant B |
|---|---|---|---|
| Quadrant D | 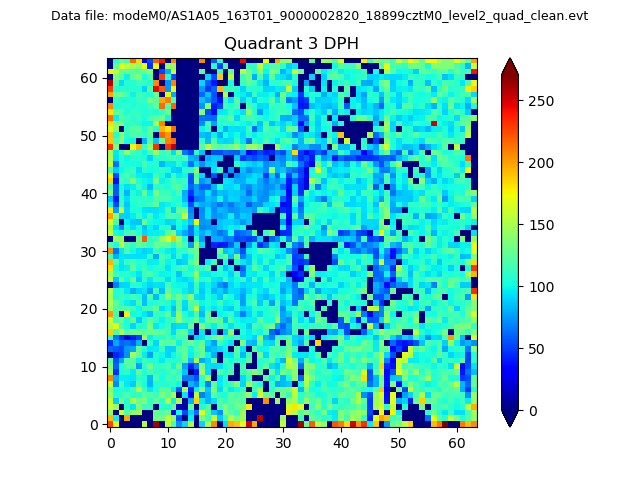 |
 |
Quadrant C |
| Plot type | Count rate plots | Images |
|---|---|---|
| Comparison with Poisson distribution Blue bars denote a histogram of data divided into 1 sec bins. Red curve is a Poisson curve with rate = median count rate of data. |
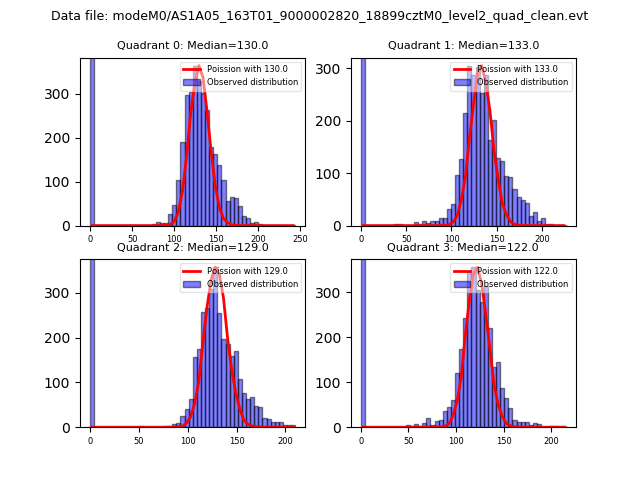 |
 |
| Quadrant-wise count rates Data is divided into 100 sec bins |
 |
|
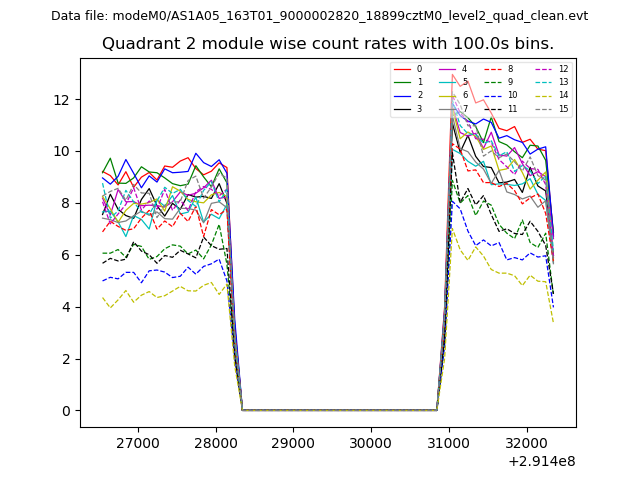
| Module-wise count rates for Quadrant A Data is divided into 100 sec bins |
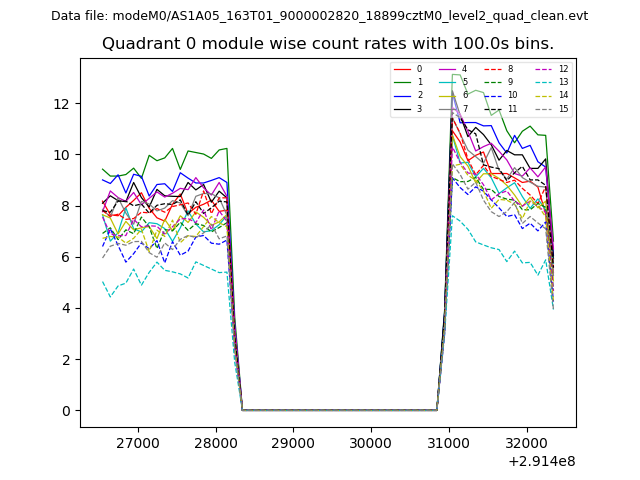 |
 |
| Module-wise count rates for Quadrant B Data is divided into 100 sec bins |
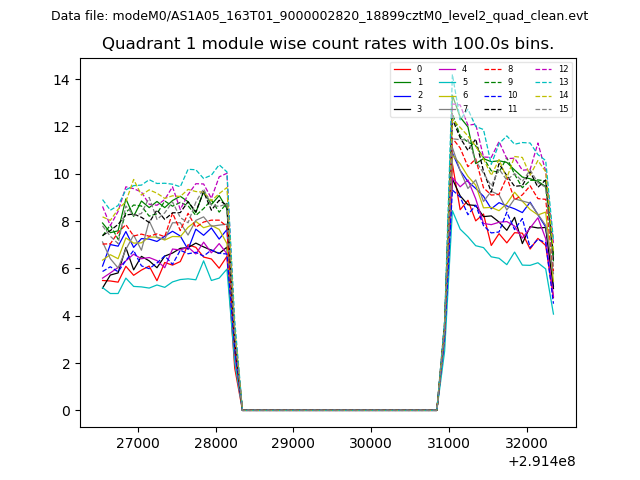 |
 |
| Module-wise count rates for Quadrant C Data is divided into 100 sec bins |
 |
 |
| Module-wise count rates for Quadrant D Data is divided into 100 sec bins |
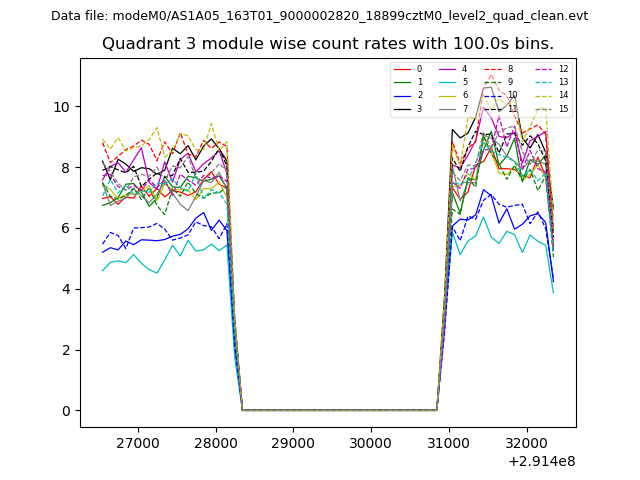 |
 |
| Parameter | Plot |
|---|---|
| CZT HV Monitor | 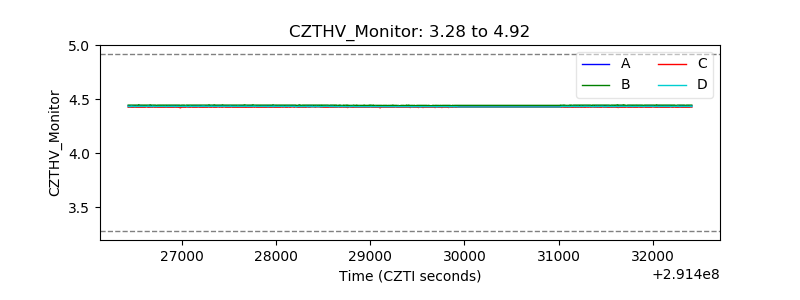 |
| D_VDD | 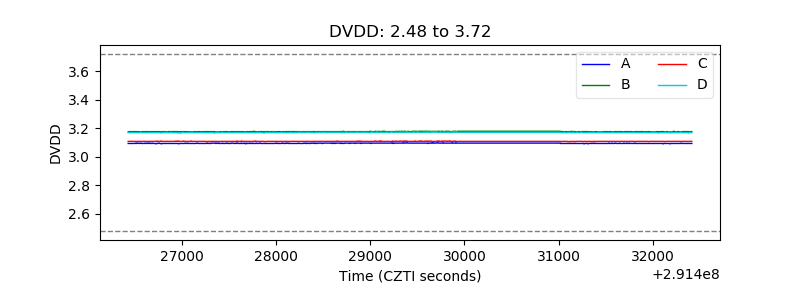 |
| Temperature 1 | 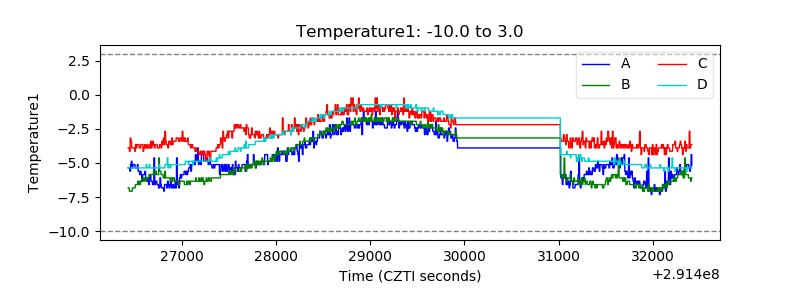 |
| Veto HV Monitor | 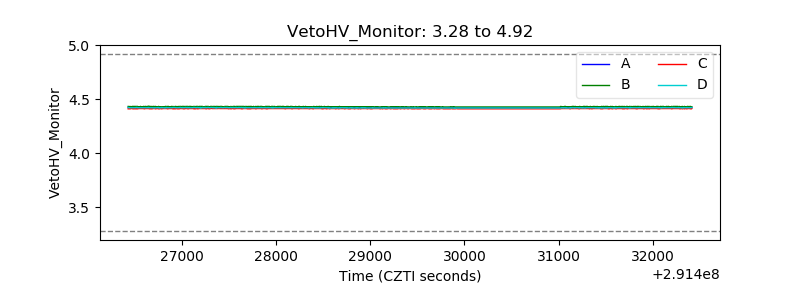 |
| Veto LLD | 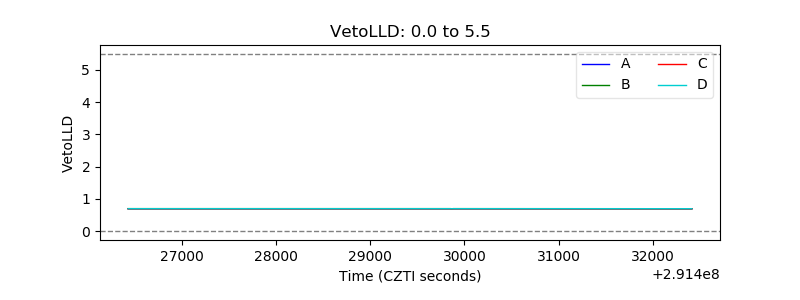 |
| Alpha Counter | 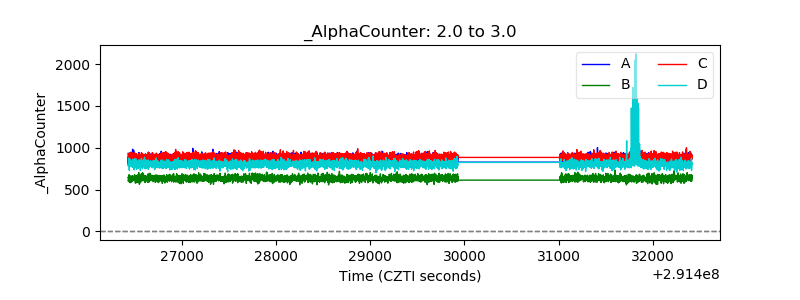 |
| _CPM_Rate | 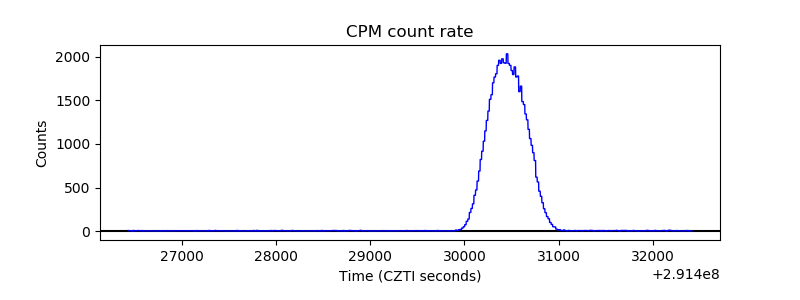 |
| CZT Counter | 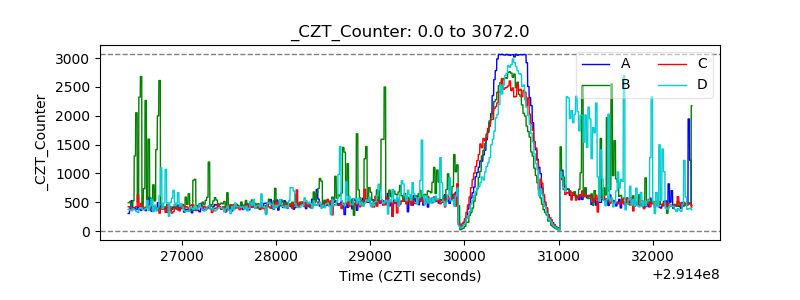 |
| +2.5 Volts monitor |  |
| +5 Volts monitor |  |
| _ROLL_ROT | 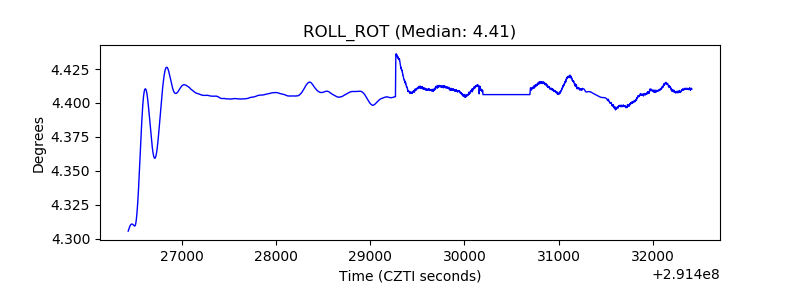 |
| _Roll_DEC | 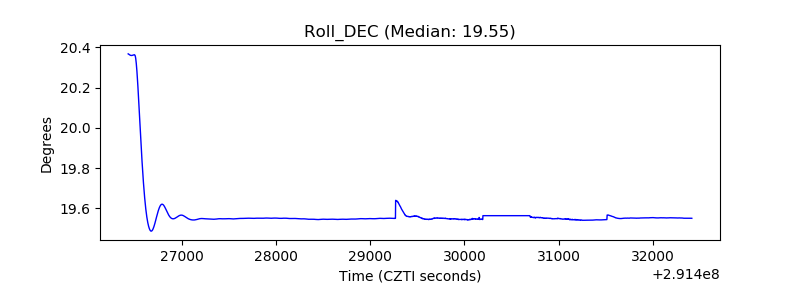 |
| _Roll_RA |  |
| Veto Counter | 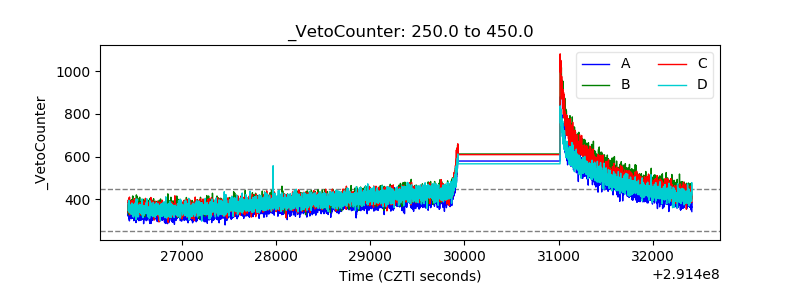 |