| Param | Original file | Final file |
|---|---|---|
| Filename | modeM0/AS1A05_163T01_9000002820_18901cztM0_level2.evt | modeM0/AS1A05_163T01_9000002820_18901cztM0_level2_quad_clean.evt |
| Size (bytes) | 583,335,360 | 98,925,120 |
| Size | 556.3 MB | 94.3 MB |
| Events in quadrant A | 5,677,493 | 552,399 |
| Events in quadrant B | 4,090,464 | 688,622 |
| Events in quadrant C | 3,295,983 | 663,212 |
| Events in quadrant D | 4,148,743 | 624,888 |
| Mode M0 | |||
|---|---|---|---|
| Quadrant | BADHDUFLAG | Total packets | Discarded packets |
| A | 0 | 21297 | 2 |
| B | 0 | 16524 | 2 |
| C | 0 | 14046 | 2 |
| D | 0 | 16877 | 2 |
| Mode SS | |||
|---|---|---|---|
| Quadrant | BADHDUFLAG | Total packets | Discarded packets |
| A | 0 | 136 | 0 |
| B | 0 | 136 | 0 |
| C | 0 | 136 | 0 |
| D | 0 | 136 | 0 |
| Mode M9 | |||
|---|---|---|---|
| Quadrant | BADHDUFLAG | Total packets | Discarded packets |
| A | 0 | 22 | 0 |
| B | 0 | 22 | 0 |
| C | 0 | 22 | 0 |
| D | 0 | 22 | 0 |
| Quadrant | Total seconds | Saturated seconds | Saturation percentage |
|---|---|---|---|
| A | 6686 | 1226 | 18.336823% |
| B | 6686 | 221 | 3.305414% |
| C | 6686 | 59 | 0.882441% |
| D | 6686 | 301 | 4.501944% |
Noise dominated data is calculated using 1-second bins in cleaned event files. If a bin has >2000 counts, and if more than 50% of those come from <1% of pixels, then it is considered to be noise-dominated and hence unusable.
| Quadrant | # 1 sec bins | Bins with >0 counts | Bins with >2000 counts | High rate bins dominated by noise | Noise dominated (total time) | Noise dominated (detector-on time) | Marked lightcurve |
|---|---|---|---|---|---|---|---|
| A | 7896 | 6687 | 761 | 761 | 9.64% | 11.38% | 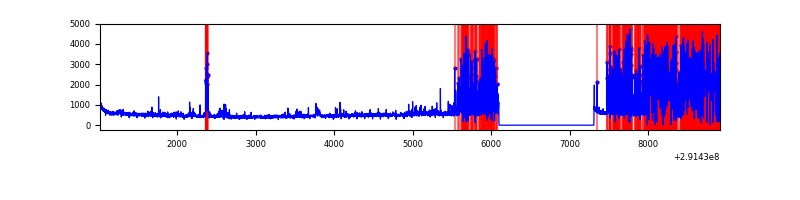 |
| B | 7896 | 6687 | 99 | 99 | 1.25% | 1.48% | 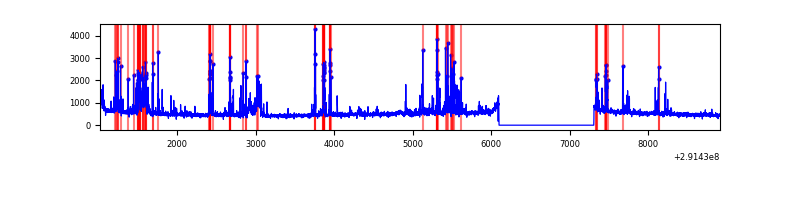 |
| C | 7896 | 6687 | 0 | 0 | 0.00% | 0.00% | 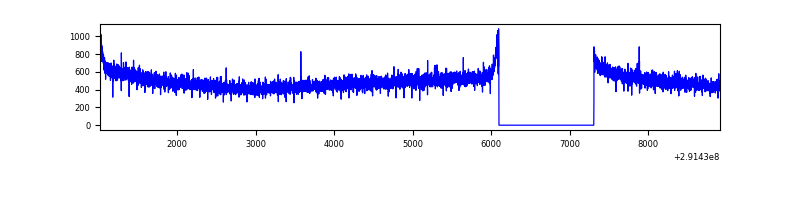 |
| D | 7896 | 6687 | 195 | 195 | 2.47% | 2.92% | 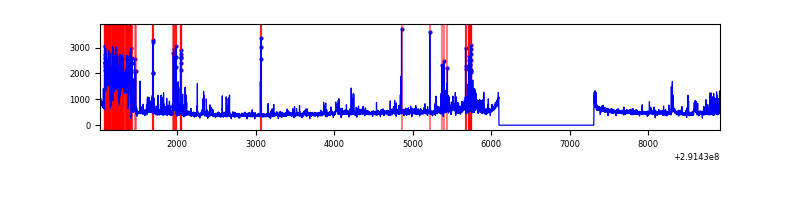 |
Top three noisy pixels from each quadrant. If the there are fewer than three noisy pixels in the level2.evt file, extra rows are filled as -1
| Pixel properties | Quadrant properties | ||||||
|---|---|---|---|---|---|---|---|
| Quadrant | DetID | PixID | Counts | Sigma | Mean | Median | Sigma |
| A | 14 | 235 | 2820168 | 19046.74 | 735 | 722 | 148.0 |
| A | 15 | 174 | 19711 | 128.28 | 735 | 722 | 148.0 |
| A | 13 | 254 | 8232 | 50.73 | 735 | 722 | 148.0 |
| B | 3 | 112 | 701188 | 4414.83 | 839 | 820 | 158.6 |
| B | 0 | 189 | 45380 | 280.89 | 839 | 820 | 158.6 |
| B | 7 | 220 | 20434 | 123.64 | 839 | 820 | 158.6 |
| C | 14 | 238 | 127225 | 676.95 | 806 | 815 | 186.7 |
| C | 3 | 233 | 25467 | 132.02 | 806 | 815 | 186.7 |
| C | 13 | 61 | 5784 | 26.61 | 806 | 815 | 186.7 |
| D | 1 | 52 | 742282 | 3847.14 | 796 | 775 | 192.7 |
| D | 7 | 238 | 330690 | 1711.69 | 796 | 775 | 192.7 |
| D | 12 | 110 | 30772 | 155.63 | 796 | 775 | 192.7 |
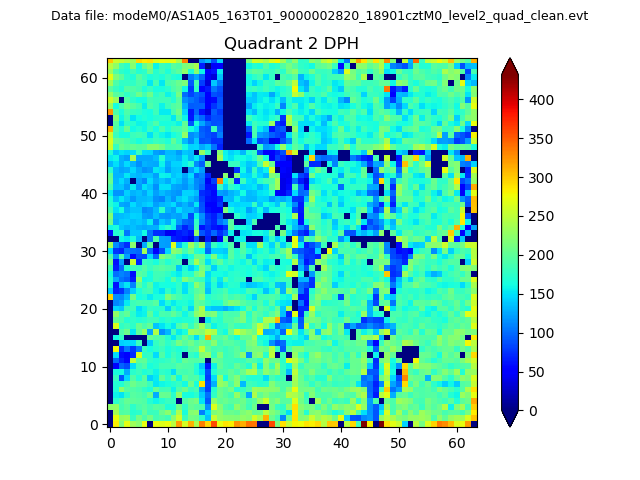
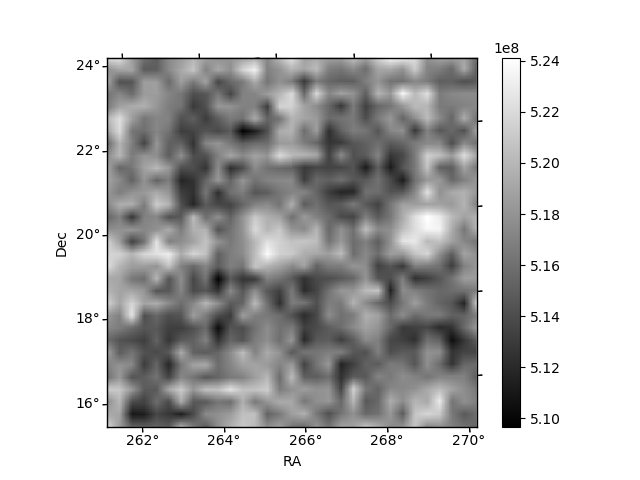
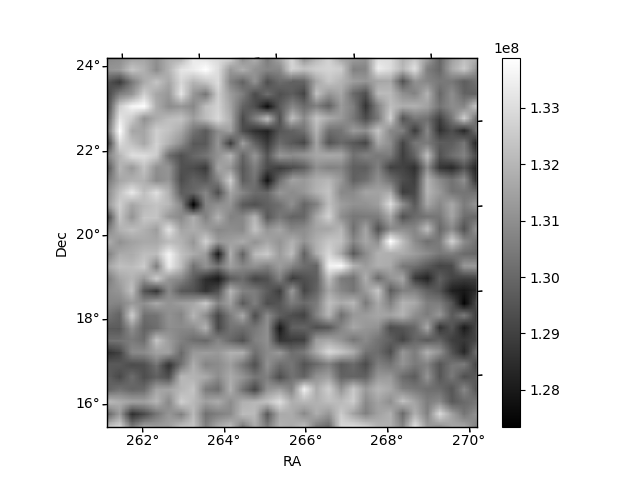
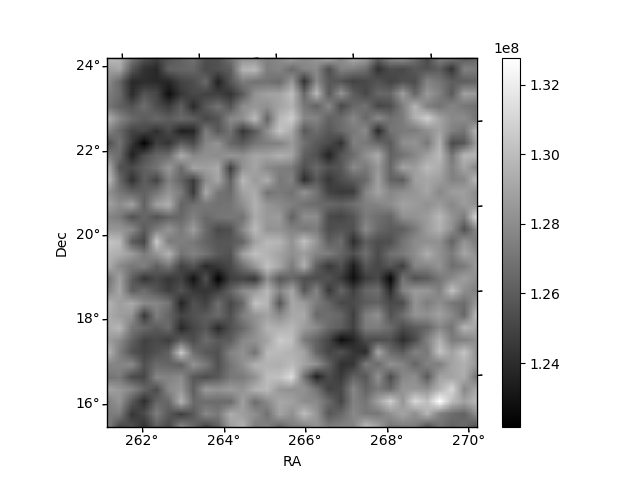
Histogram calculated using DETX and DETY for each event in the final _common_clean file
| Quadrant A | 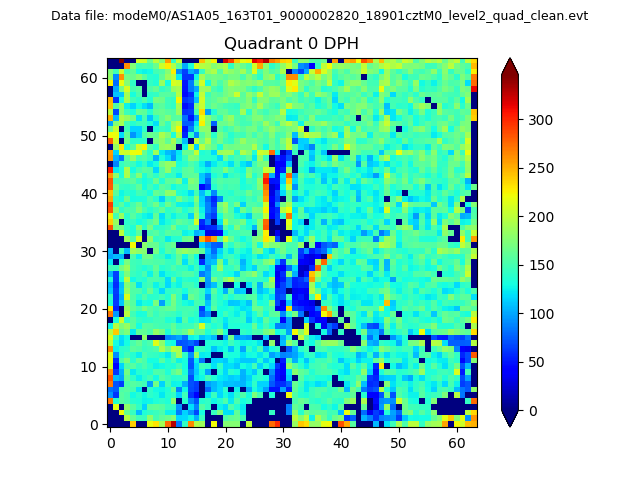 |
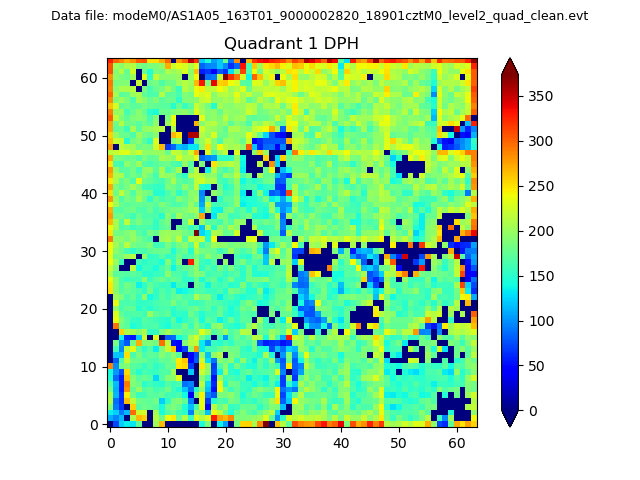 |
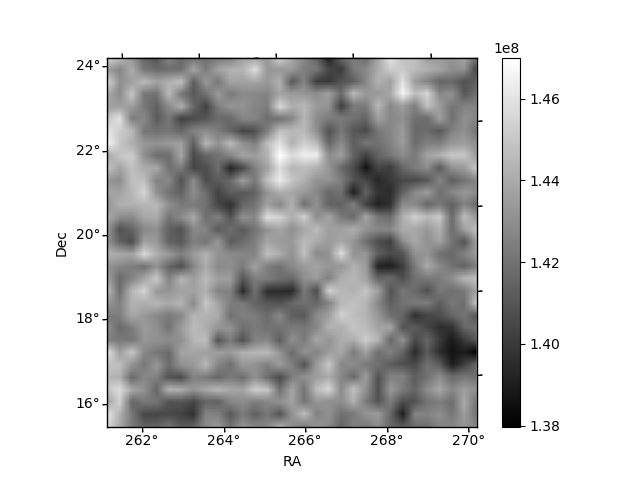
Quadrant B |
|---|---|---|---|
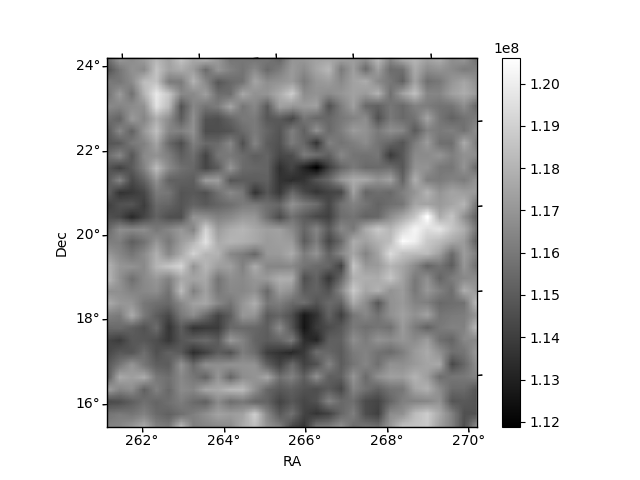
| Quadrant D | 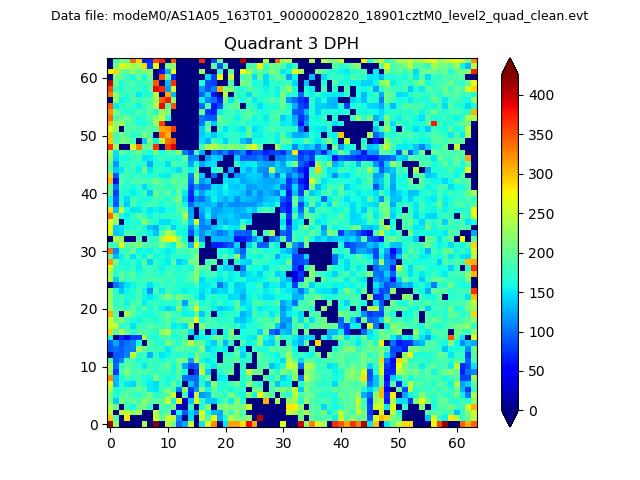 |
 |
Quadrant C |
| Plot type | Count rate plots | Images |
|---|---|---|
| Comparison with Poisson distribution Blue bars denote a histogram of data divided into 1 sec bins. Red curve is a Poisson curve with rate = median count rate of data. |
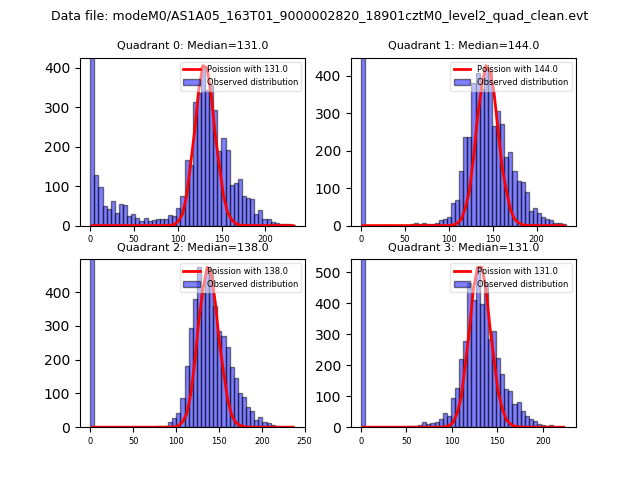 |
 |
| Quadrant-wise count rates Data is divided into 100 sec bins |
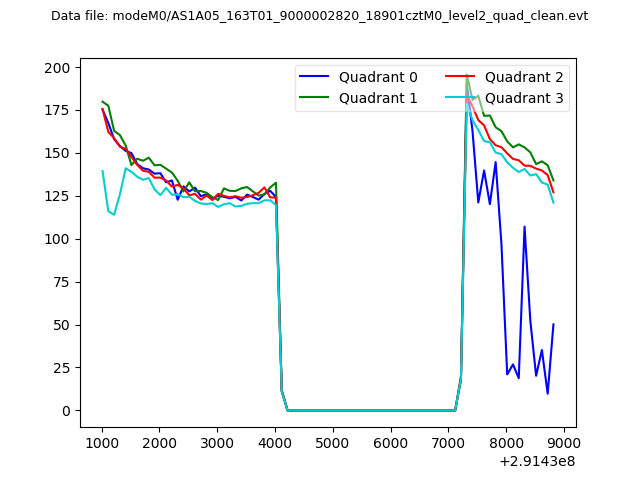 |
|
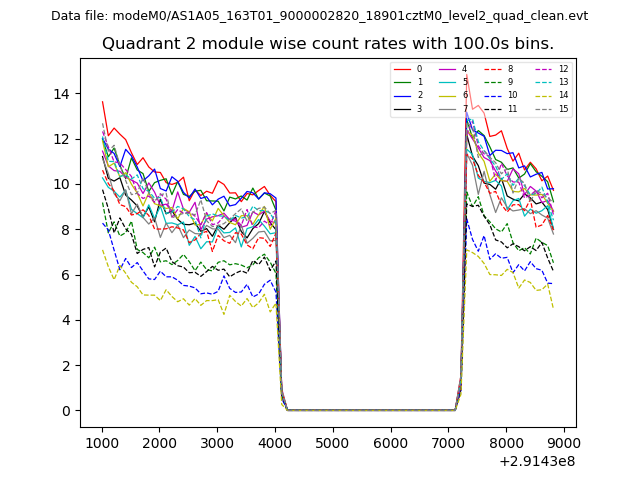
| Module-wise count rates for Quadrant A Data is divided into 100 sec bins |
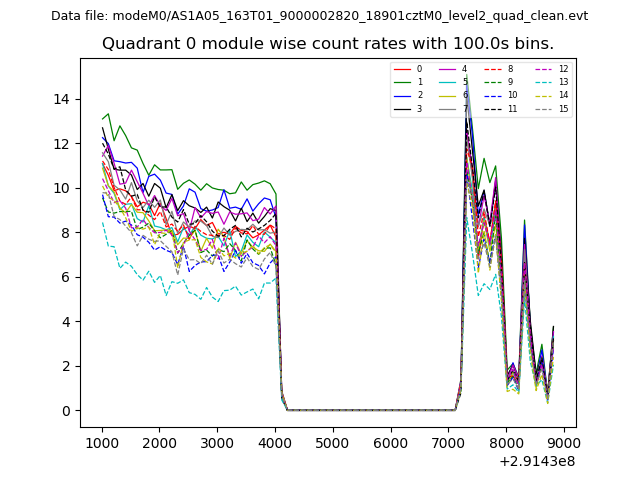 |
 |
| Module-wise count rates for Quadrant B Data is divided into 100 sec bins |
 |
 |
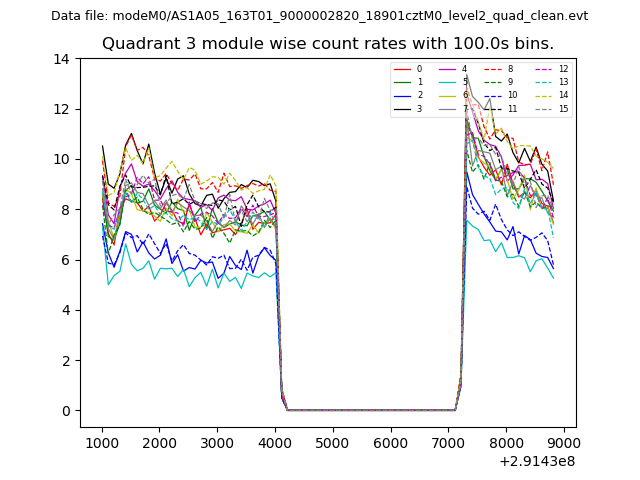
| Module-wise count rates for Quadrant C Data is divided into 100 sec bins |
 |
 |
| Module-wise count rates for Quadrant D Data is divided into 100 sec bins |
 |
 |
| Parameter | Plot |
|---|---|
| CZT HV Monitor | 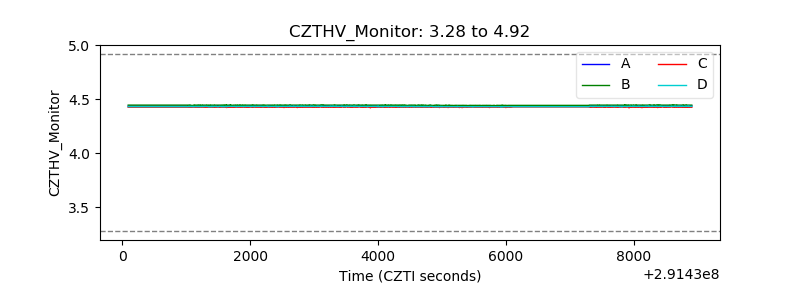 |
| D_VDD | 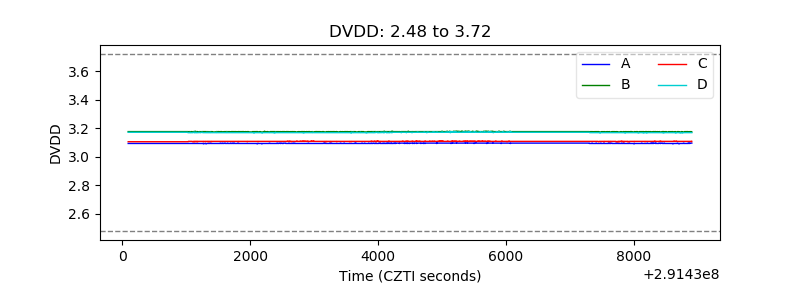 |
| Temperature 1 | 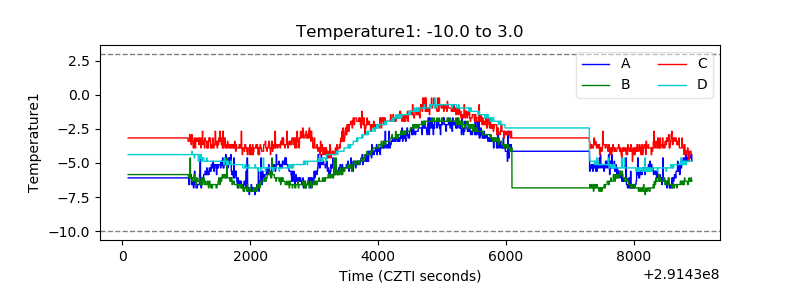 |
| Veto HV Monitor | 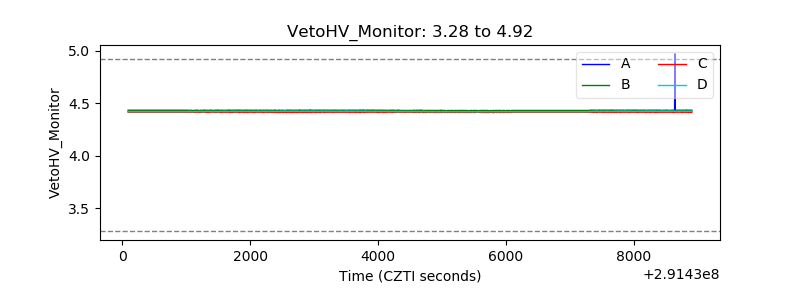 |
| Veto LLD |  |
| Alpha Counter | 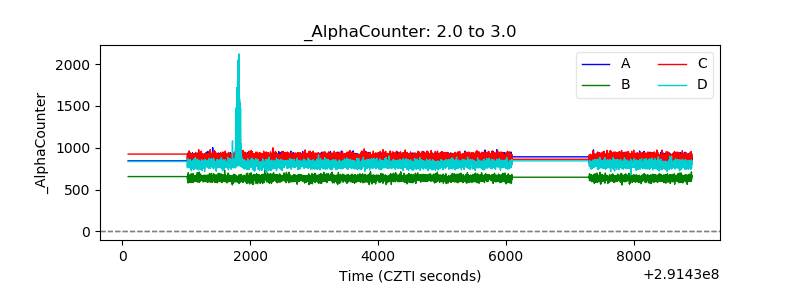 |
| _CPM_Rate | 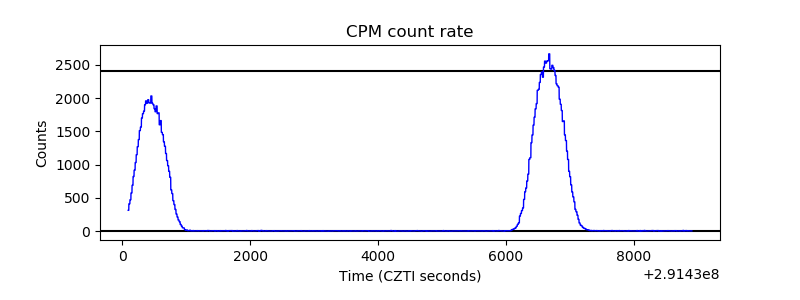 |
| CZT Counter | 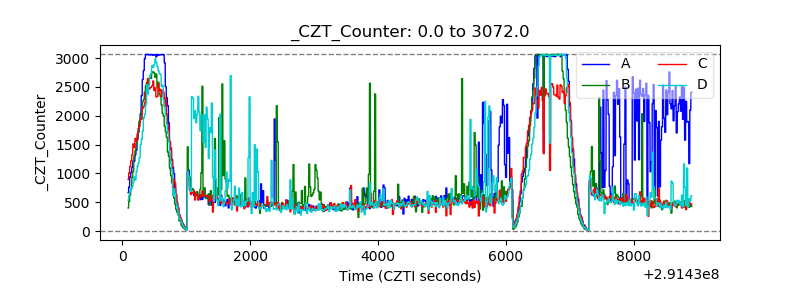 |
| +2.5 Volts monitor | 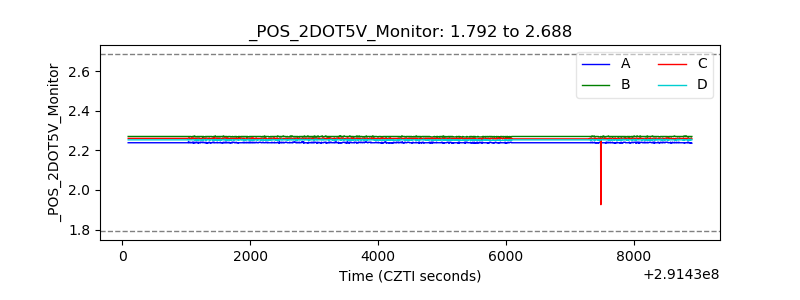 |
| +5 Volts monitor |  |
| _ROLL_ROT | 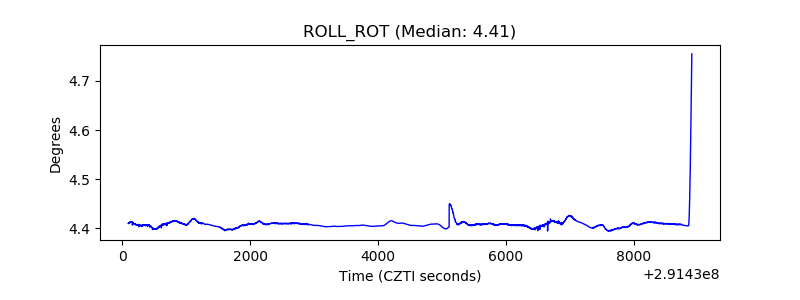 |
| _Roll_DEC | 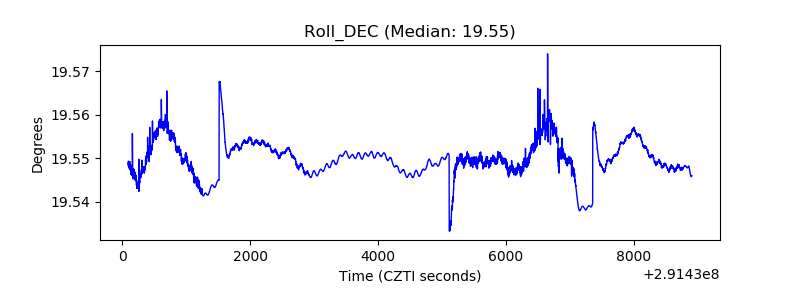 |
| _Roll_RA | 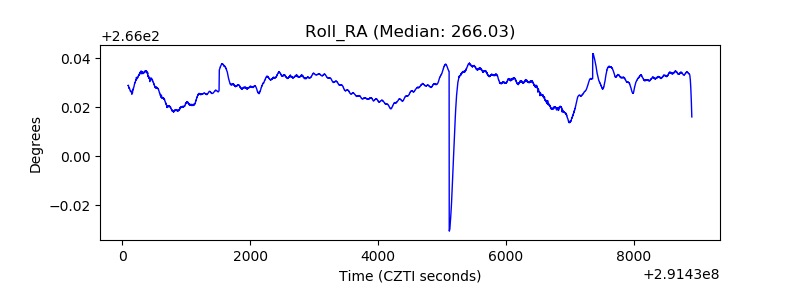 |
| Veto Counter | 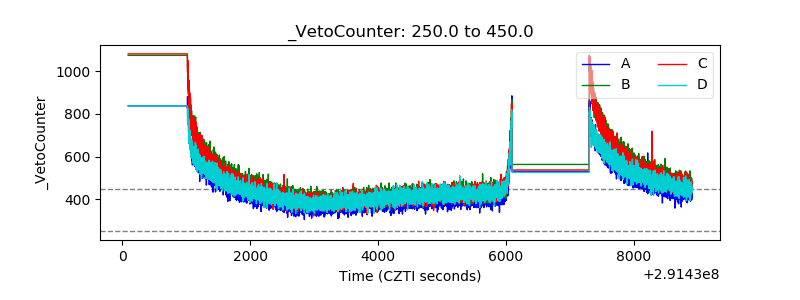 |