| Param | Original file | Final file |
|---|---|---|
| Filename | modeM0/AS1A05_163T01_9000002820_18903cztM0_level2.evt | modeM0/AS1A05_163T01_9000002820_18903cztM0_level2_quad_clean.evt |
| Size (bytes) | 621,345,600 | 98,507,520 |
| Size | 592.6 MB | 93.9 MB |
| Events in quadrant A | 6,152,968 | 579,946 |
| Events in quadrant B | 5,301,763 | 664,331 |
| Events in quadrant C | 3,628,675 | 650,859 |
| Events in quadrant D | 3,297,858 | 638,049 |
| Mode M0 | |||
|---|---|---|---|
| Quadrant | BADHDUFLAG | Total packets | Discarded packets |
| A | 0 | 22491 | 2 |
| B | 0 | 19980 | 2 |
| C | 0 | 14649 | 2 |
| D | 0 | 13780 | 2 |
| Mode SS | |||
|---|---|---|---|
| Quadrant | BADHDUFLAG | Total packets | Discarded packets |
| A | 0 | 132 | 0 |
| B | 0 | 132 | 0 |
| C | 0 | 132 | 0 |
| D | 0 | 132 | 0 |
| Mode M9 | |||
|---|---|---|---|
| Quadrant | BADHDUFLAG | Total packets | Discarded packets |
| A | 0 | 15 | 0 |
| B | 0 | 16 | 0 |
| C | 0 | 16 | 0 |
| D | 0 | 16 | 0 |
| Quadrant | Total seconds | Saturated seconds | Saturation percentage |
|---|---|---|---|
| A | 6440 | 1073 | 16.661491% |
| B | 6440 | 646 | 10.031056% |
| C | 6440 | 106 | 1.645963% |
| D | 6440 | 25 | 0.388199% |
Noise dominated data is calculated using 1-second bins in cleaned event files. If a bin has >2000 counts, and if more than 50% of those come from <1% of pixels, then it is considered to be noise-dominated and hence unusable.
| Quadrant | # 1 sec bins | Bins with >0 counts | Bins with >2000 counts | High rate bins dominated by noise | Noise dominated (total time) | Noise dominated (detector-on time) | Marked lightcurve |
|---|---|---|---|---|---|---|---|
| A | 7780 | 6441 | 618 | 618 | 7.94% | 9.59% |  |
| B | 7780 | 6441 | 392 | 392 | 5.04% | 6.09% |  |
| C | 7780 | 6441 | 5 | 5 | 0.06% | 0.08% |  |
| D | 7780 | 6441 | 6 | 6 | 0.08% | 0.09% |  |
Top three noisy pixels from each quadrant. If the there are fewer than three noisy pixels in the level2.evt file, extra rows are filled as -1
| Pixel properties | Quadrant properties | ||||||
|---|---|---|---|---|---|---|---|
| Quadrant | DetID | PixID | Counts | Sigma | Mean | Median | Sigma |
| A | 14 | 235 | 3096874 | 19803.63 | 792 | 780 | 156.3 |
| A | 13 | 254 | 9783 | 57.59 | 792 | 780 | 156.3 |
| A | 0 | 226 | 7130 | 40.62 | 792 | 780 | 156.3 |
| B | 3 | 112 | 1850961 | 11908.32 | 826 | 809 | 155.4 |
| B | 0 | 245 | 86532 | 551.75 | 826 | 809 | 155.4 |
| B | 0 | 189 | 54943 | 348.43 | 826 | 809 | 155.4 |
| C | 3 | 233 | 229769 | 1216.27 | 817 | 824 | 188.2 |
| C | 14 | 238 | 130602 | 689.44 | 817 | 824 | 188.2 |
| C | 0 | 207 | 80040 | 420.83 | 817 | 824 | 188.2 |
| D | 9 | 1 | 93665 | 463.47 | 829 | 806 | 200.4 |
| D | 1 | 52 | 26896 | 130.22 | 829 | 806 | 200.4 |
| D | 2 | 234 | 26724 | 129.36 | 829 | 806 | 200.4 |
Histogram calculated using DETX and DETY for each event in the final _common_clean file
| Quadrant A |  |
 |
Quadrant B |
|---|---|---|---|
| Quadrant D |  |
 |
Quadrant C |
| Plot type | Count rate plots | Images |
|---|---|---|
| Comparison with Poisson distribution Blue bars denote a histogram of data divided into 1 sec bins. Red curve is a Poisson curve with rate = median count rate of data. |
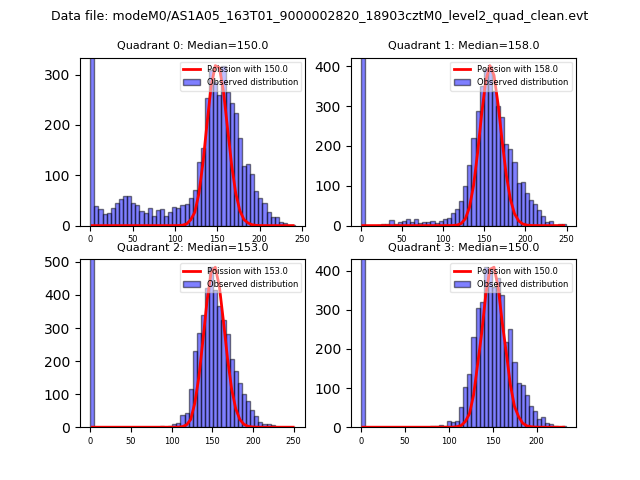 |
 |
| Quadrant-wise count rates Data is divided into 100 sec bins |
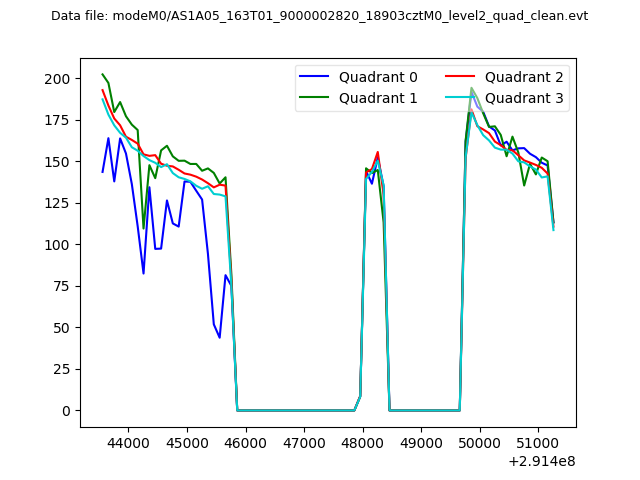 |
|
| Module-wise count rates for Quadrant A Data is divided into 100 sec bins |
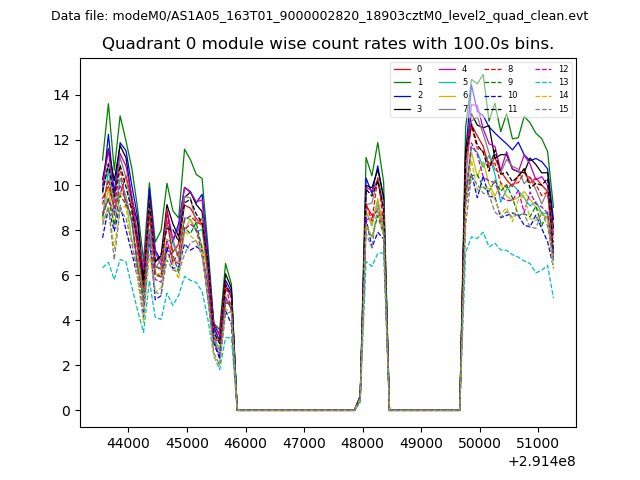 |
 |
| Module-wise count rates for Quadrant B Data is divided into 100 sec bins |
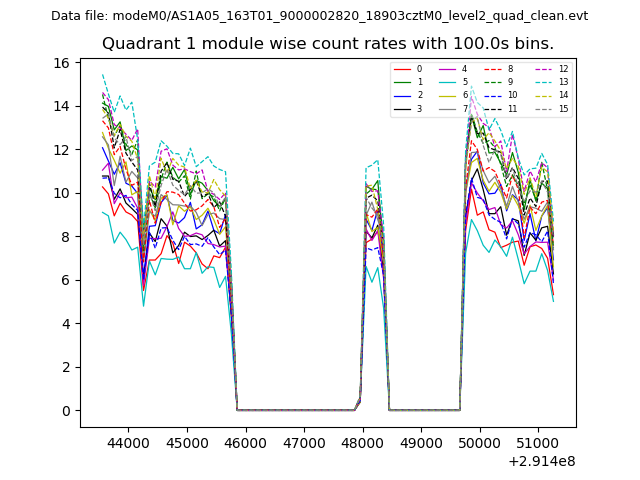 |
 |
| Module-wise count rates for Quadrant C Data is divided into 100 sec bins |
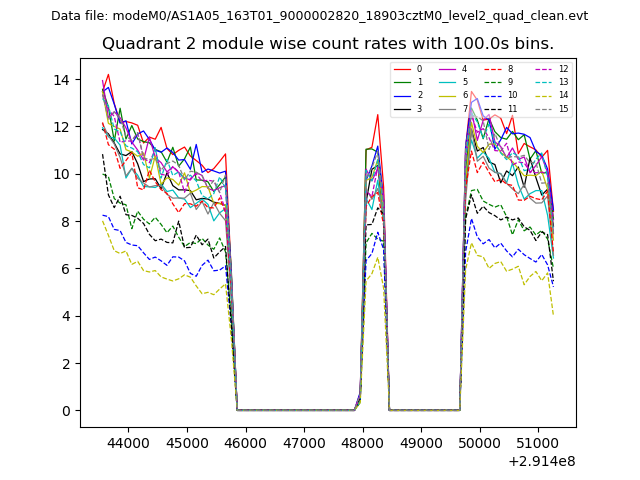 |
 |
| Module-wise count rates for Quadrant D Data is divided into 100 sec bins |
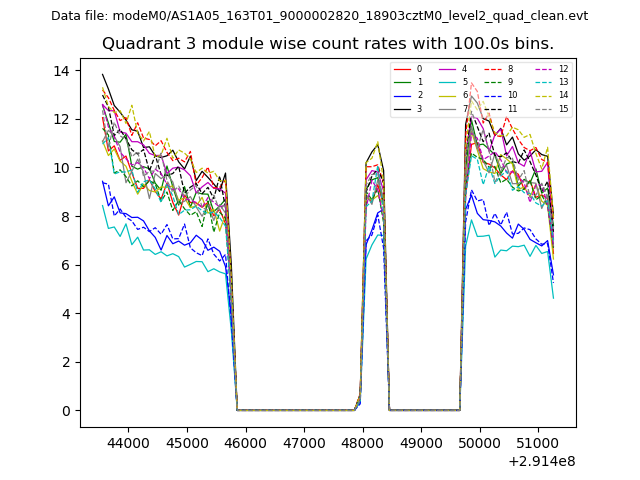 |
 |
| Parameter | Plot |
|---|---|
| CZT HV Monitor | 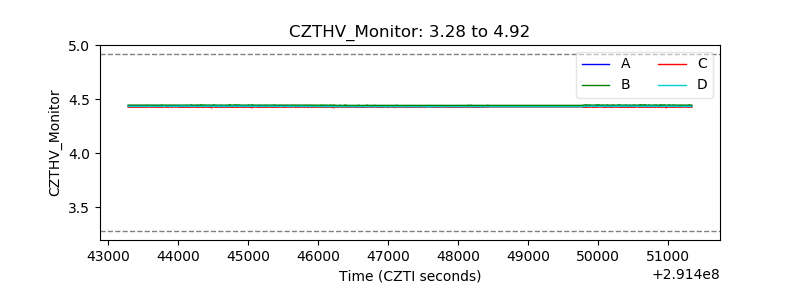 |
| D_VDD |  |
| Temperature 1 |  |
| Veto HV Monitor |  |
| Veto LLD |  |
| Alpha Counter | 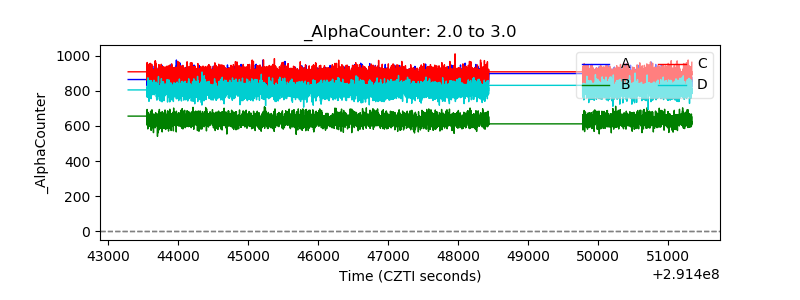 |
| _CPM_Rate | 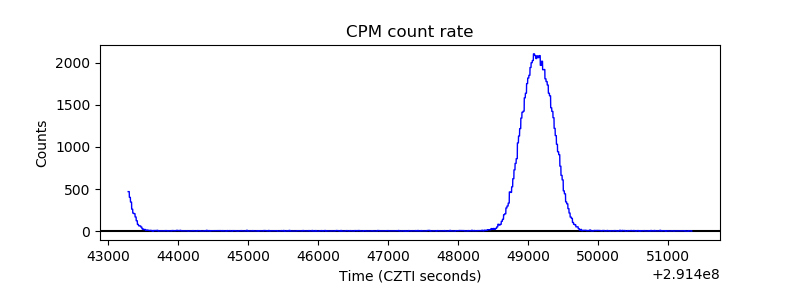 |
| CZT Counter |  |
| +2.5 Volts monitor |  |
| +5 Volts monitor |  |
| _ROLL_ROT | 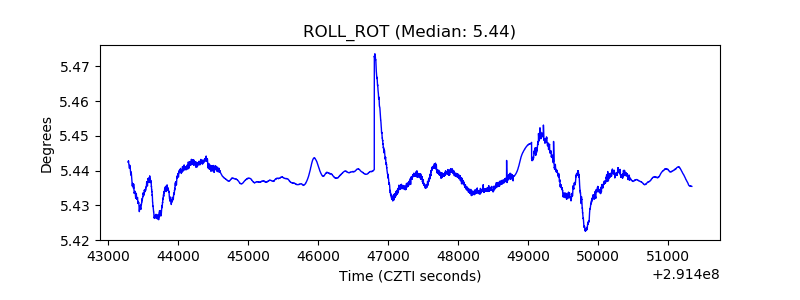 |
| _Roll_DEC | 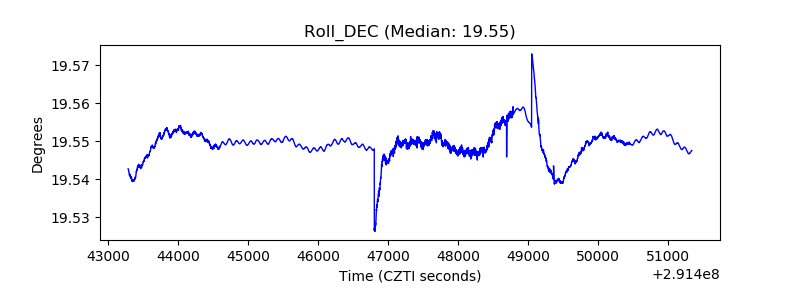 |
| _Roll_RA |  |
| Veto Counter | 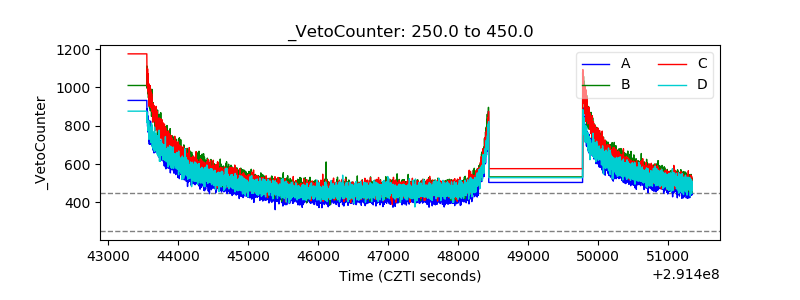 |