| Param | Original file | Final file |
|---|---|---|
| Filename | modeM0/AS1A05_163T01_9000002820_18904cztM0_level2.evt | modeM0/AS1A05_163T01_9000002820_18904cztM0_level2_quad_clean.evt |
| Size (bytes) | 574,824,960 | 93,689,280 |
| Size | 548.2 MB | 89.3 MB |
| Events in quadrant A | 4,089,393 | 613,043 |
| Events in quadrant B | 6,137,155 | 613,153 |
| Events in quadrant C | 3,257,549 | 595,173 |
| Events in quadrant D | 3,505,120 | 583,860 |
| Mode M0 | |||
|---|---|---|---|
| Quadrant | BADHDUFLAG | Total packets | Discarded packets |
| A | 0 | 15681 | 1 |
| B | 0 | 22230 | 1 |
| C | 0 | 13177 | 1 |
| D | 0 | 14283 | 1 |
| Mode SS | |||
|---|---|---|---|
| Quadrant | BADHDUFLAG | Total packets | Discarded packets |
| A | 0 | 126 | 0 |
| B | 0 | 126 | 0 |
| C | 0 | 126 | 0 |
| D | 0 | 126 | 0 |
| Mode M9 | |||
|---|---|---|---|
| Quadrant | BADHDUFLAG | Total packets | Discarded packets |
| A | 0 | 13 | 0 |
| B | 0 | 13 | 0 |
| C | 0 | 13 | 0 |
| D | 0 | 13 | 0 |
| Quadrant | Total seconds | Saturated seconds | Saturation percentage |
|---|---|---|---|
| A | 6188 | 356 | 5.753070% |
| B | 6188 | 1124 | 18.164189% |
| C | 6189 | 100 | 1.615770% |
| D | 6189 | 84 | 1.357247% |
Noise dominated data is calculated using 1-second bins in cleaned event files. If a bin has >2000 counts, and if more than 50% of those come from <1% of pixels, then it is considered to be noise-dominated and hence unusable.
| Quadrant | # 1 sec bins | Bins with >0 counts | Bins with >2000 counts | High rate bins dominated by noise | Noise dominated (total time) | Noise dominated (detector-on time) | Marked lightcurve |
|---|---|---|---|---|---|---|---|
| A | 7498 | 6189 | 224 | 224 | 2.99% | 3.62% |  |
| B | 7498 | 6188 | 718 | 718 | 9.58% | 11.60% |  |
| C | 7499 | 6190 | 2 | 2 | 0.03% | 0.03% |  |
| D | 7499 | 6190 | 18 | 18 | 0.24% | 0.29% |  |
Top three noisy pixels from each quadrant. If the there are fewer than three noisy pixels in the level2.evt file, extra rows are filled as -1
| Pixel properties | Quadrant properties | ||||||
|---|---|---|---|---|---|---|---|
| Quadrant | DetID | PixID | Counts | Sigma | Mean | Median | Sigma |
| A | 14 | 235 | 946588 | 5801.68 | 812 | 797 | 163.0 |
| A | 11 | 29 | 10095 | 57.04 | 812 | 797 | 163.0 |
| A | 13 | 254 | 9585 | 53.91 | 812 | 797 | 163.0 |
| B | 3 | 112 | 3053275 | 21327.38 | 755 | 739 | 143.1 |
| B | 7 | 220 | 72809 | 503.54 | 755 | 739 | 143.1 |
| B | 0 | 189 | 17778 | 119.05 | 755 | 739 | 143.1 |
| C | 14 | 238 | 125537 | 689.37 | 783 | 791 | 181.0 |
| C | 3 | 233 | 48170 | 261.82 | 783 | 791 | 181.0 |
| C | 5 | 112 | 31722 | 170.93 | 783 | 791 | 181.0 |
| D | 9 | 1 | 209209 | 1071.42 | 800 | 779 | 194.5 |
| D | 1 | 52 | 176696 | 904.29 | 800 | 779 | 194.5 |
| D | 7 | 238 | 70339 | 357.57 | 800 | 779 | 194.5 |
Histogram calculated using DETX and DETY for each event in the final _common_clean file
| Quadrant A |  |
 |
Quadrant B |
|---|---|---|---|
| Quadrant D |  |
 |
Quadrant C |
| Plot type | Count rate plots | Images |
|---|---|---|
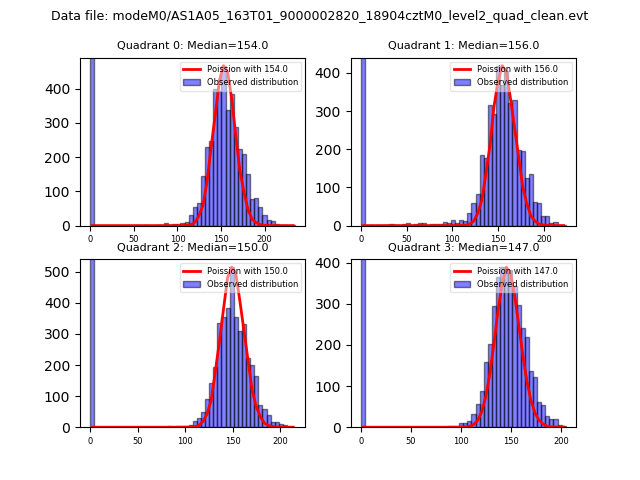
| Comparison with Poisson distribution Blue bars denote a histogram of data divided into 1 sec bins. Red curve is a Poisson curve with rate = median count rate of data. |
 |
 |
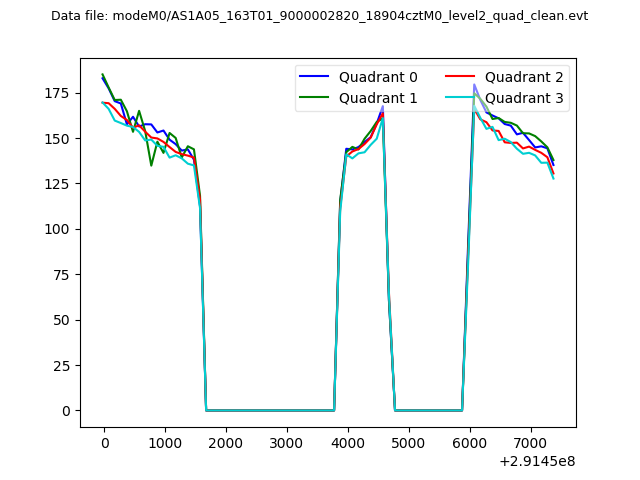
| Quadrant-wise count rates Data is divided into 100 sec bins |
 |
|
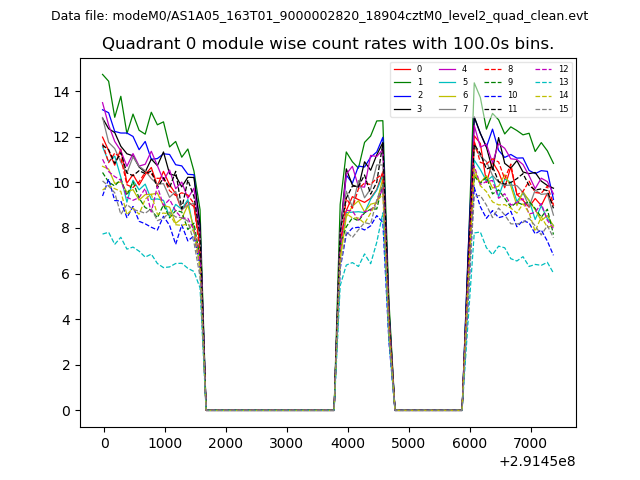
| Module-wise count rates for Quadrant A Data is divided into 100 sec bins |
 |
 |
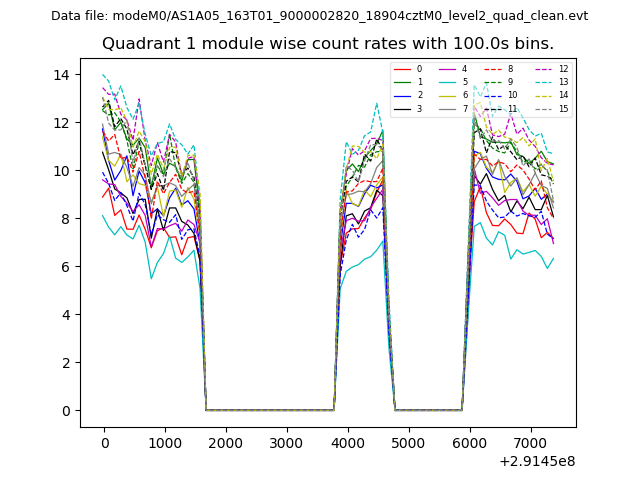
| Module-wise count rates for Quadrant B Data is divided into 100 sec bins |
 |
 |
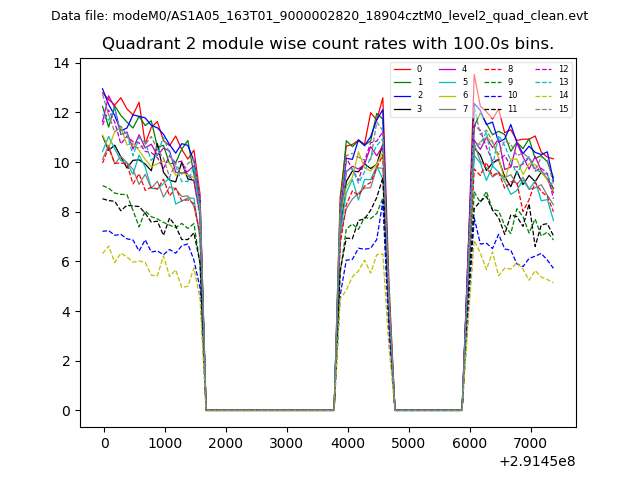
| Module-wise count rates for Quadrant C Data is divided into 100 sec bins |
 |
 |
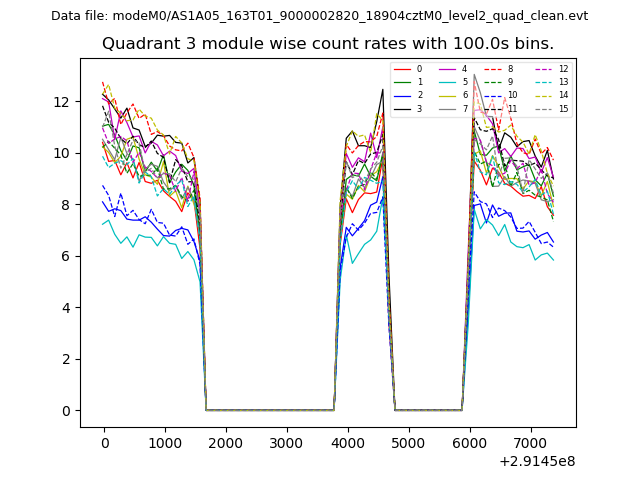
| Module-wise count rates for Quadrant D Data is divided into 100 sec bins |
 |
 |
| Parameter | Plot |
|---|---|
| CZT HV Monitor | 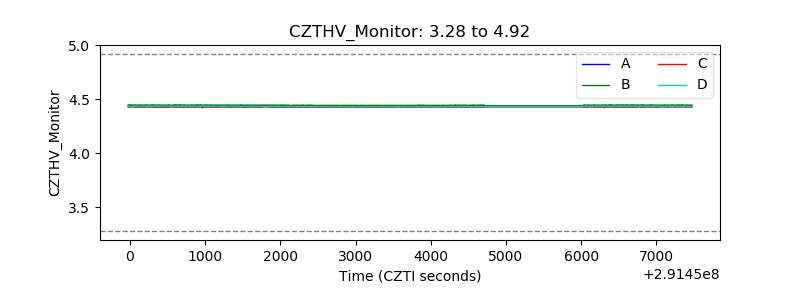 |
| D_VDD |  |
| Temperature 1 |  |
| Veto HV Monitor |  |
| Veto LLD |  |
| Alpha Counter | 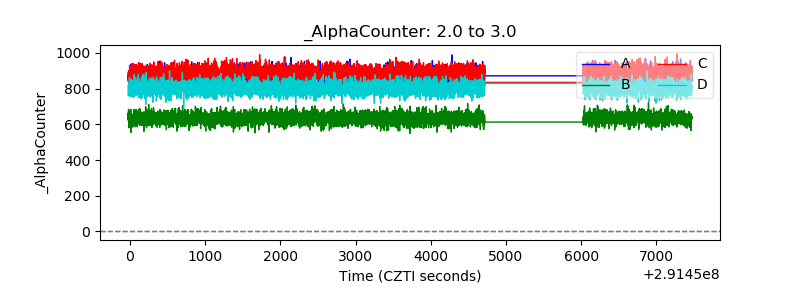 |
| _CPM_Rate | 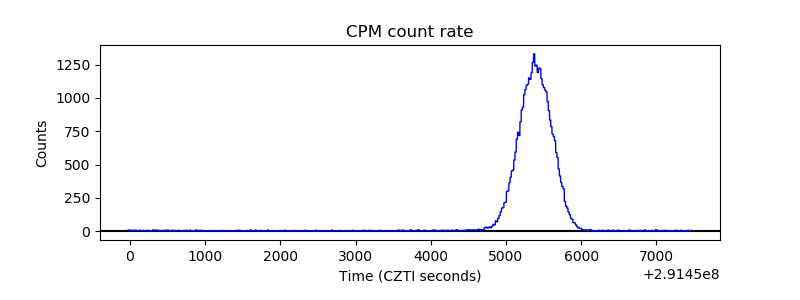 |
| CZT Counter |  |
| +2.5 Volts monitor |  |
| +5 Volts monitor |  |
| _ROLL_ROT | 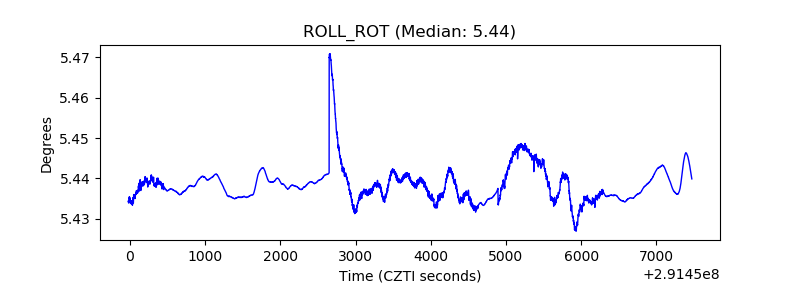 |
| _Roll_DEC | 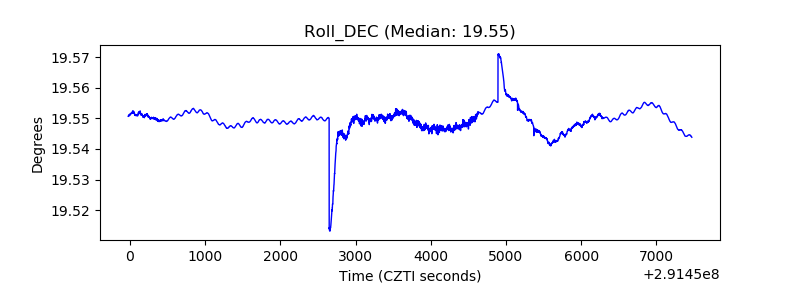 |
| _Roll_RA |  |
| Veto Counter | 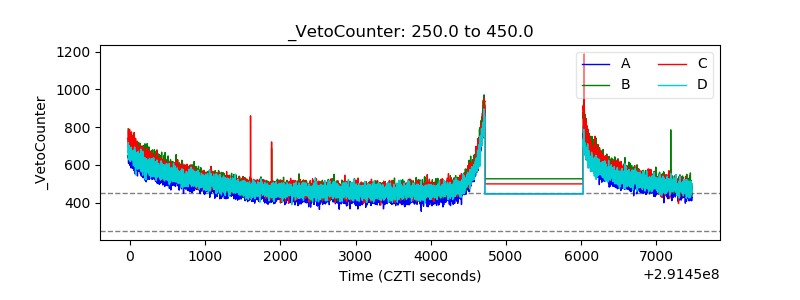 |