| Param | Original file | Final file |
|---|---|---|
| Filename | modeM0/AS1A05_163T01_9000002820_18905cztM0_level2.evt | modeM0/AS1A05_163T01_9000002820_18905cztM0_level2_quad_clean.evt |
| Size (bytes) | 542,854,080 | 77,077,440 |
| Size | 517.7 MB | 73.5 MB |
| Events in quadrant A | 4,462,974 | 475,685 |
| Events in quadrant B | 4,419,445 | 487,239 |
| Events in quadrant C | 3,045,575 | 484,599 |
| Events in quadrant D | 4,112,005 | 473,348 |
| Mode M0 | |||
|---|---|---|---|
| Quadrant | BADHDUFLAG | Total packets | Discarded packets |
| A | 0 | 16921 | 1 |
| B | 0 | 16816 | 1 |
| C | 0 | 12444 | 1 |
| D | 0 | 16059 | 1 |
| Mode SS | |||
|---|---|---|---|
| Quadrant | BADHDUFLAG | Total packets | Discarded packets |
| A | 0 | 120 | 0 |
| B | 0 | 120 | 0 |
| C | 0 | 120 | 0 |
| D | 0 | 120 | 0 |
| Mode M9 | |||
|---|---|---|---|
| Quadrant | BADHDUFLAG | Total packets | Discarded packets |
| A | 0 | 12 | 0 |
| B | 0 | 12 | 0 |
| C | 0 | 12 | 0 |
| D | 0 | 12 | 0 |
| Quadrant | Total seconds | Saturated seconds | Saturation percentage |
|---|---|---|---|
| A | 5910 | 432 | 7.309645% |
| B | 5911 | 461 | 7.799019% |
| C | 5911 | 74 | 1.251903% |
| D | 5911 | 175 | 2.960582% |
Noise dominated data is calculated using 1-second bins in cleaned event files. If a bin has >2000 counts, and if more than 50% of those come from <1% of pixels, then it is considered to be noise-dominated and hence unusable.
| Quadrant | # 1 sec bins | Bins with >0 counts | Bins with >2000 counts | High rate bins dominated by noise | Noise dominated (total time) | Noise dominated (detector-on time) | Marked lightcurve |
|---|---|---|---|---|---|---|---|
| A | 7115 | 5911 | 235 | 235 | 3.30% | 3.98% | 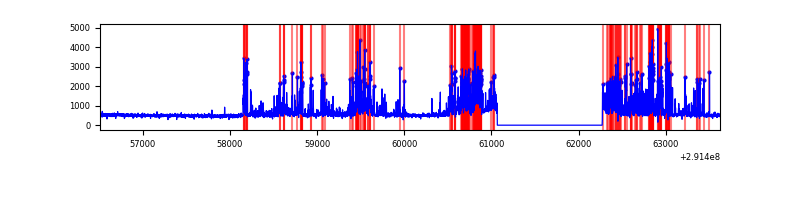 |
| B | 7116 | 5912 | 239 | 239 | 3.36% | 4.04% | 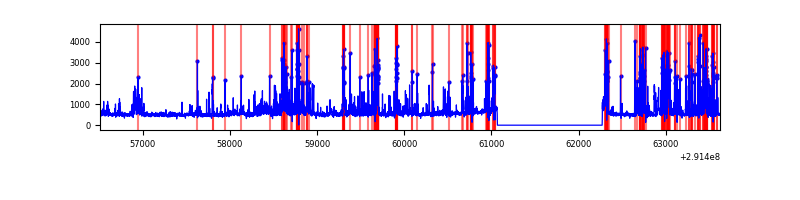 |
| C | 7116 | 5912 | 1 | 1 | 0.01% | 0.02% | 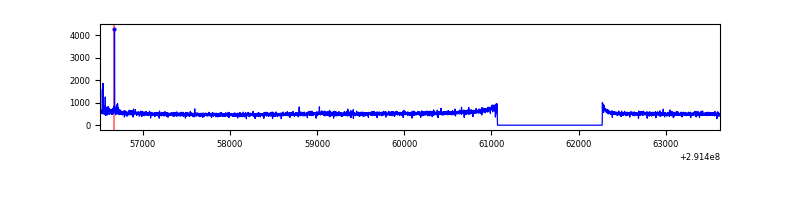 |
| D | 7116 | 5912 | 108 | 108 | 1.52% | 1.83% | 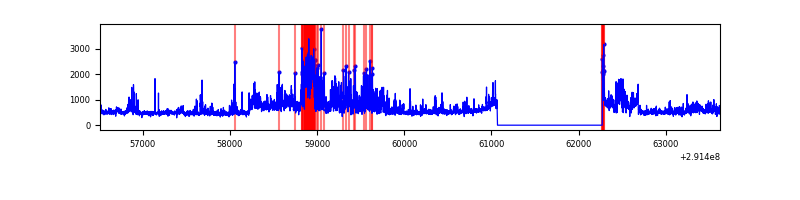 |
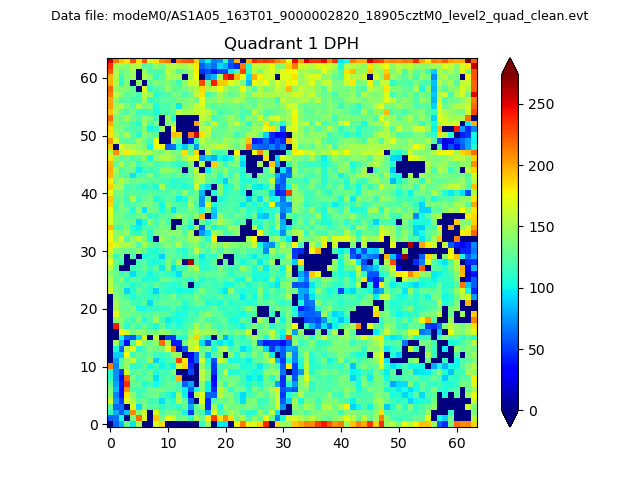
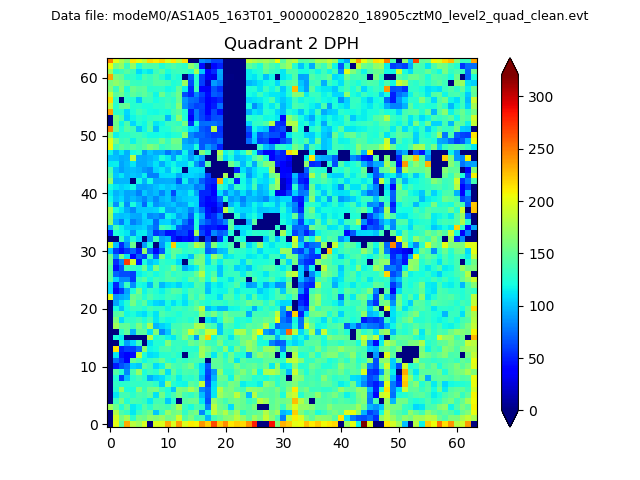
Top three noisy pixels from each quadrant. If the there are fewer than three noisy pixels in the level2.evt file, extra rows are filled as -1
| Pixel properties | Quadrant properties | ||||||
|---|---|---|---|---|---|---|---|
| Quadrant | DetID | PixID | Counts | Sigma | Mean | Median | Sigma |
| A | 14 | 235 | 1553915 | 10306.78 | 751 | 737 | 150.7 |
| A | 13 | 254 | 9546 | 58.46 | 751 | 737 | 150.7 |
| A | 8 | 144 | 8062 | 48.61 | 751 | 737 | 150.7 |
| B | 3 | 112 | 1321629 | 9422.99 | 737 | 720 | 140.2 |
| B | 7 | 220 | 124544 | 883.33 | 737 | 720 | 140.2 |
| B | 0 | 189 | 29306 | 203.92 | 737 | 720 | 140.2 |
| C | 14 | 238 | 114492 | 672.66 | 728 | 733 | 169.1 |
| C | 3 | 233 | 72667 | 425.35 | 728 | 733 | 169.1 |
| C | 5 | 112 | 20186 | 115.03 | 728 | 733 | 169.1 |
| D | 7 | 238 | 1050954 | 5797.13 | 741 | 717 | 181.2 |
| D | 12 | 233 | 173703 | 954.85 | 741 | 717 | 181.2 |
| D | 1 | 52 | 55954 | 304.9 | 741 | 717 | 181.2 |
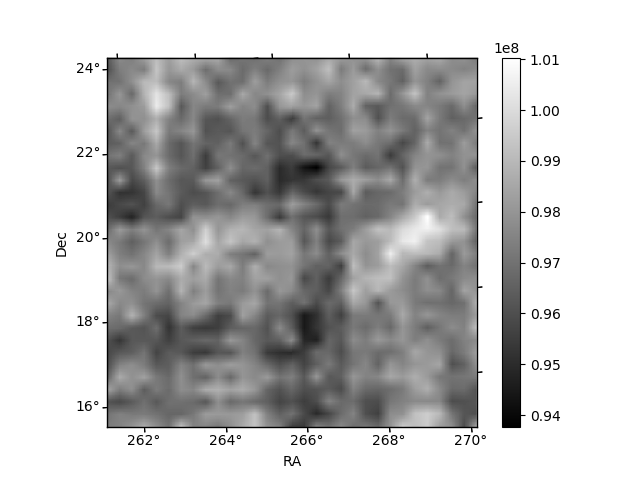
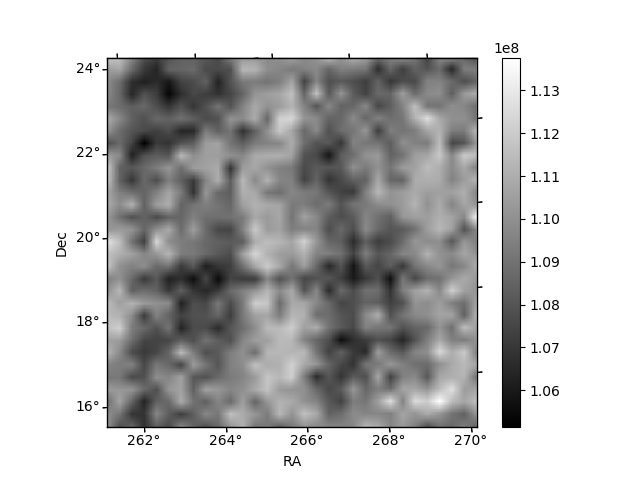
Histogram calculated using DETX and DETY for each event in the final _common_clean file
| Quadrant A | 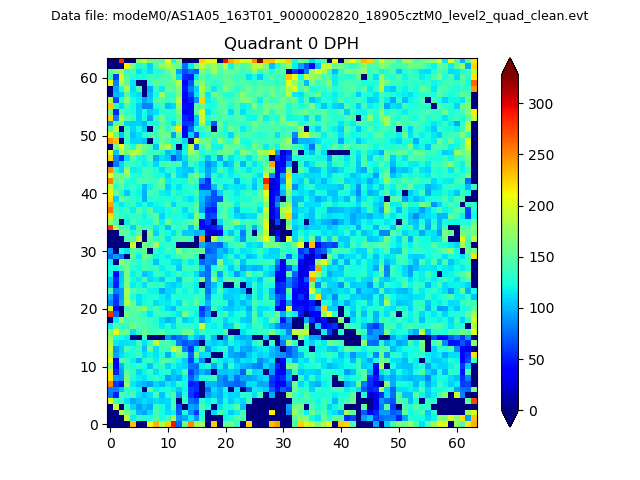 |
 |
Quadrant B |
|---|---|---|---|
| Quadrant D | 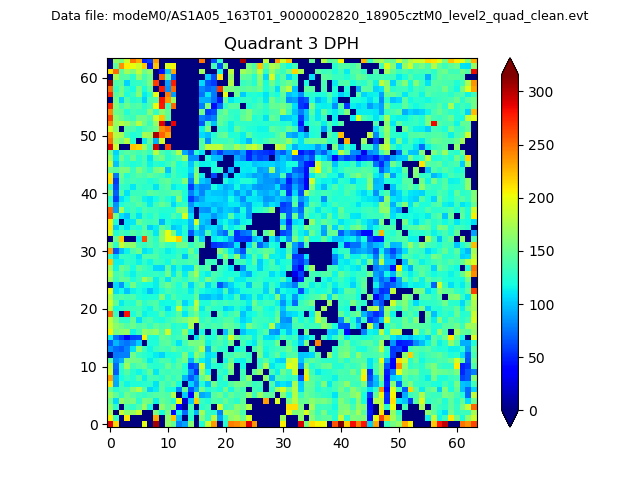 |
 |
Quadrant C |
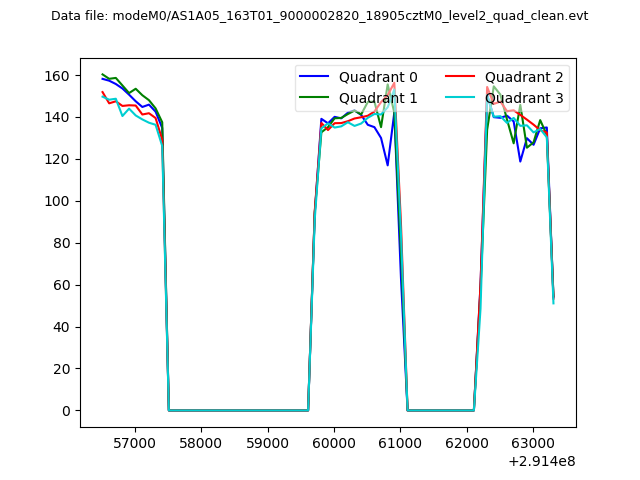
| Plot type | Count rate plots | Images |
|---|---|---|
| Comparison with Poisson distribution Blue bars denote a histogram of data divided into 1 sec bins. Red curve is a Poisson curve with rate = median count rate of data. |
 |
 |
| Quadrant-wise count rates Data is divided into 100 sec bins |
 |
|
| Module-wise count rates for Quadrant A Data is divided into 100 sec bins |
 |
 |
| Module-wise count rates for Quadrant B Data is divided into 100 sec bins |
 |
 |
| Module-wise count rates for Quadrant C Data is divided into 100 sec bins |
 |
 |
| Module-wise count rates for Quadrant D Data is divided into 100 sec bins |
 |
 |
| Parameter | Plot |
|---|---|
| CZT HV Monitor |  |
| D_VDD | 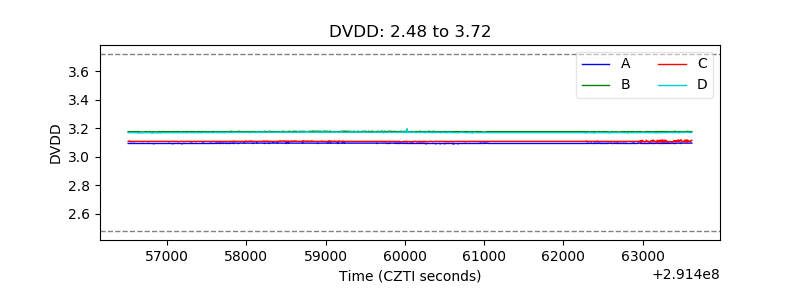 |
| Temperature 1 | 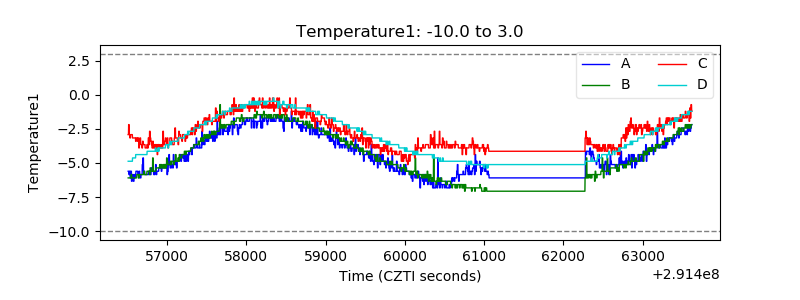 |
| Veto HV Monitor | 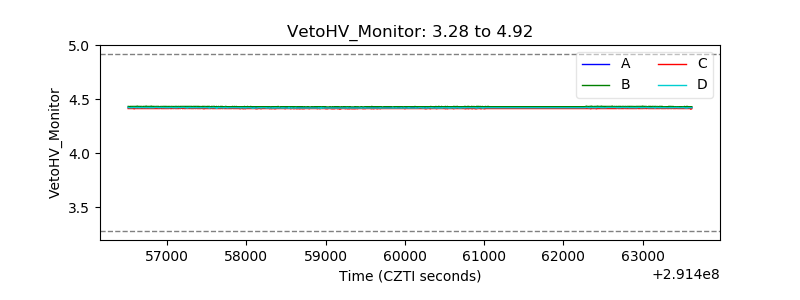 |
| Veto LLD | 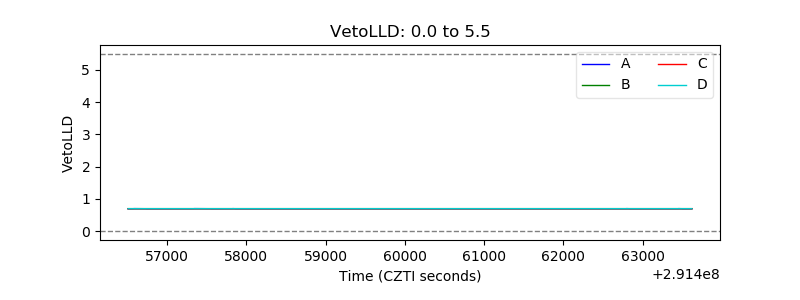 |
| Alpha Counter | 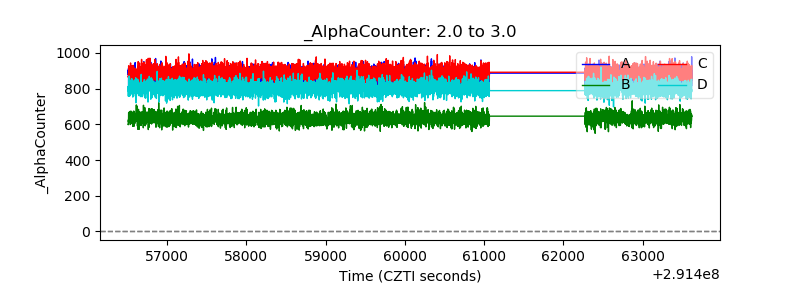 |
| _CPM_Rate | 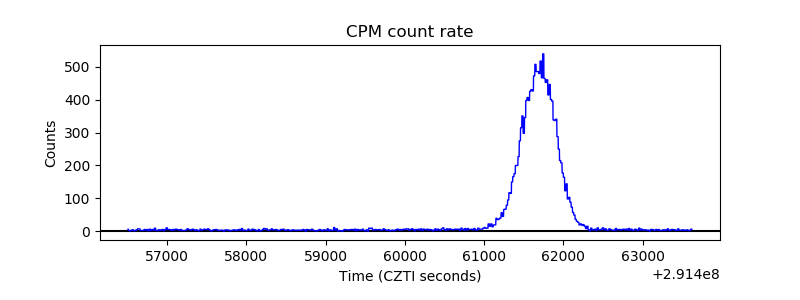 |
| CZT Counter | 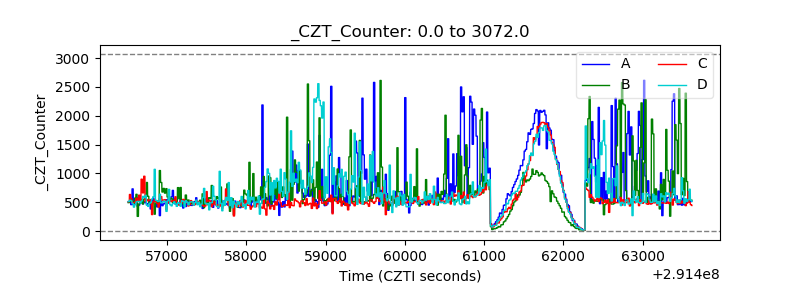 |
| +2.5 Volts monitor |  |
| +5 Volts monitor | 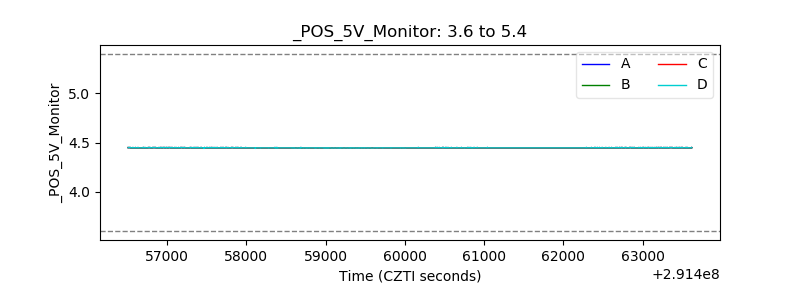 |
| _ROLL_ROT |  |
| _Roll_DEC | 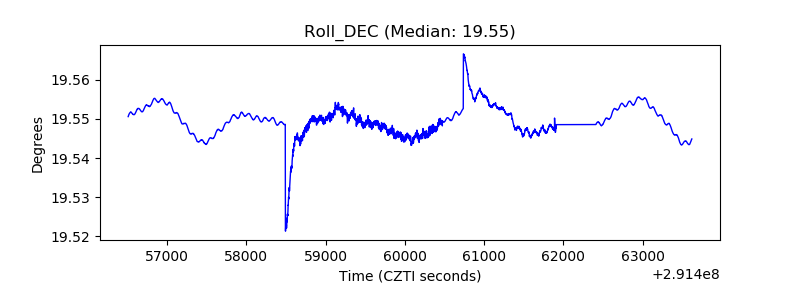 |
| _Roll_RA | 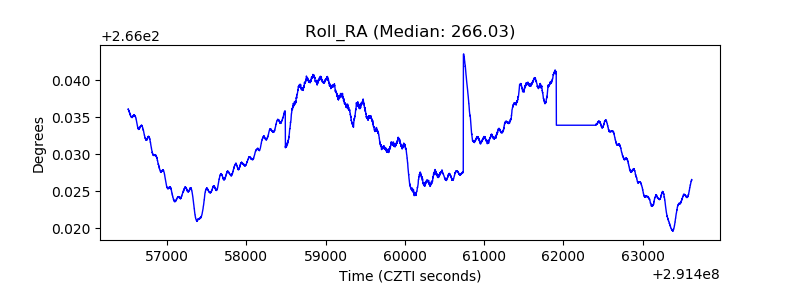 |
| Veto Counter |  |