| Param | Original file | Final file |
|---|---|---|
| Filename | modeM0/AS1A05_163T01_9000002820_18906cztM0_level2.evt | modeM0/AS1A05_163T01_9000002820_18906cztM0_level2_quad_clean.evt |
| Size (bytes) | 827,637,120 | 76,616,640 |
| Size | 789.3 MB | 73.1 MB |
| Events in quadrant A | 9,895,791 | 365,388 |
| Events in quadrant B | 5,708,739 | 490,792 |
| Events in quadrant C | 3,321,736 | 504,749 |
| Events in quadrant D | 5,689,622 | 494,067 |
| Mode M0 | |||
|---|---|---|---|
| Quadrant | BADHDUFLAG | Total packets | Discarded packets |
| A | 0 | 33882 | 2 |
| B | 0 | 21244 | 1 |
| C | 0 | 13701 | 1 |
| D | 0 | 21203 | 1 |
| Mode SS | |||
|---|---|---|---|
| Quadrant | BADHDUFLAG | Total packets | Discarded packets |
| A | 0 | 134 | 0 |
| B | 0 | 134 | 0 |
| C | 0 | 134 | 0 |
| D | 0 | 134 | 0 |
| Mode M9 | |||
|---|---|---|---|
| Quadrant | BADHDUFLAG | Total packets | Discarded packets |
| A | 0 | 8 | 0 |
| B | 0 | 8 | 0 |
| C | 0 | 8 | 0 |
| D | 0 | 8 | 0 |
| Quadrant | Total seconds | Saturated seconds | Saturation percentage |
|---|---|---|---|
| A | 6655 | 2727 | 40.976709% |
| B | 6656 | 878 | 13.191106% |
| C | 6656 | 132 | 1.983173% |
| D | 6656 | 649 | 9.750601% |
Noise dominated data is calculated using 1-second bins in cleaned event files. If a bin has >2000 counts, and if more than 50% of those come from <1% of pixels, then it is considered to be noise-dominated and hence unusable.
| Quadrant | # 1 sec bins | Bins with >0 counts | Bins with >2000 counts | High rate bins dominated by noise | Noise dominated (total time) | Noise dominated (detector-on time) | Marked lightcurve |
|---|---|---|---|---|---|---|---|
| A | 7475 | 6656 | 2039 | 2039 | 27.28% | 30.63% | 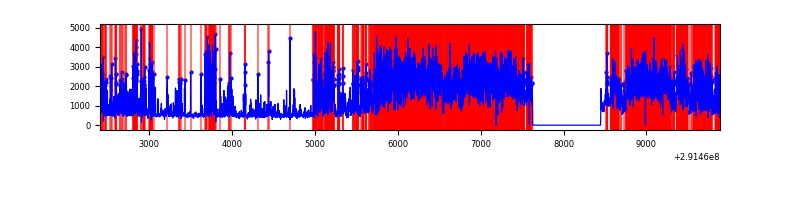 |
| B | 7475 | 6656 | 478 | 478 | 6.39% | 7.18% | 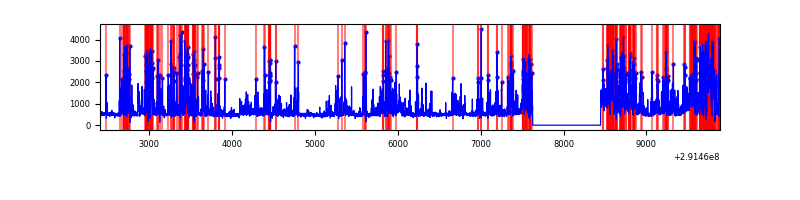 |
| C | 7476 | 6657 | 0 | 0 | 0.00% | 0.00% |  |
| D | 7476 | 6656 | 435 | 435 | 5.82% | 6.54% | 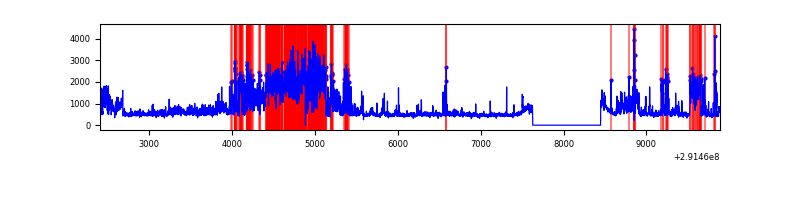 |
Top three noisy pixels from each quadrant. If the there are fewer than three noisy pixels in the level2.evt file, extra rows are filled as -1
| Pixel properties | Quadrant properties | ||||||
|---|---|---|---|---|---|---|---|
| Quadrant | DetID | PixID | Counts | Sigma | Mean | Median | Sigma |
| A | 14 | 235 | 7193558 | 50798.71 | 698 | 685 | 141.6 |
| A | 13 | 254 | 8577 | 55.74 | 698 | 685 | 141.6 |
| A | 11 | 29 | 6892 | 43.84 | 698 | 685 | 141.6 |
| B | 3 | 112 | 2419832 | 16250.21 | 784 | 766 | 148.9 |
| B | 7 | 220 | 154144 | 1030.33 | 784 | 766 | 148.9 |
| B | 12 | 111 | 17596 | 113.06 | 784 | 766 | 148.9 |
| C | 14 | 238 | 124578 | 664.64 | 801 | 806 | 186.2 |
| C | 3 | 233 | 54080 | 286.08 | 801 | 806 | 186.2 |
| C | 8 | 128 | 9532 | 46.86 | 801 | 806 | 186.2 |
| D | 7 | 238 | 2191139 | 11243.28 | 799 | 775 | 194.8 |
| D | 1 | 52 | 217184 | 1110.84 | 799 | 775 | 194.8 |
| D | 12 | 233 | 106221 | 541.26 | 799 | 775 | 194.8 |
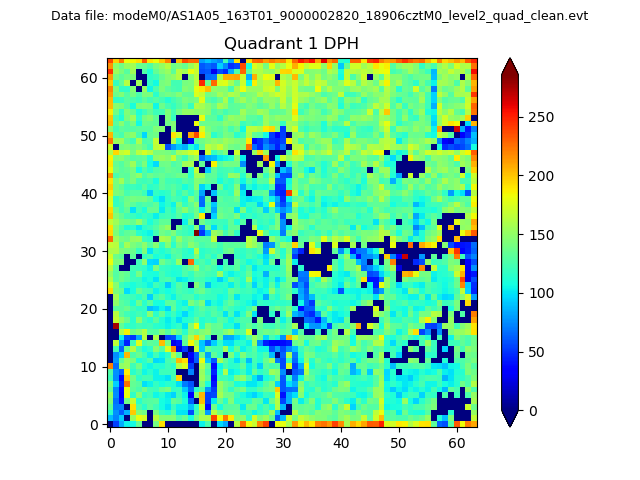
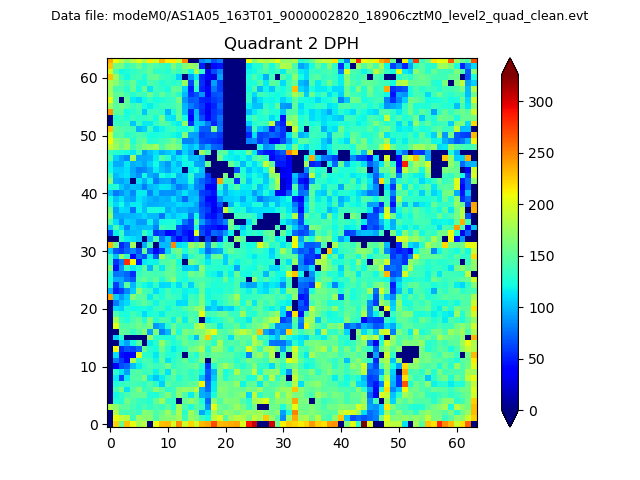
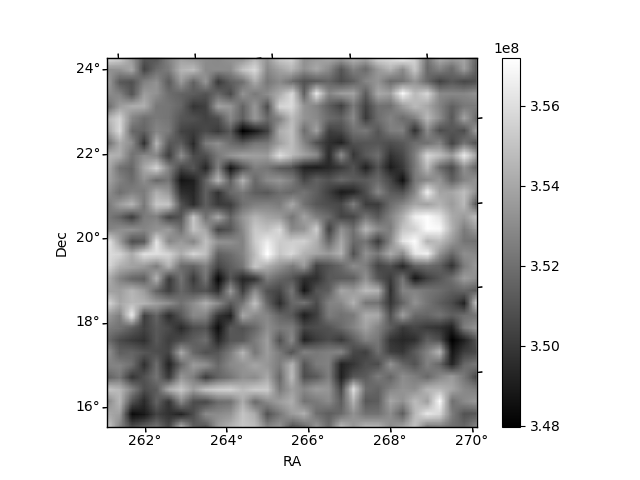
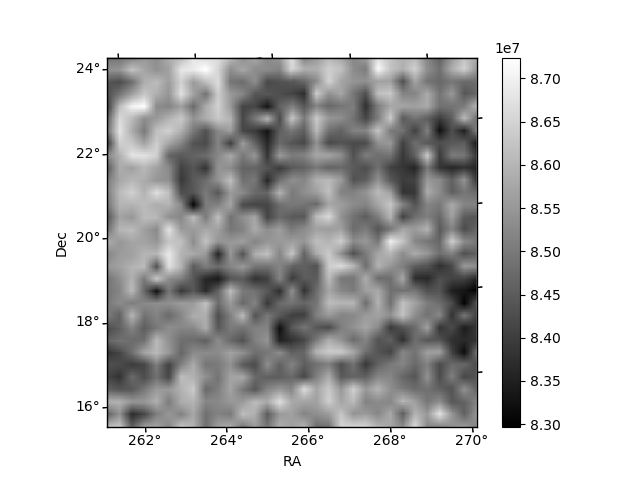
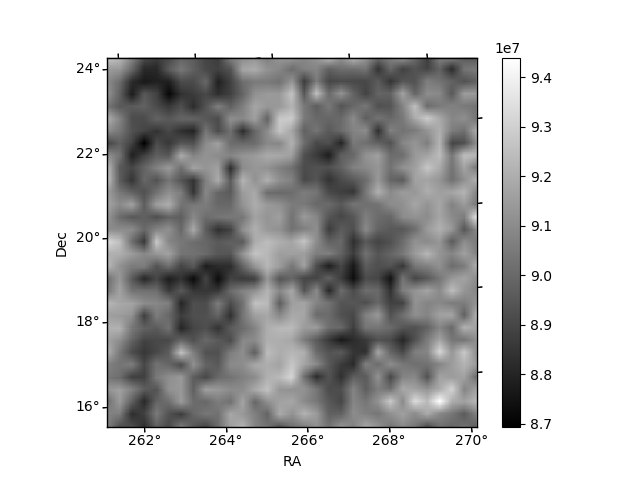
Histogram calculated using DETX and DETY for each event in the final _common_clean file
| Quadrant A | 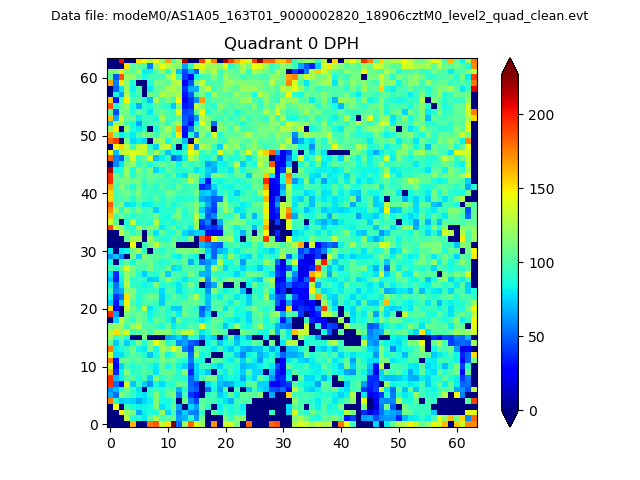 |
 |
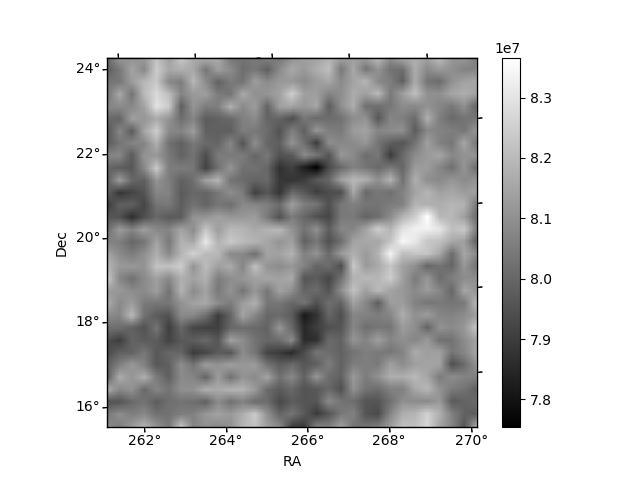
Quadrant B |
|---|---|---|---|
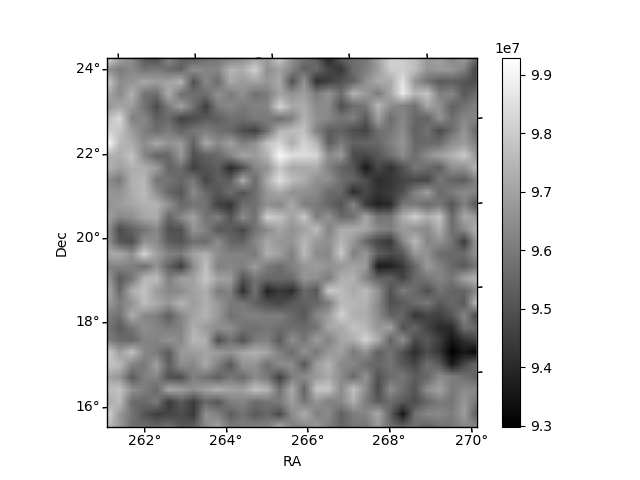
| Quadrant D | 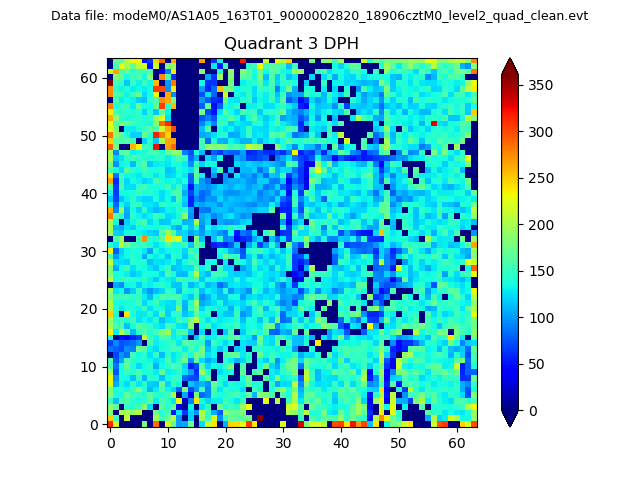 |
 |
Quadrant C |
| Plot type | Count rate plots | Images |
|---|---|---|
| Comparison with Poisson distribution Blue bars denote a histogram of data divided into 1 sec bins. Red curve is a Poisson curve with rate = median count rate of data. |
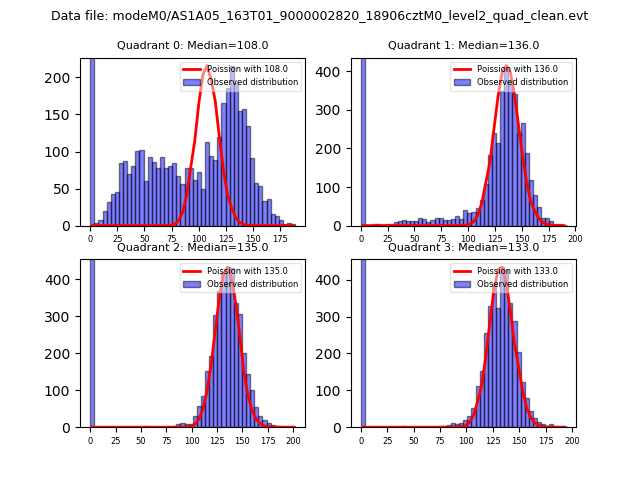 |
 |
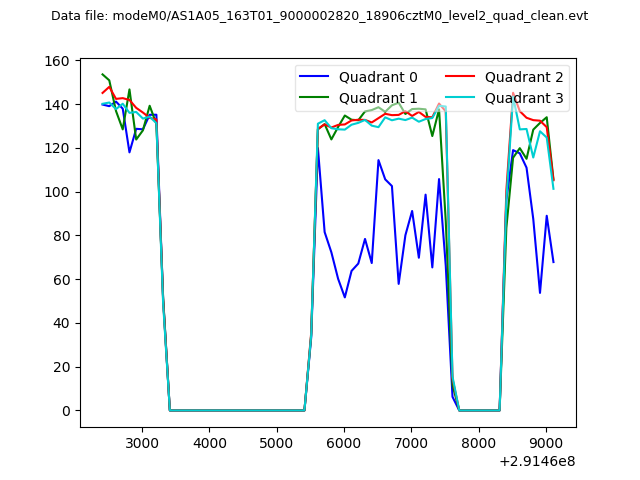
| Quadrant-wise count rates Data is divided into 100 sec bins |
 |
|
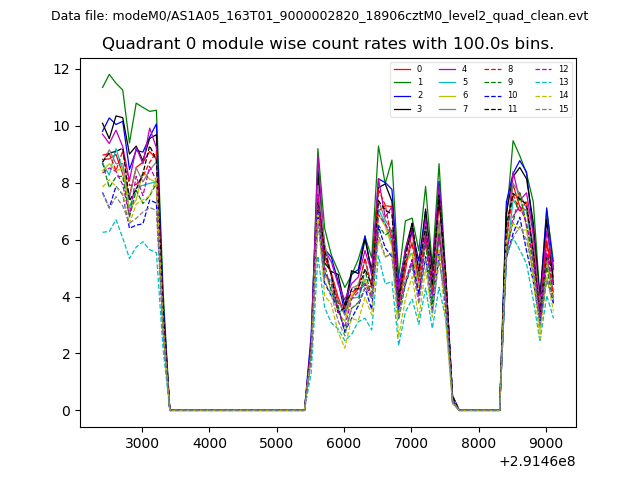
| Module-wise count rates for Quadrant A Data is divided into 100 sec bins |
 |
 |
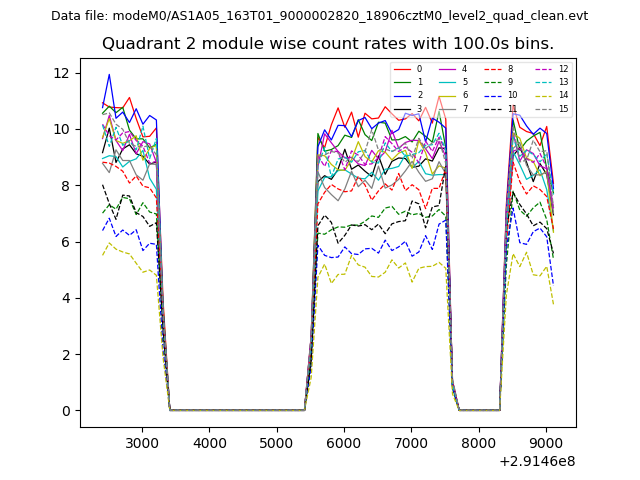
| Module-wise count rates for Quadrant B Data is divided into 100 sec bins |
 |
 |
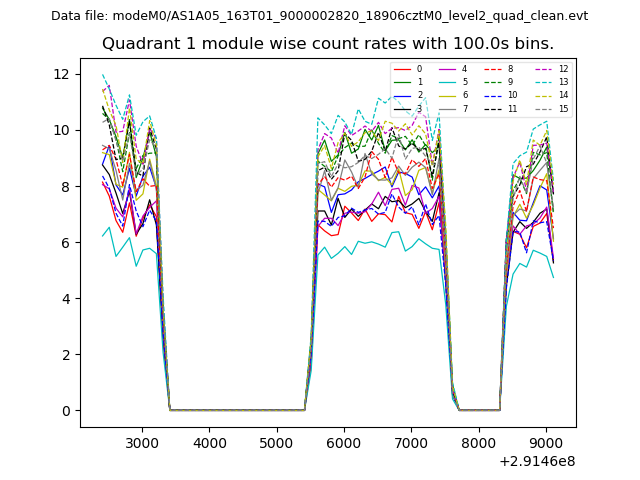
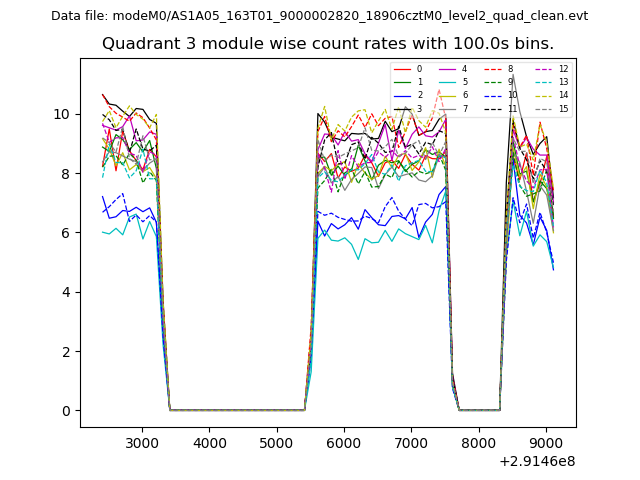
| Module-wise count rates for Quadrant C Data is divided into 100 sec bins |
 |
 |
| Module-wise count rates for Quadrant D Data is divided into 100 sec bins |
 |
 |
| Parameter | Plot |
|---|---|
| CZT HV Monitor | 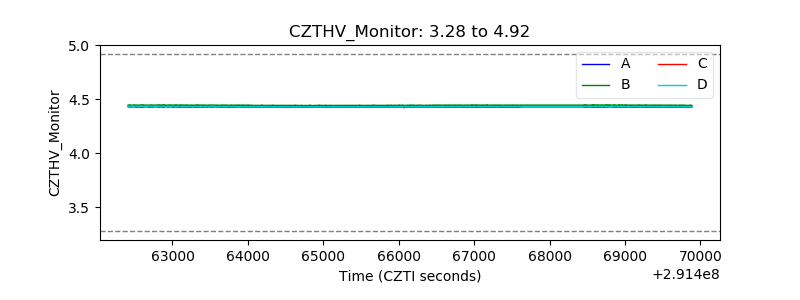 |
| D_VDD | 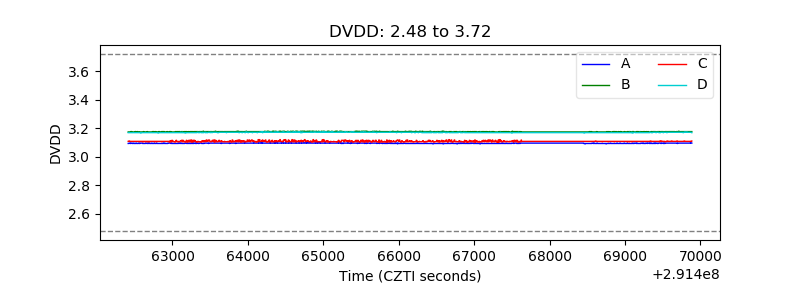 |
| Temperature 1 | 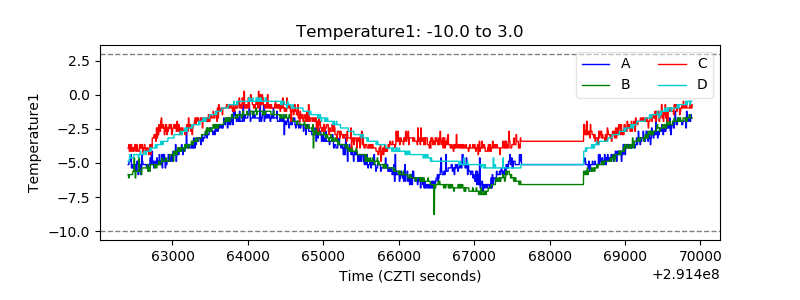 |
| Veto HV Monitor | 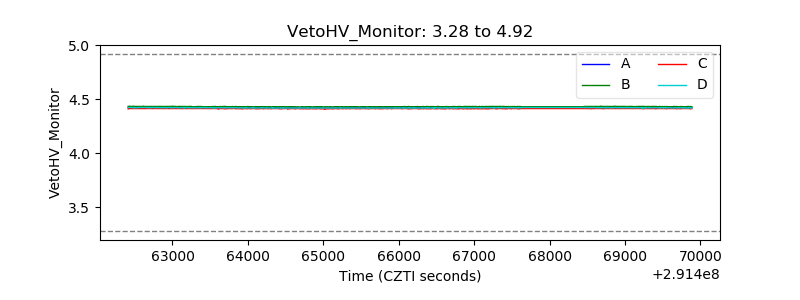 |
| Veto LLD | 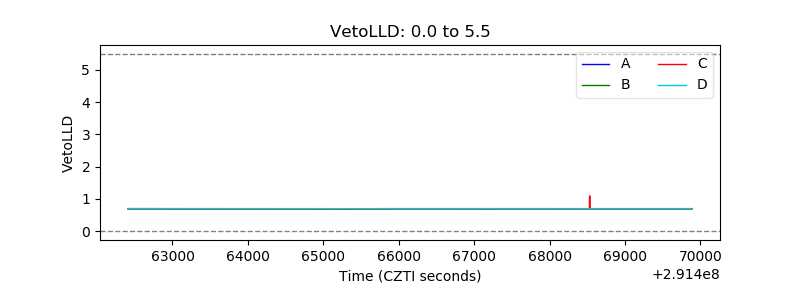 |
| Alpha Counter | 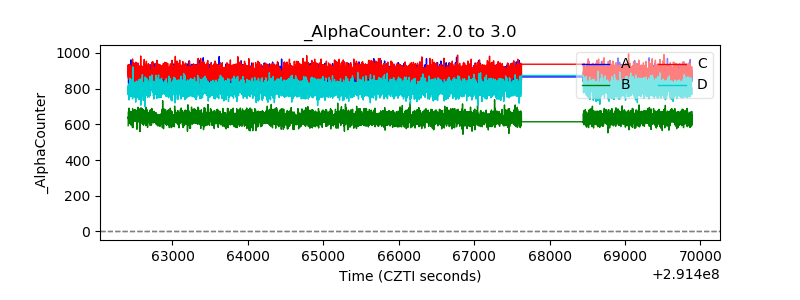 |
| _CPM_Rate | 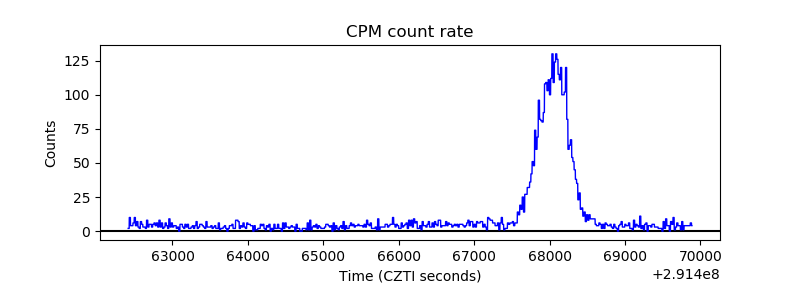 |
| CZT Counter | 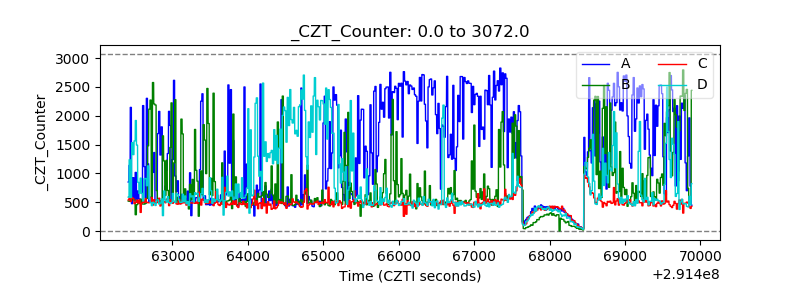 |
| +2.5 Volts monitor |  |
| +5 Volts monitor | 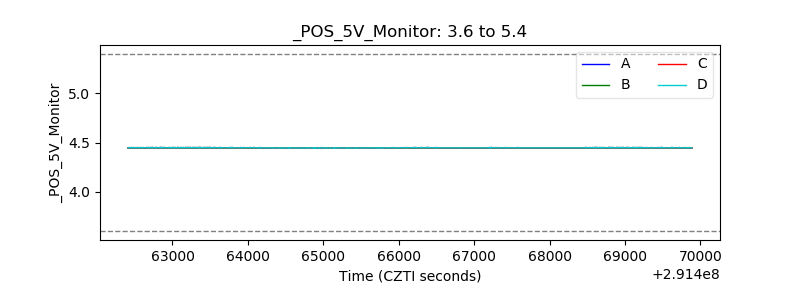 |
| _ROLL_ROT | 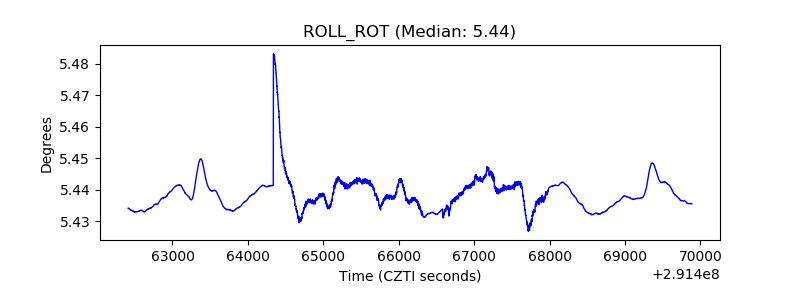 |
| _Roll_DEC | 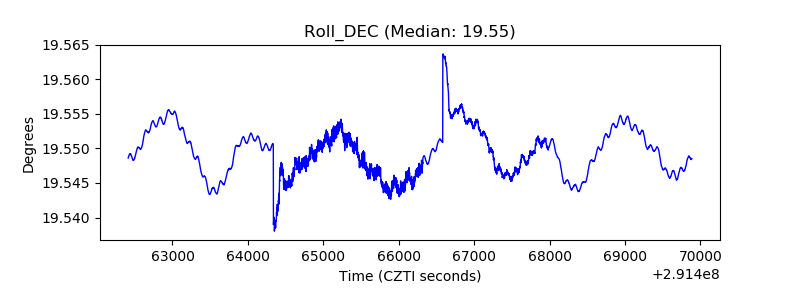 |
| _Roll_RA | 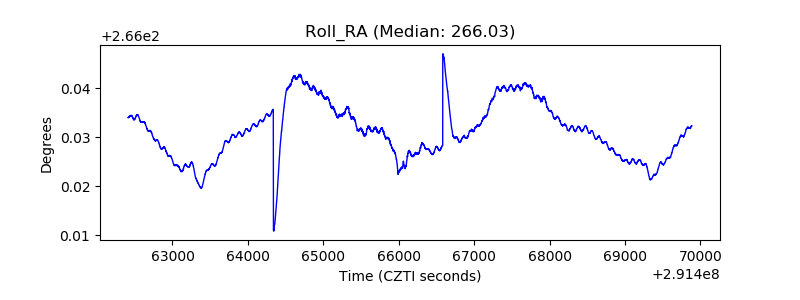 |
| Veto Counter | 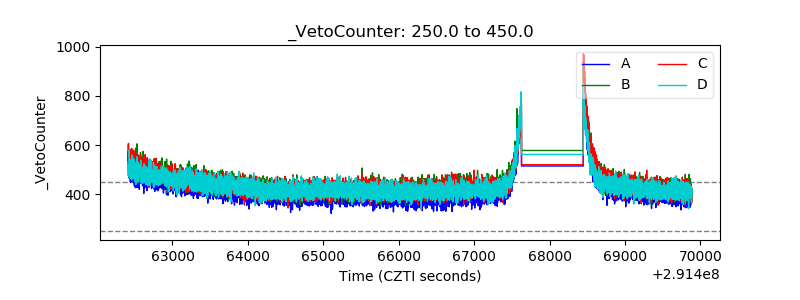 |