| Param | Original file | Final file |
|---|---|---|
| Filename | modeM0/AS1A05_163T01_9000002820_18907cztM0_level2.evt | modeM0/AS1A05_163T01_9000002820_18907cztM0_level2_quad_clean.evt |
| Size (bytes) | 1,023,238,080 | 67,769,280 |
| Size | 975.8 MB | 64.6 MB |
| Events in quadrant A | 11,091,705 | 274,746 |
| Events in quadrant B | 11,470,022 | 342,277 |
| Events in quadrant C | 3,572,557 | 472,063 |
| Events in quadrant D | 4,368,396 | 458,676 |
| Mode M0 | |||
|---|---|---|---|
| Quadrant | BADHDUFLAG | Total packets | Discarded packets |
| A | 0 | 37835 | 1 |
| B | 0 | 39002 | 1 |
| C | 0 | 14909 | 1 |
| D | 0 | 17575 | 1 |
| Mode SS | |||
|---|---|---|---|
| Quadrant | BADHDUFLAG | Total packets | Discarded packets |
| A | 0 | 144 | 0 |
| B | 0 | 144 | 0 |
| C | 0 | 144 | 0 |
| D | 0 | 144 | 0 |
| Mode M9 | |||
|---|---|---|---|
| Quadrant | BADHDUFLAG | Total packets | Discarded packets |
| A | 0 | 5 | 0 |
| B | 0 | 5 | 0 |
| C | 0 | 5 | 0 |
| D | 0 | 5 | 0 |
| Quadrant | Total seconds | Saturated seconds | Saturation percentage |
|---|---|---|---|
| A | 7219 | 3255 | 45.089348% |
| B | 7219 | 3698 | 51.225932% |
| C | 7219 | 159 | 2.202521% |
| D | 7219 | 192 | 2.659648% |
Noise dominated data is calculated using 1-second bins in cleaned event files. If a bin has >2000 counts, and if more than 50% of those come from <1% of pixels, then it is considered to be noise-dominated and hence unusable.
| Quadrant | # 1 sec bins | Bins with >0 counts | Bins with >2000 counts | High rate bins dominated by noise | Noise dominated (total time) | Noise dominated (detector-on time) | Marked lightcurve |
|---|---|---|---|---|---|---|---|
| A | 7624 | 7220 | 2466 | 2466 | 32.35% | 34.16% | 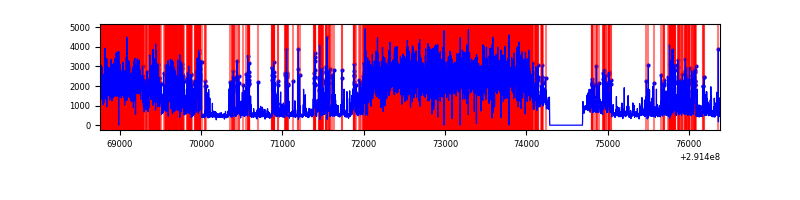 |
| B | 7624 | 7217 | 2559 | 2559 | 33.57% | 35.46% | 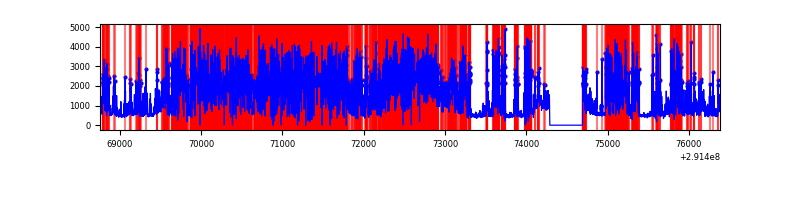 |
| C | 7624 | 7220 | 0 | 0 | 0.00% | 0.00% | 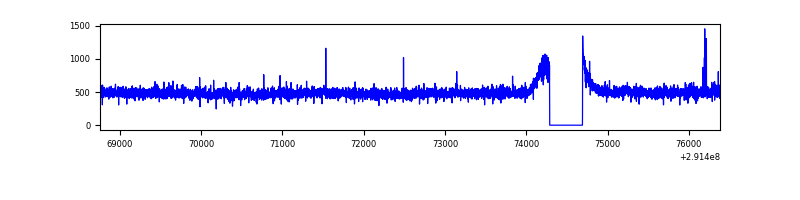 |
| D | 7624 | 7220 | 75 | 75 | 0.98% | 1.04% | 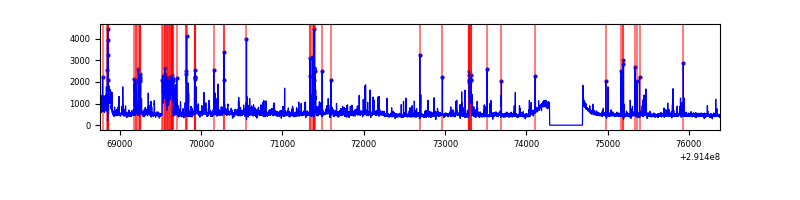 |
Top three noisy pixels from each quadrant. If the there are fewer than three noisy pixels in the level2.evt file, extra rows are filled as -1
| Pixel properties | Quadrant properties | ||||||
|---|---|---|---|---|---|---|---|
| Quadrant | DetID | PixID | Counts | Sigma | Mean | Median | Sigma |
| A | 14 | 235 | 8345656 | 58216.62 | 704 | 690 | 143.3 |
| A | 15 | 174 | 21756 | 146.96 | 704 | 690 | 143.3 |
| A | 13 | 254 | 8936 | 57.53 | 704 | 690 | 143.3 |
| B | 3 | 112 | 8725588 | 71342.57 | 630 | 614 | 122.3 |
| B | 7 | 220 | 142687 | 1161.71 | 630 | 614 | 122.3 |
| B | 4 | 216 | 73141 | 593.04 | 630 | 614 | 122.3 |
| C | 14 | 238 | 131334 | 643.99 | 854 | 860 | 202.6 |
| C | 3 | 233 | 99965 | 489.16 | 854 | 860 | 202.6 |
| C | 5 | 112 | 10613 | 48.14 | 854 | 860 | 202.6 |
| D | 7 | 238 | 546587 | 2577.91 | 867 | 842 | 211.7 |
| D | 1 | 52 | 341097 | 1607.25 | 867 | 842 | 211.7 |
| D | 12 | 1 | 54392 | 252.95 | 867 | 842 | 211.7 |
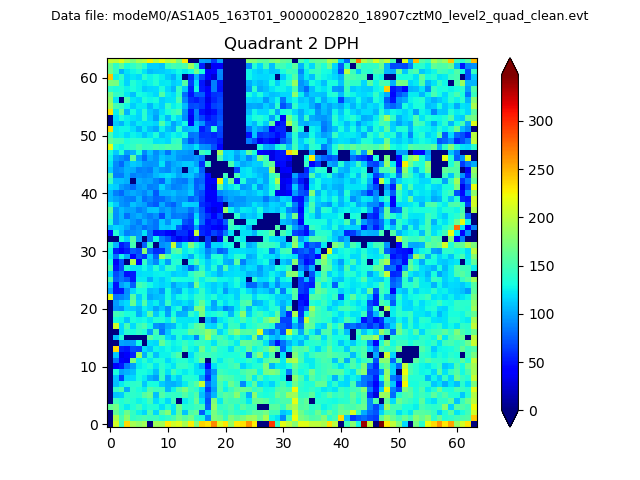
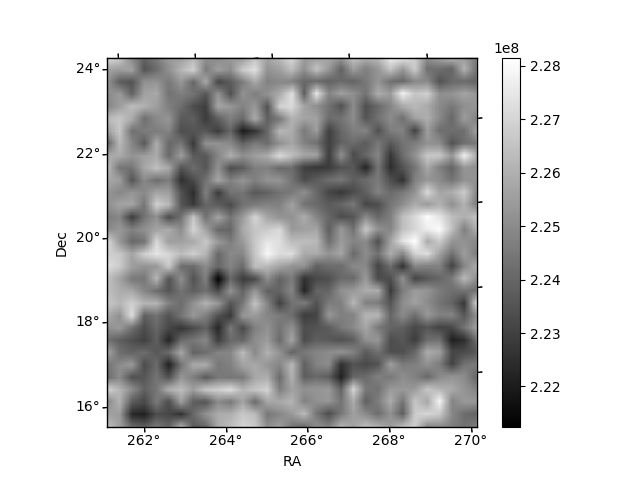
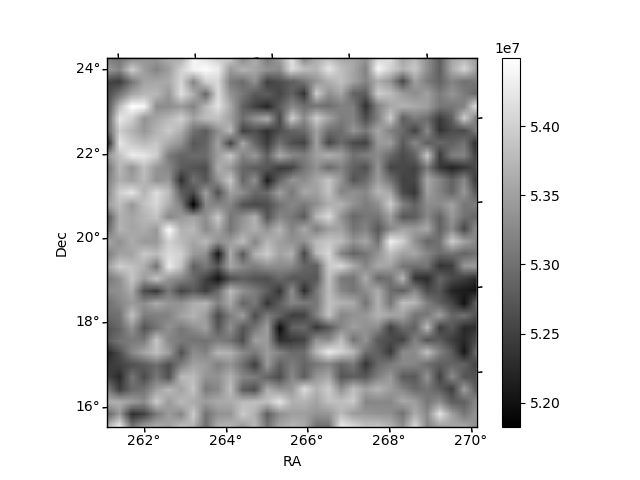
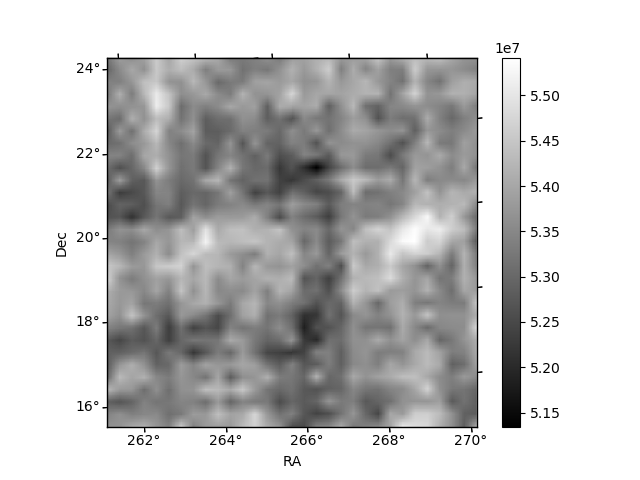
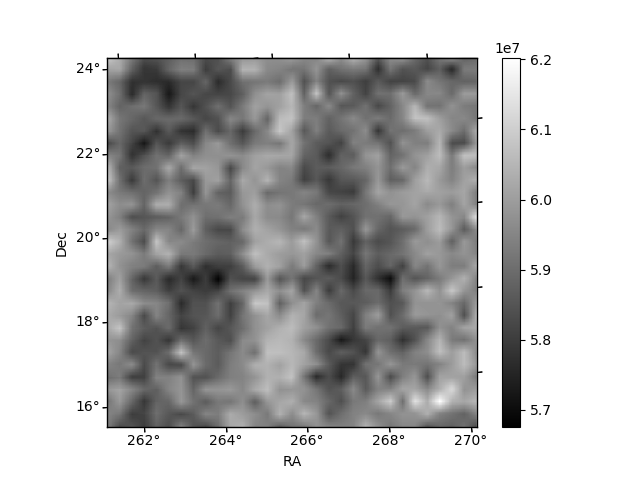
Histogram calculated using DETX and DETY for each event in the final _common_clean file
| Quadrant A | 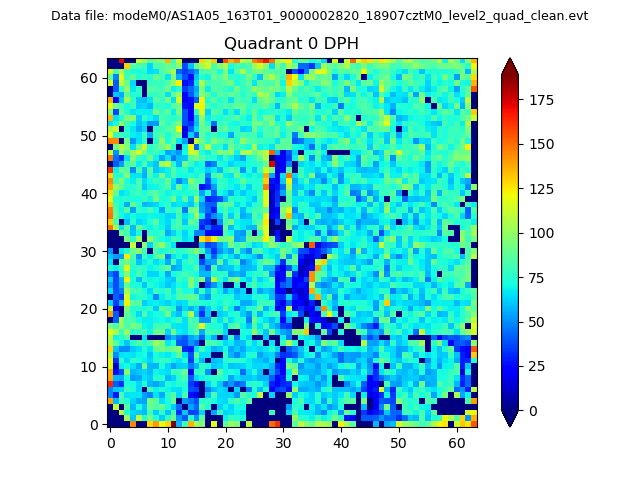 |
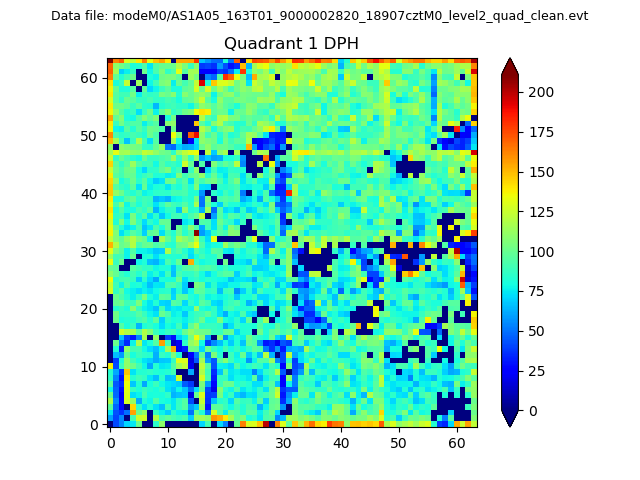 |
Quadrant B |
|---|---|---|---|
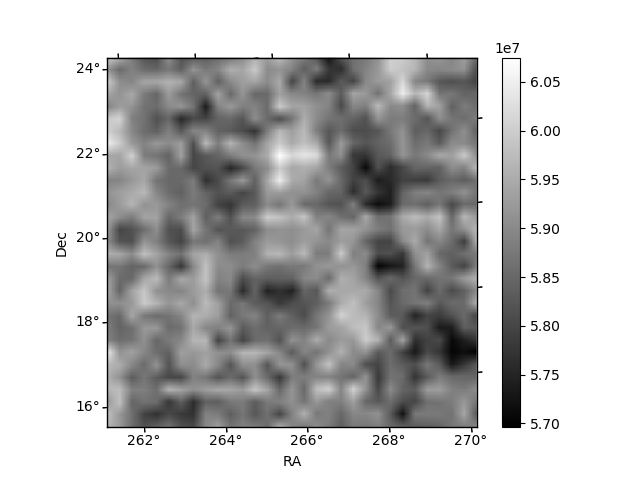
| Quadrant D | 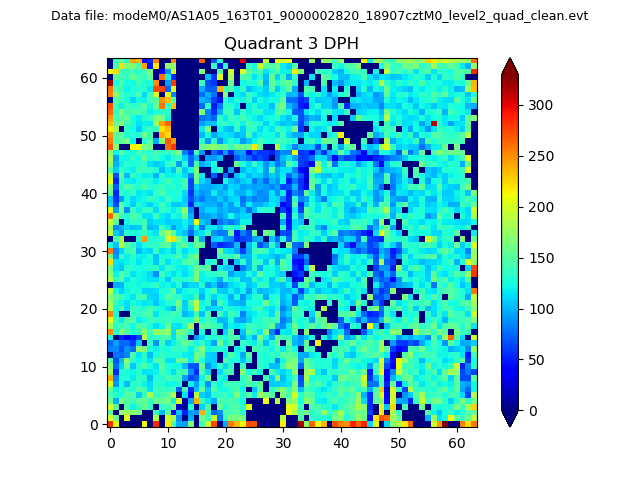 |
 |
Quadrant C |
| Plot type | Count rate plots | Images |
|---|---|---|
| Comparison with Poisson distribution Blue bars denote a histogram of data divided into 1 sec bins. Red curve is a Poisson curve with rate = median count rate of data. |
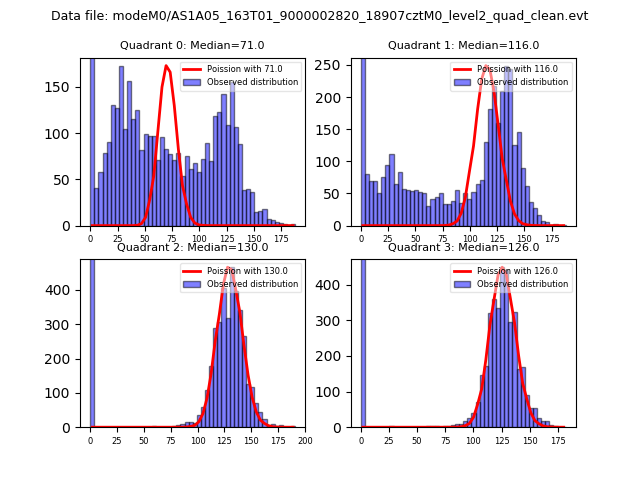 |
 |
| Quadrant-wise count rates Data is divided into 100 sec bins |
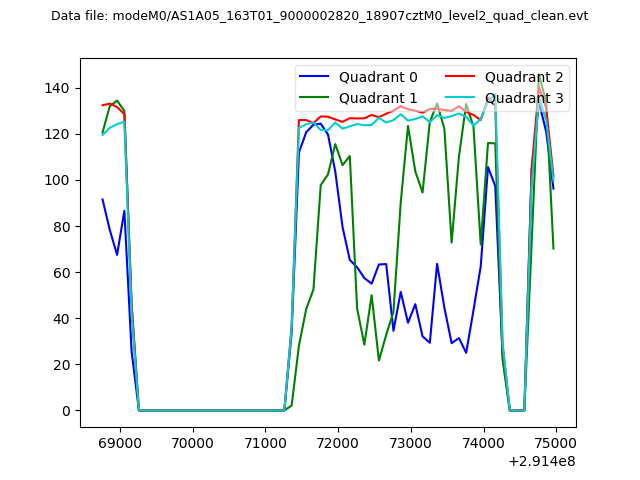 |
|
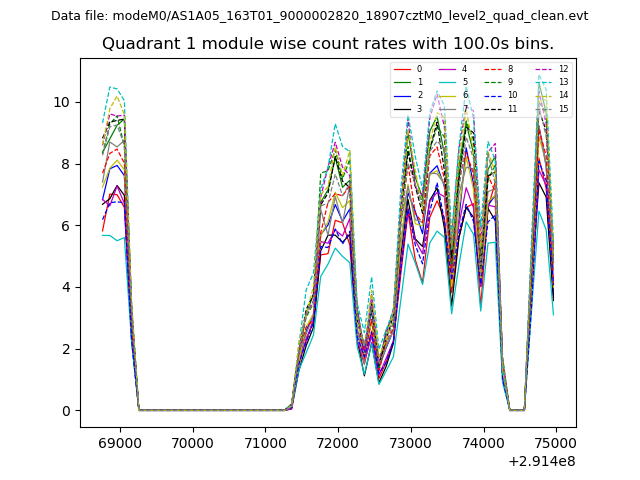
| Module-wise count rates for Quadrant A Data is divided into 100 sec bins |
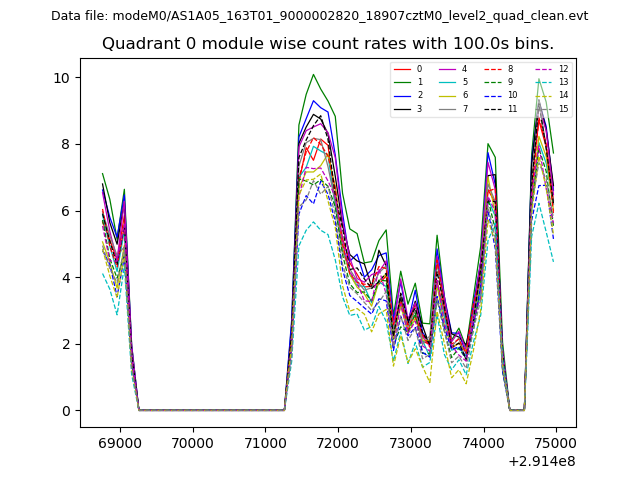 |
 |
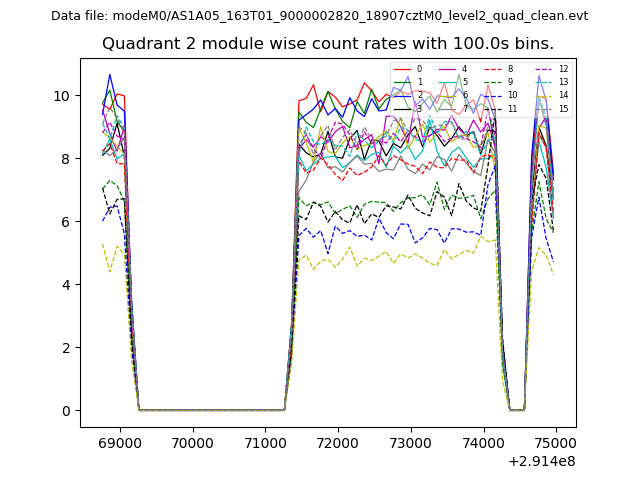
| Module-wise count rates for Quadrant B Data is divided into 100 sec bins |
 |
 |
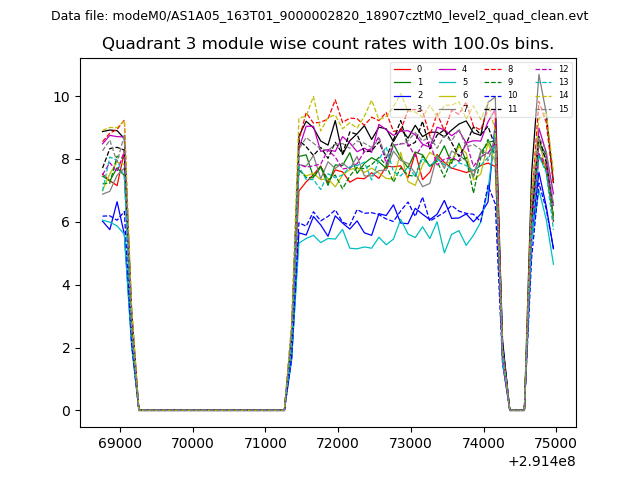
| Module-wise count rates for Quadrant C Data is divided into 100 sec bins |
 |
 |
| Module-wise count rates for Quadrant D Data is divided into 100 sec bins |
 |
 |
| Parameter | Plot |
|---|---|
| CZT HV Monitor | 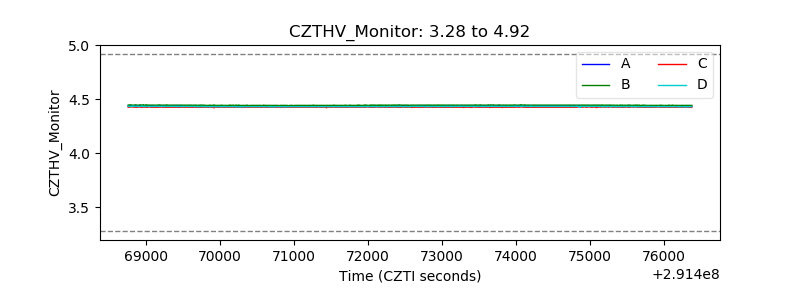 |
| D_VDD | 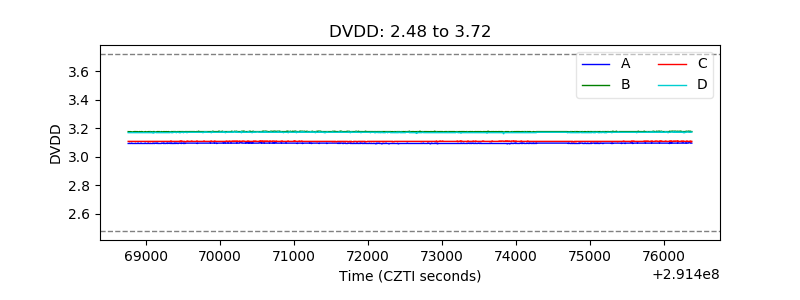 |
| Temperature 1 | 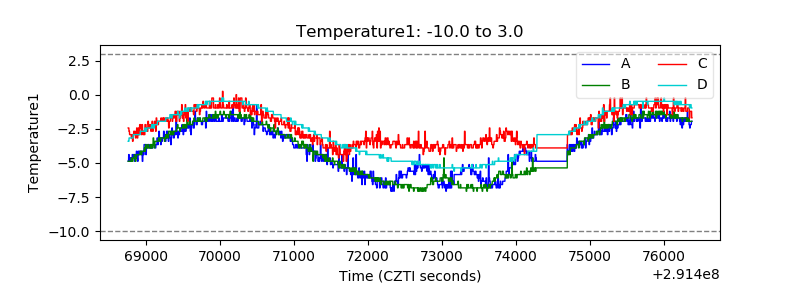 |
| Veto HV Monitor | 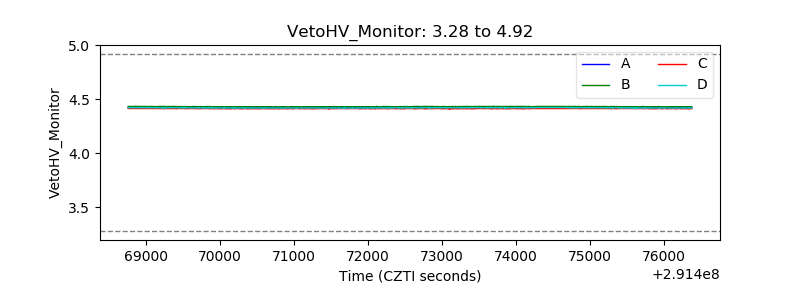 |
| Veto LLD | 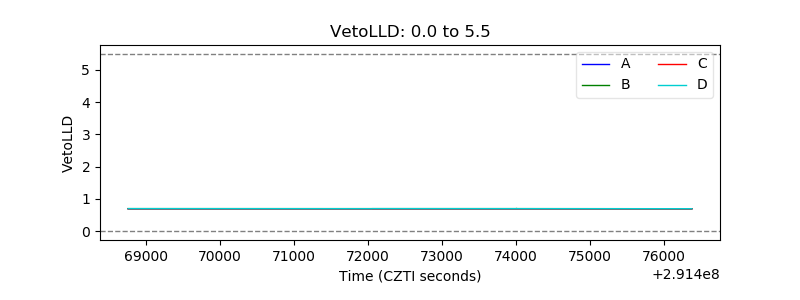 |
| Alpha Counter | 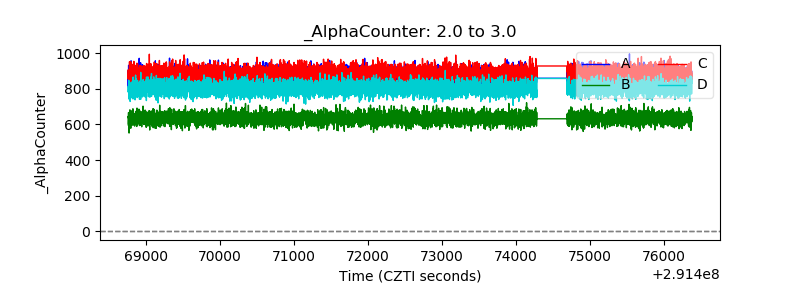 |
| _CPM_Rate | 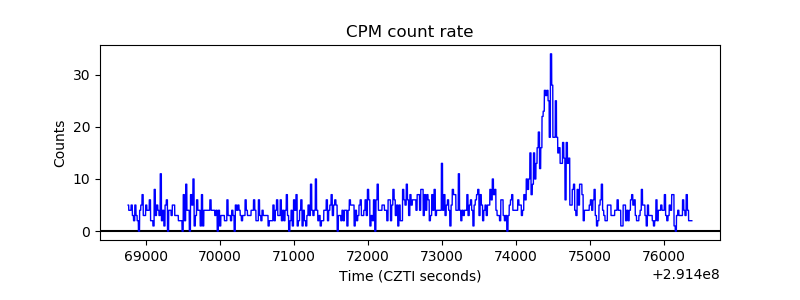 |
| CZT Counter | 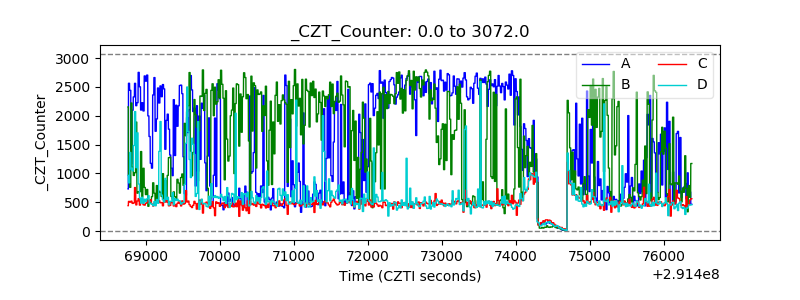 |
| +2.5 Volts monitor | 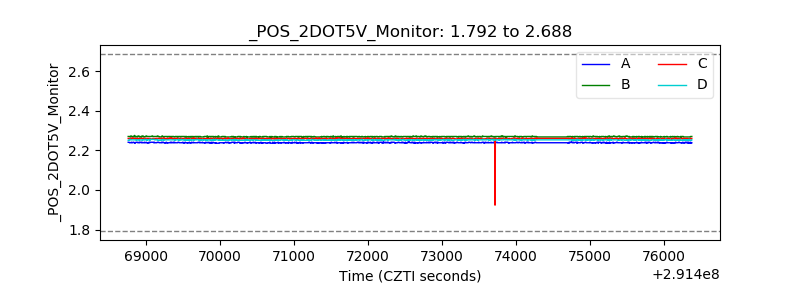 |
| +5 Volts monitor |  |
| _ROLL_ROT | 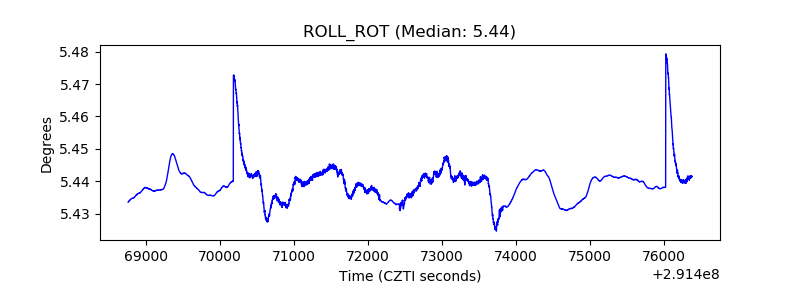 |
| _Roll_DEC | 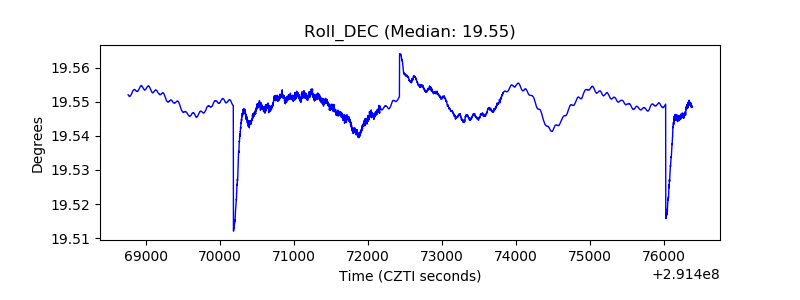 |
| _Roll_RA | 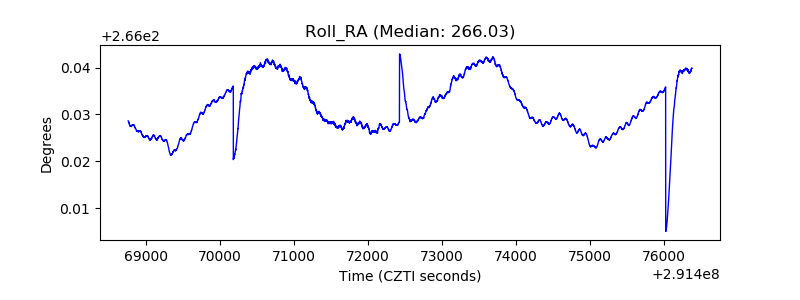 |
| Veto Counter |  |