| Param | Original file | Final file |
|---|---|---|
| Filename | modeM0/AS1A05_163T01_9000002820_18908cztM0_level2.evt | modeM0/AS1A05_163T01_9000002820_18908cztM0_level2_quad_clean.evt |
| Size (bytes) | 855,449,280 | 75,977,280 |
| Size | 815.8 MB | 72.5 MB |
| Events in quadrant A | 11,288,274 | 322,809 |
| Events in quadrant B | 6,099,041 | 481,622 |
| Events in quadrant C | 3,906,281 | 484,769 |
| Events in quadrant D | 4,094,289 | 476,052 |
| Mode M0 | |||
|---|---|---|---|
| Quadrant | BADHDUFLAG | Total packets | Discarded packets |
| A | 0 | 38750 | 2 |
| B | 0 | 23131 | 2 |
| C | 0 | 16248 | 2 |
| D | 0 | 17314 | 2 |
| Mode SS | |||
|---|---|---|---|
| Quadrant | BADHDUFLAG | Total packets | Discarded packets |
| A | 0 | 154 | 0 |
| B | 0 | 154 | 0 |
| C | 0 | 154 | 0 |
| D | 0 | 154 | 0 |
| Mode M9 | |||
|---|---|---|---|
| Quadrant | BADHDUFLAG | Total packets | Discarded packets |
| A | 0 | 3 | 0 |
| B | 0 | 4 | 0 |
| C | 0 | 4 | 0 |
| D | 0 | 4 | 0 |
| Quadrant | Total seconds | Saturated seconds | Saturation percentage |
|---|---|---|---|
| A | 7687 | 3424 | 44.542734% |
| B | 7686 | 886 | 11.527453% |
| C | 7686 | 149 | 1.938590% |
| D | 7686 | 115 | 1.496227% |
Noise dominated data is calculated using 1-second bins in cleaned event files. If a bin has >2000 counts, and if more than 50% of those come from <1% of pixels, then it is considered to be noise-dominated and hence unusable.
| Quadrant | # 1 sec bins | Bins with >0 counts | Bins with >2000 counts | High rate bins dominated by noise | Noise dominated (total time) | Noise dominated (detector-on time) | Marked lightcurve |
|---|---|---|---|---|---|---|---|
| A | 7887 | 7688 | 2386 | 2386 | 30.25% | 31.04% | 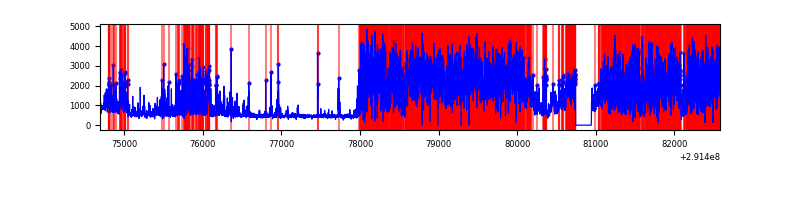 |
| B | 7886 | 7687 | 514 | 514 | 6.52% | 6.69% | 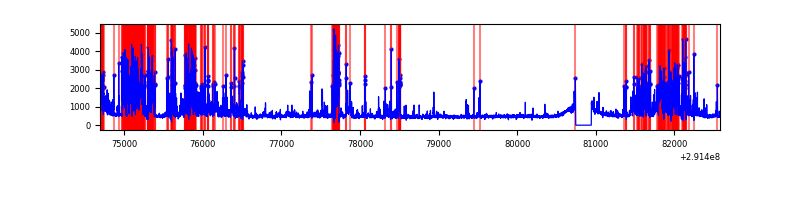 |
| C | 7886 | 7687 | 0 | 0 | 0.00% | 0.00% |  |
| D | 7886 | 7687 | 23 | 23 | 0.29% | 0.30% | 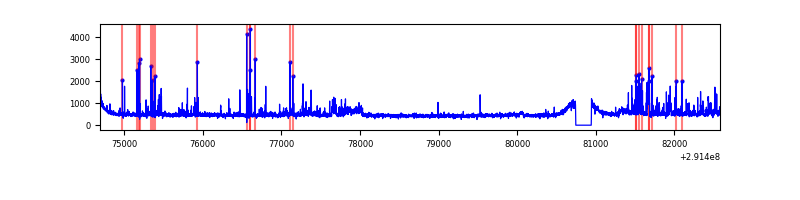 |
Top three noisy pixels from each quadrant. If the there are fewer than three noisy pixels in the level2.evt file, extra rows are filled as -1
| Pixel properties | Quadrant properties | ||||||
|---|---|---|---|---|---|---|---|
| Quadrant | DetID | PixID | Counts | Sigma | Mean | Median | Sigma |
| A | 14 | 235 | 8366284 | 55758.04 | 737 | 722 | 150.0 |
| A | 15 | 174 | 61122 | 402.57 | 737 | 722 | 150.0 |
| A | 5 | 247 | 13013 | 81.92 | 737 | 722 | 150.0 |
| B | 3 | 112 | 2049915 | 11608.96 | 907 | 883 | 176.5 |
| B | 7 | 220 | 331552 | 1873.43 | 907 | 883 | 176.5 |
| B | 4 | 216 | 80206 | 449.41 | 907 | 883 | 176.5 |
| C | 14 | 238 | 138327 | 637.18 | 914 | 919 | 215.7 |
| C | 3 | 233 | 119149 | 548.25 | 914 | 919 | 215.7 |
| C | 9 | 15 | 65271 | 298.41 | 914 | 919 | 215.7 |
| D | 7 | 238 | 202735 | 882.36 | 930 | 900 | 228.7 |
| D | 1 | 52 | 146137 | 634.93 | 930 | 900 | 228.7 |
| D | 12 | 110 | 72632 | 313.59 | 930 | 900 | 228.7 |
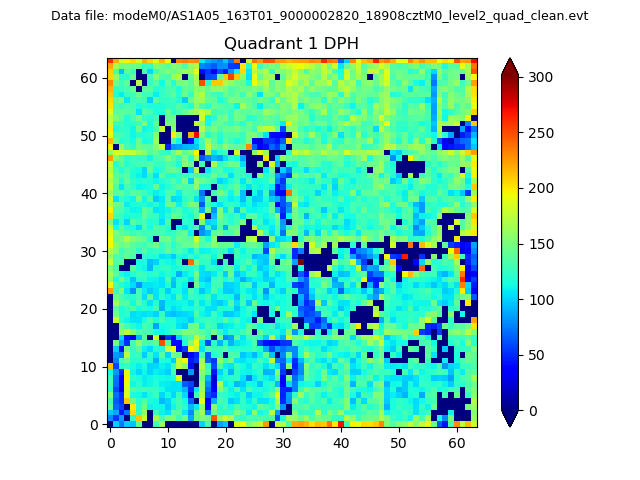
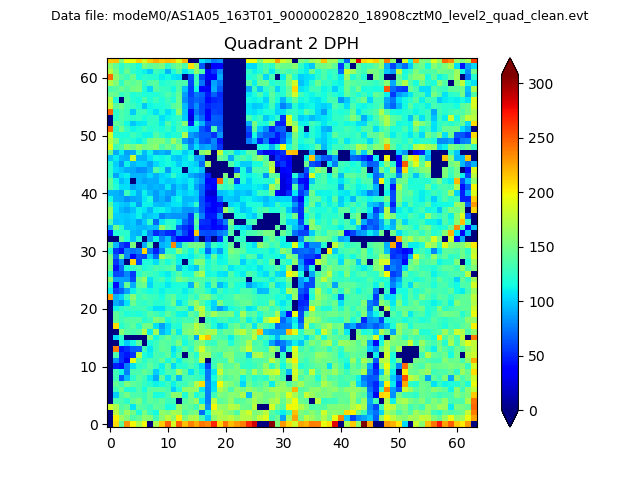
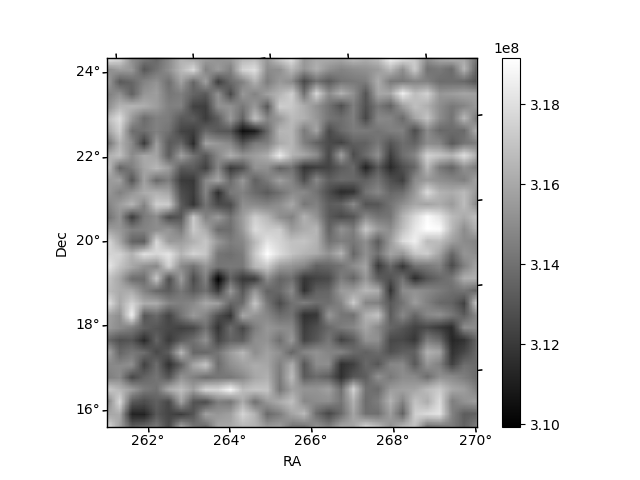
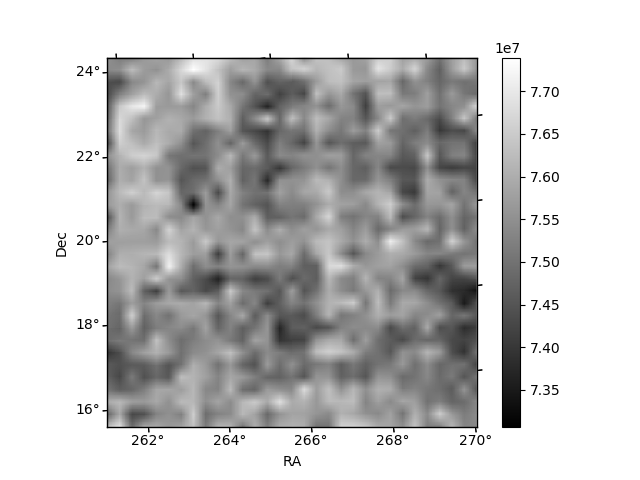
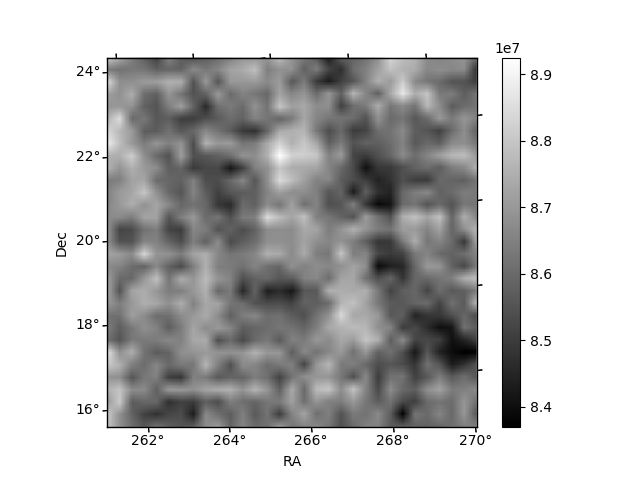
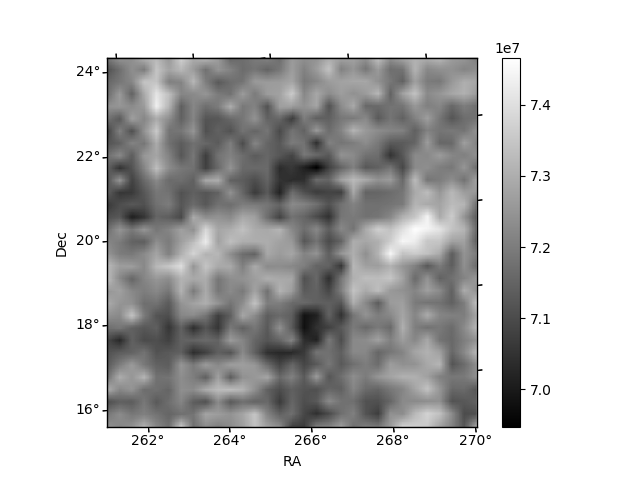
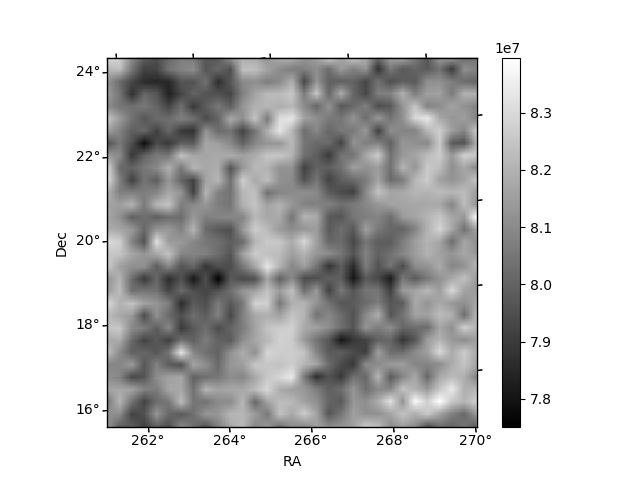
Histogram calculated using DETX and DETY for each event in the final _common_clean file
| Quadrant A | 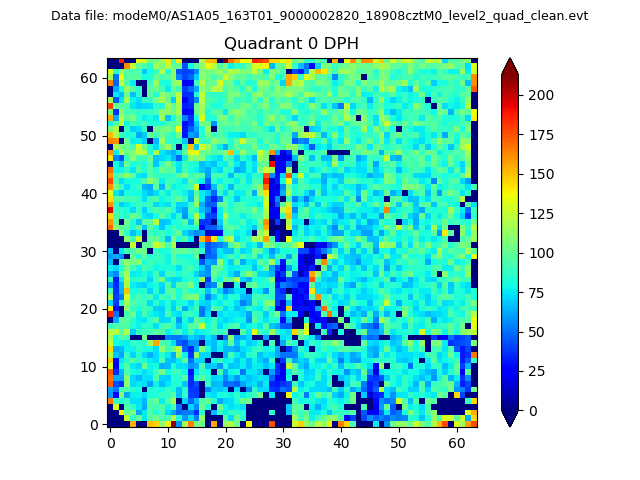 |
 |
Quadrant B |
|---|---|---|---|
| Quadrant D | 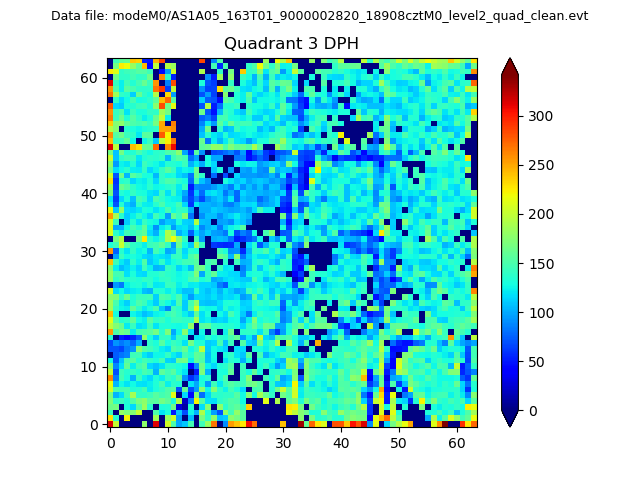 |
 |
Quadrant C |
| Plot type | Count rate plots | Images |
|---|---|---|
| Comparison with Poisson distribution Blue bars denote a histogram of data divided into 1 sec bins. Red curve is a Poisson curve with rate = median count rate of data. |
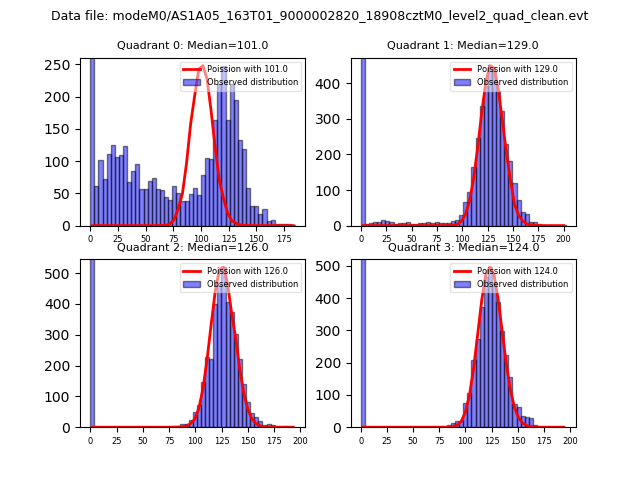 |
 |
| Quadrant-wise count rates Data is divided into 100 sec bins |
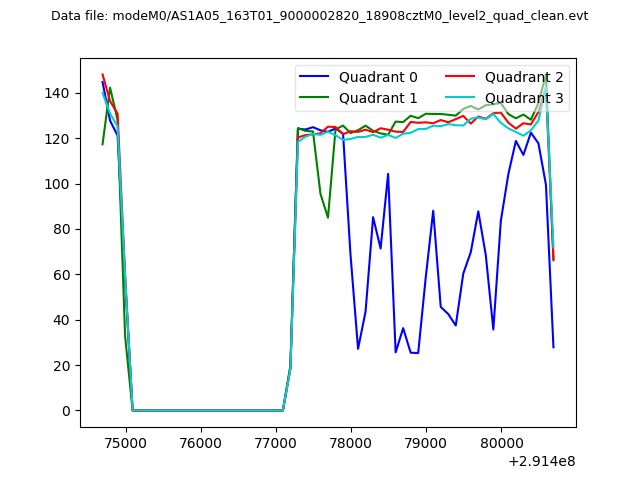 |
|
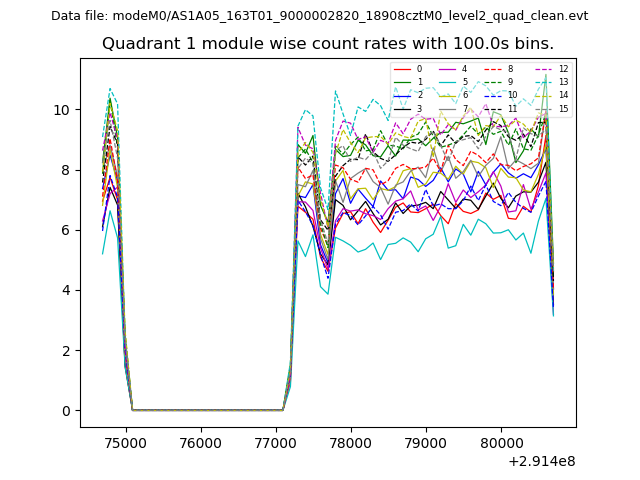
| Module-wise count rates for Quadrant A Data is divided into 100 sec bins |
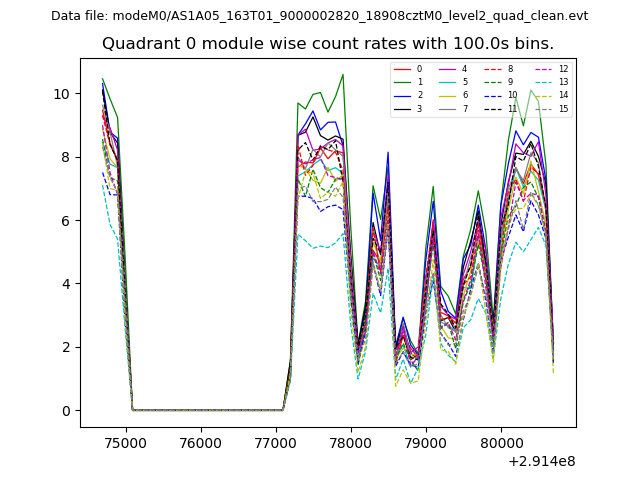 |
 |
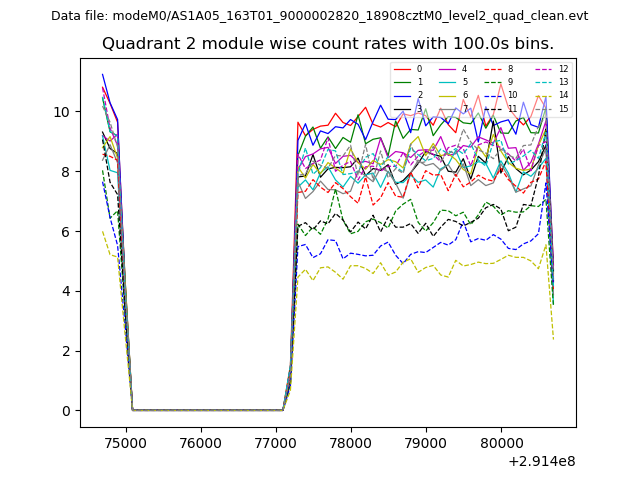
| Module-wise count rates for Quadrant B Data is divided into 100 sec bins |
 |
 |
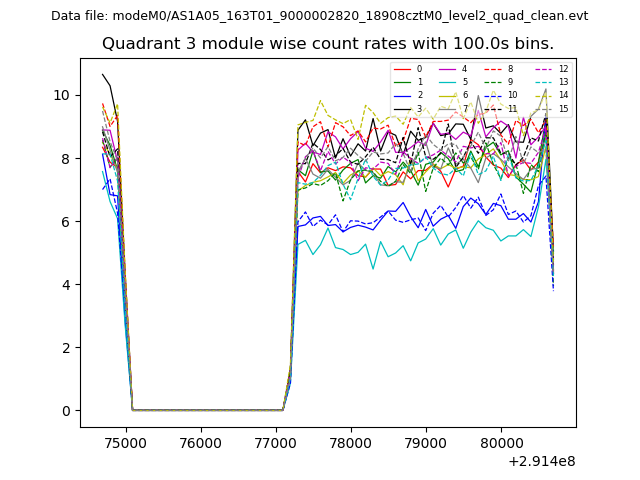
| Module-wise count rates for Quadrant C Data is divided into 100 sec bins |
 |
 |
| Module-wise count rates for Quadrant D Data is divided into 100 sec bins |
 |
 |
| Parameter | Plot |
|---|---|
| CZT HV Monitor | 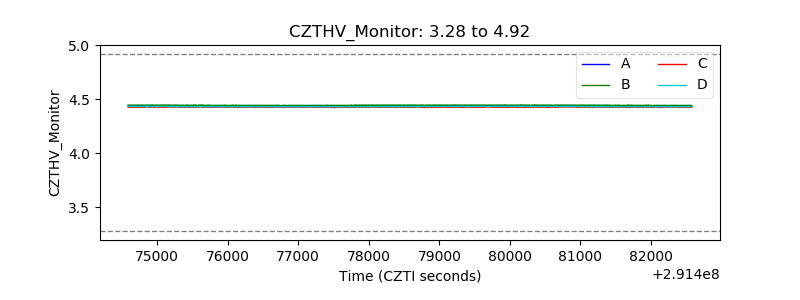 |
| D_VDD | 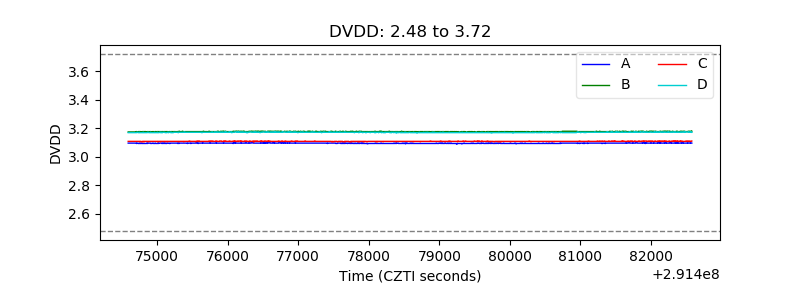 |
| Temperature 1 | 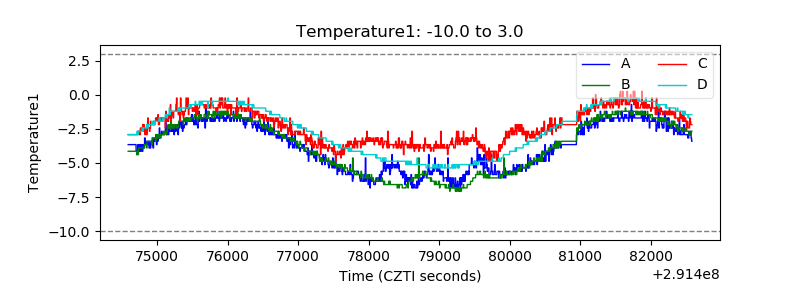 |
| Veto HV Monitor | 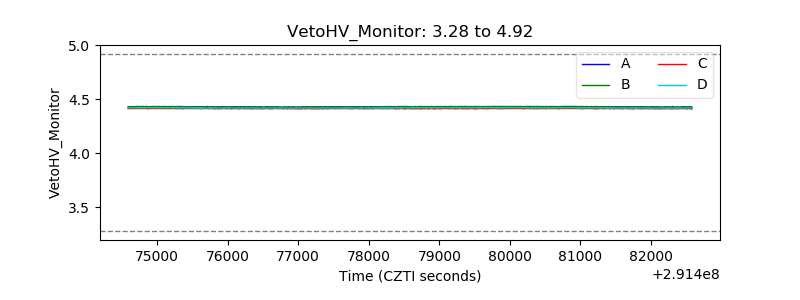 |
| Veto LLD | 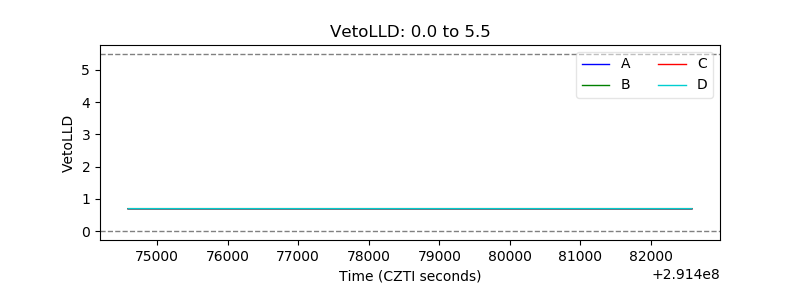 |
| Alpha Counter | 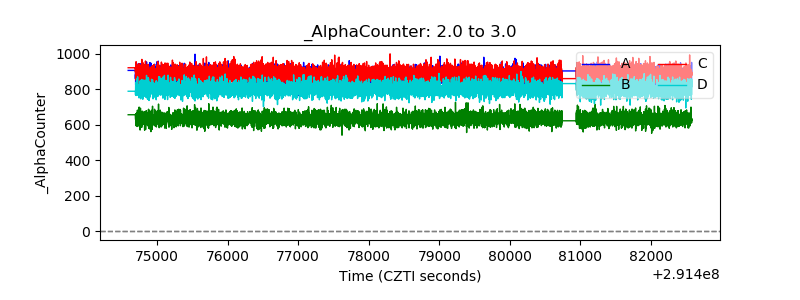 |
| _CPM_Rate | 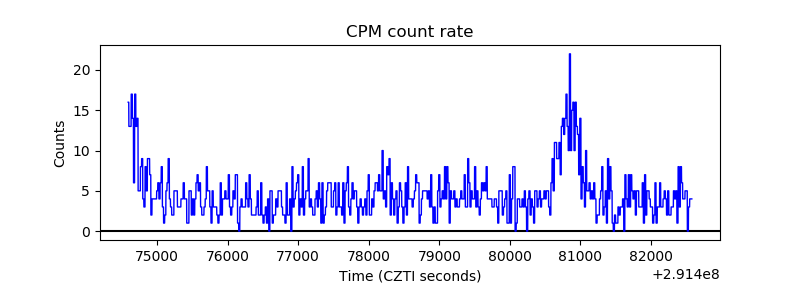 |
| CZT Counter | 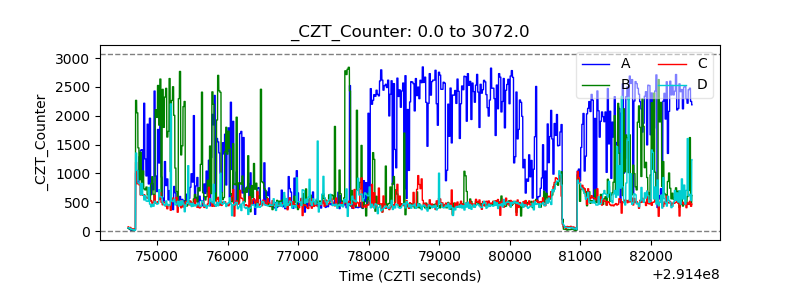 |
| +2.5 Volts monitor |  |
| +5 Volts monitor | 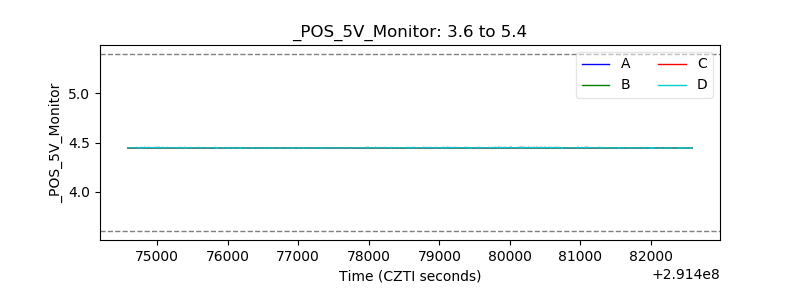 |
| _ROLL_ROT |  |
| _Roll_DEC | 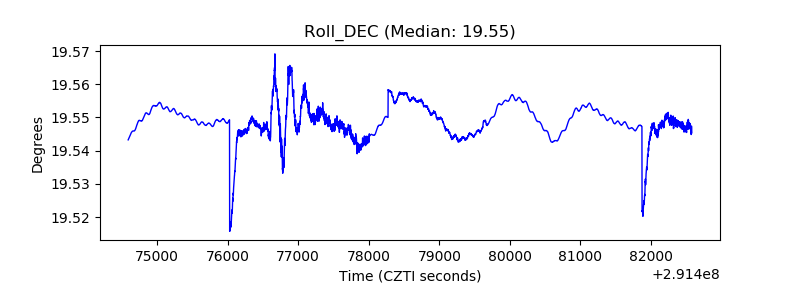 |
| _Roll_RA | 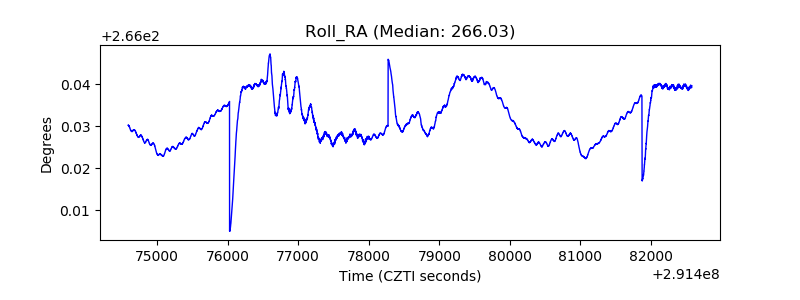 |
| Veto Counter | 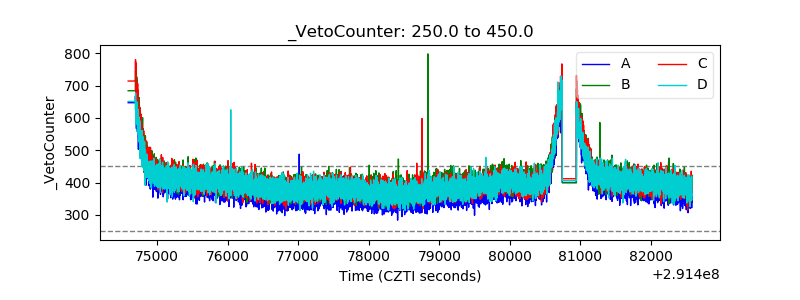 |