| Param | Original file | Final file |
|---|---|---|
| Filename | modeM0/AS1A05_163T01_9000002820_18909cztM0_level2.evt | modeM0/AS1A05_163T01_9000002820_18909cztM0_level2_quad_clean.evt |
| Size (bytes) | 1,064,036,160 | 67,749,120 |
| Size | 1014.7 MB | 64.6 MB |
| Events in quadrant A | 14,807,855 | 226,456 |
| Events in quadrant B | 8,079,396 | 406,279 |
| Events in quadrant C | 3,762,378 | 447,496 |
| Events in quadrant D | 5,057,657 | 435,941 |
| Mode M0 | |||
|---|---|---|---|
| Quadrant | BADHDUFLAG | Total packets | Discarded packets |
| A | 0 | 49235 | 3 |
| B | 0 | 29211 | 3 |
| C | 0 | 15857 | 3 |
| D | 0 | 20176 | 3 |
| Mode SS | |||
|---|---|---|---|
| Quadrant | BADHDUFLAG | Total packets | Discarded packets |
| A | 0 | 156 | 0 |
| B | 0 | 156 | 0 |
| C | 0 | 156 | 0 |
| D | 0 | 156 | 0 |
| Mode M9 | |||
|---|---|---|---|
| Quadrant | BADHDUFLAG | Total packets | Discarded packets |
| A | 0 | 3 | 0 |
| B | 0 | 4 | 0 |
| C | 0 | 4 | 0 |
| D | 0 | 4 | 0 |
| Quadrant | Total seconds | Saturated seconds | Saturation percentage |
|---|---|---|---|
| A | 7666 | 5369 | 70.036525% |
| B | 7666 | 1673 | 21.823637% |
| C | 7666 | 144 | 1.878424% |
| D | 7666 | 264 | 3.443778% |
Noise dominated data is calculated using 1-second bins in cleaned event files. If a bin has >2000 counts, and if more than 50% of those come from <1% of pixels, then it is considered to be noise-dominated and hence unusable.
| Quadrant | # 1 sec bins | Bins with >0 counts | Bins with >2000 counts | High rate bins dominated by noise | Noise dominated (total time) | Noise dominated (detector-on time) | Marked lightcurve |
|---|---|---|---|---|---|---|---|
| A | 7976 | 7663 | 3904 | 3904 | 48.95% | 50.95% | 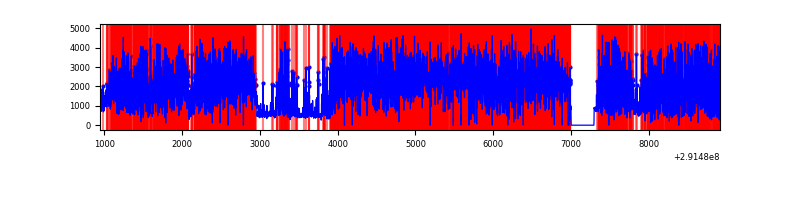 |
| B | 7976 | 7668 | 979 | 979 | 12.27% | 12.77% | 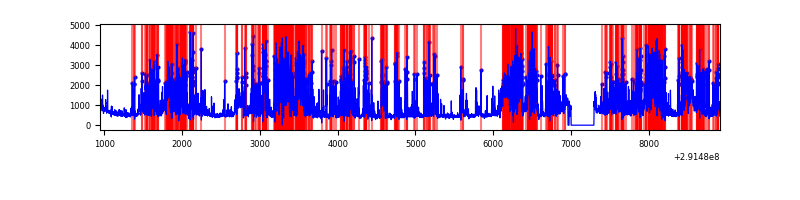 |
| C | 7976 | 7668 | 0 | 0 | 0.00% | 0.00% | 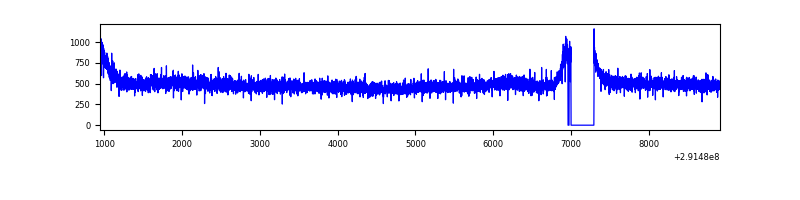 |
| D | 7976 | 7668 | 114 | 114 | 1.43% | 1.49% | 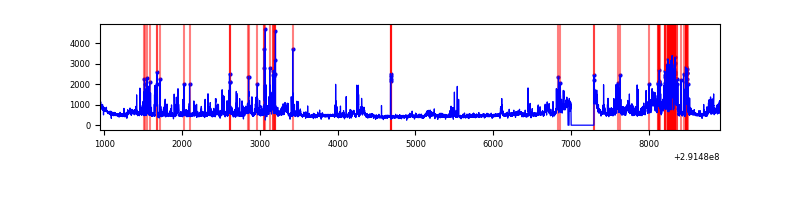 |
Top three noisy pixels from each quadrant. If the there are fewer than three noisy pixels in the level2.evt file, extra rows are filled as -1
| Pixel properties | Quadrant properties | ||||||
|---|---|---|---|---|---|---|---|
| Quadrant | DetID | PixID | Counts | Sigma | Mean | Median | Sigma |
| A | 14 | 235 | 12573405 | 108620.54 | 569 | 557 | 115.8 |
| A | 15 | 174 | 24128 | 203.64 | 569 | 557 | 115.8 |
| A | 5 | 247 | 12873 | 106.4 | 569 | 557 | 115.8 |
| B | 3 | 112 | 3892902 | 23197.18 | 863 | 840 | 167.8 |
| B | 7 | 220 | 636665 | 3789.6 | 863 | 840 | 167.8 |
| B | 0 | 189 | 57970 | 340.5 | 863 | 840 | 167.8 |
| C | 14 | 238 | 138498 | 646.74 | 906 | 909 | 212.7 |
| C | 3 | 233 | 88442 | 411.45 | 906 | 909 | 212.7 |
| C | 13 | 61 | 6547 | 26.5 | 906 | 909 | 212.7 |
| D | 7 | 238 | 590919 | 2619.98 | 915 | 887 | 225.2 |
| D | 12 | 233 | 342180 | 1515.48 | 915 | 887 | 225.2 |
| D | 12 | 110 | 334345 | 1480.69 | 915 | 887 | 225.2 |
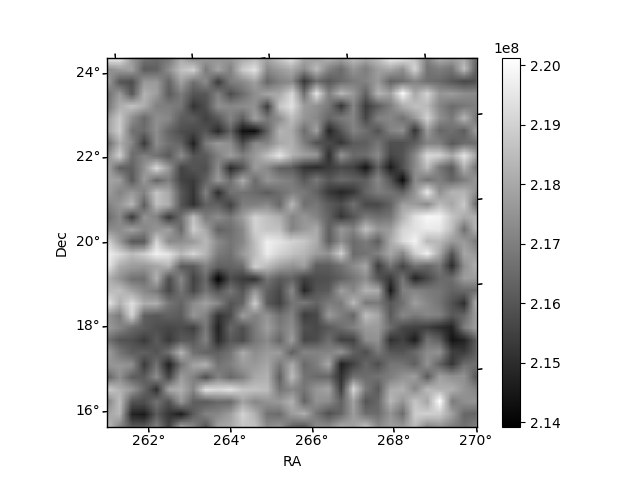
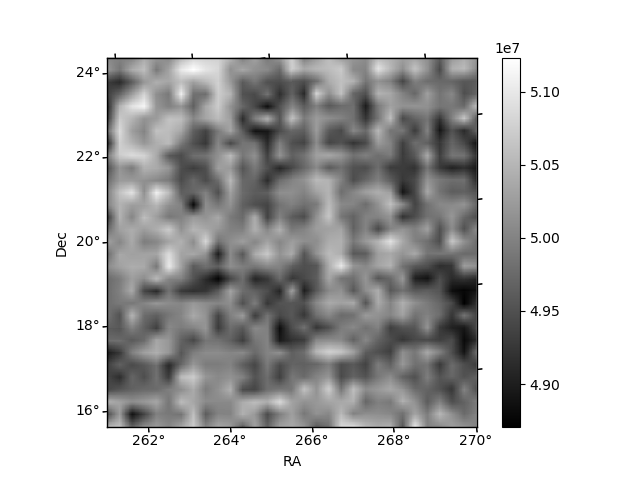
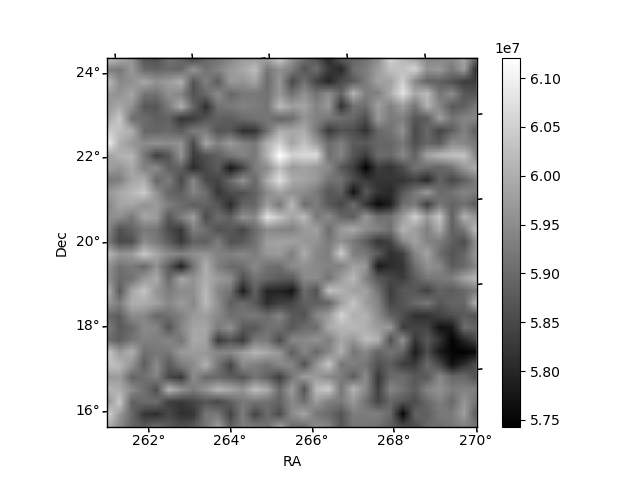
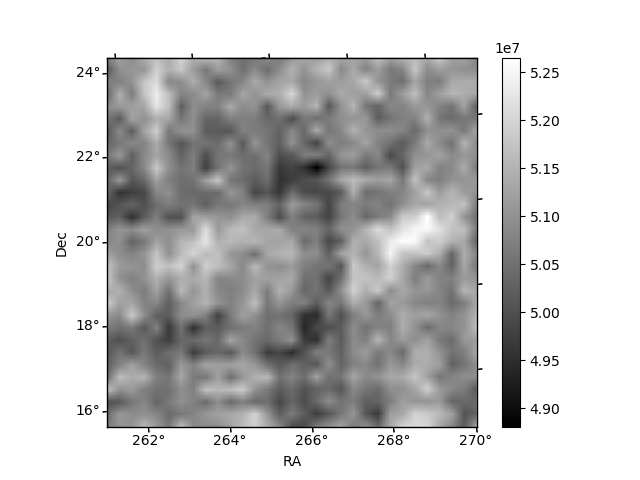
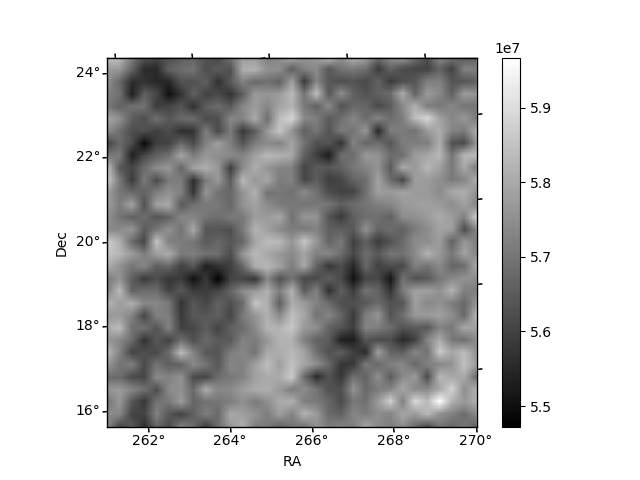
Histogram calculated using DETX and DETY for each event in the final _common_clean file
| Quadrant A | 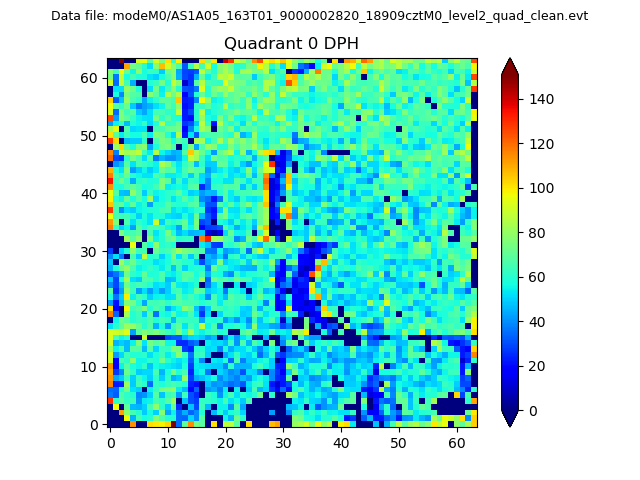 |
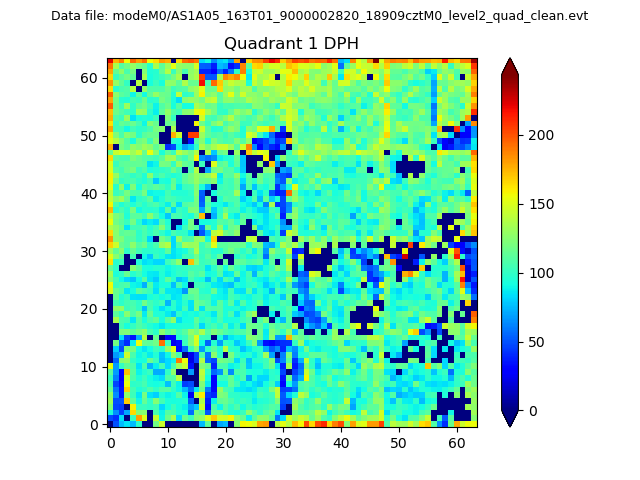 |
Quadrant B |
|---|---|---|---|
| Quadrant D | 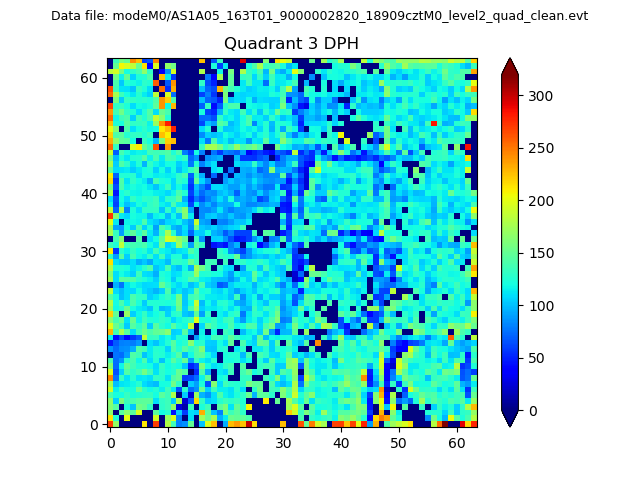 |
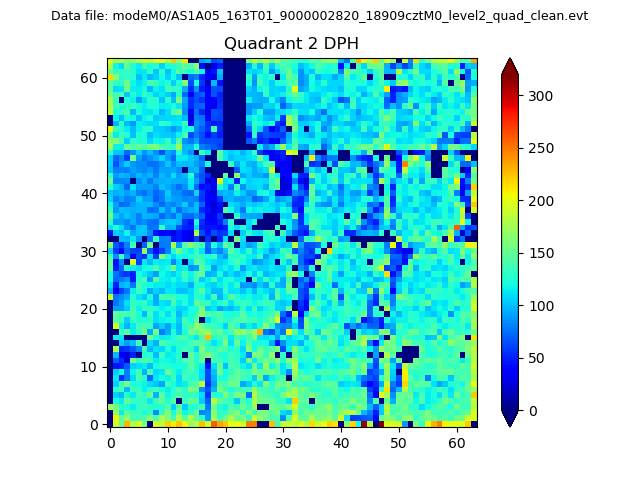 |
Quadrant C |
| Plot type | Count rate plots | Images |
|---|---|---|
| Comparison with Poisson distribution Blue bars denote a histogram of data divided into 1 sec bins. Red curve is a Poisson curve with rate = median count rate of data. |
 |
 |
| Quadrant-wise count rates Data is divided into 100 sec bins |
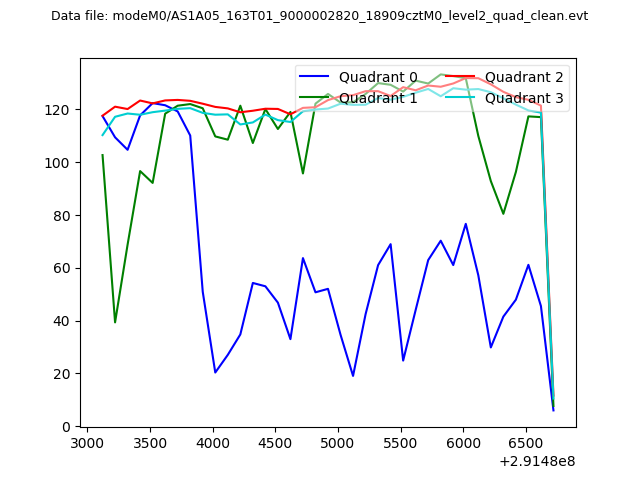 |
|
| Module-wise count rates for Quadrant A Data is divided into 100 sec bins |
 |
 |
| Module-wise count rates for Quadrant B Data is divided into 100 sec bins |
 |
 |
| Module-wise count rates for Quadrant C Data is divided into 100 sec bins |
 |
 |
| Module-wise count rates for Quadrant D Data is divided into 100 sec bins |
 |
 |
| Parameter | Plot |
|---|---|
| CZT HV Monitor |  |
| D_VDD | 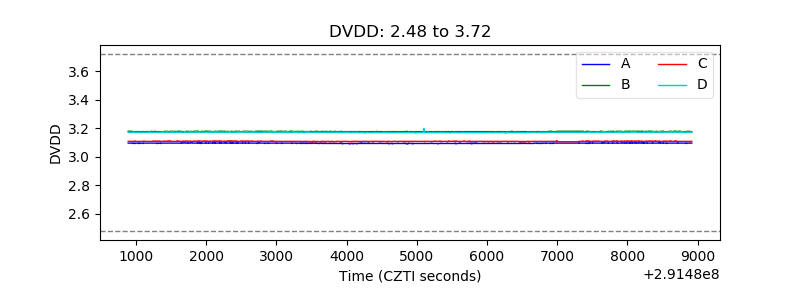 |
| Temperature 1 | 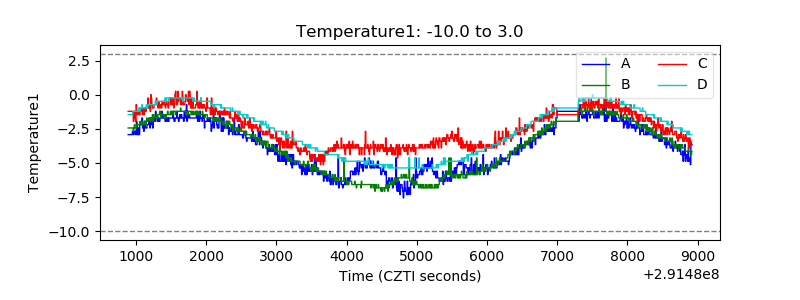 |
| Veto HV Monitor | 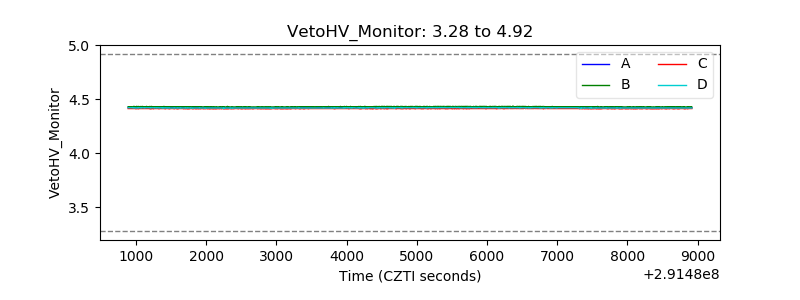 |
| Veto LLD | 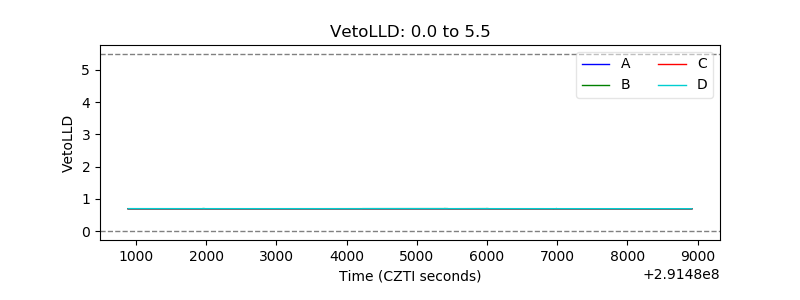 |
| Alpha Counter | 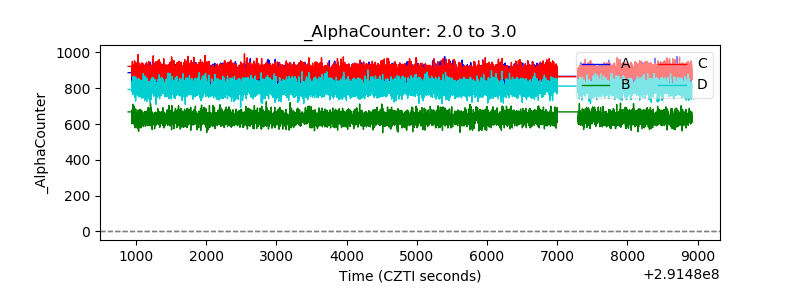 |
| _CPM_Rate | 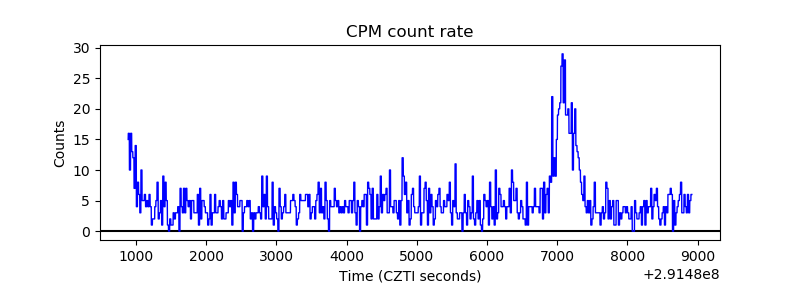 |
| CZT Counter | 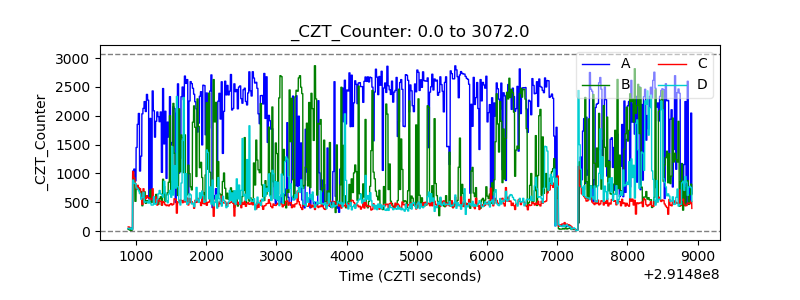 |
| +2.5 Volts monitor |  |
| +5 Volts monitor | 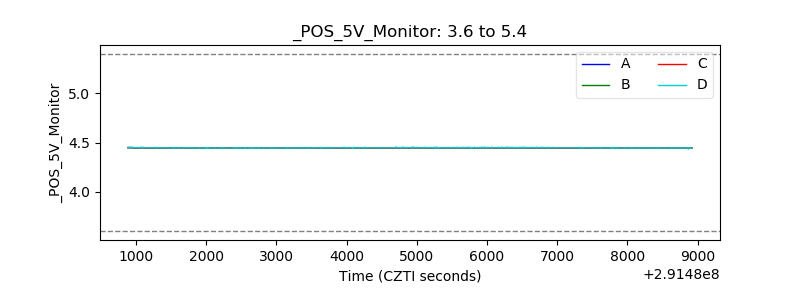 |
| _ROLL_ROT |  |
| _Roll_DEC | 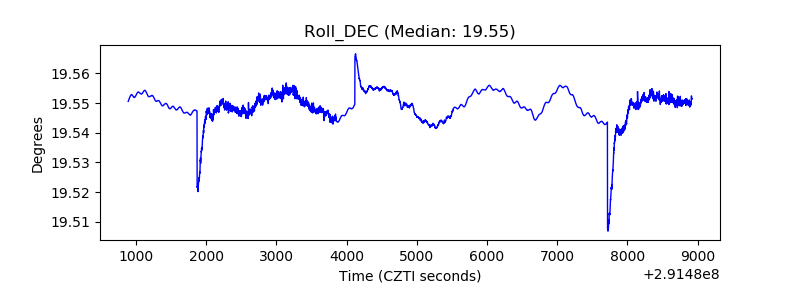 |
| _Roll_RA | 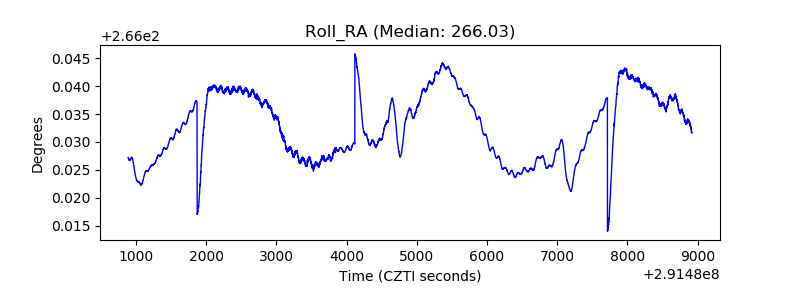 |
| Veto Counter |  |