| Param | Original file | Final file |
|---|---|---|
| Filename | modeM0/AS1A05_163T01_9000002820_18911cztM0_level2.evt | modeM0/AS1A05_163T01_9000002820_18911cztM0_level2_quad_clean.evt |
| Size (bytes) | 229,144,320 | 15,321,600 |
| Size | 218.5 MB | 14.6 MB |
| Events in quadrant A | 2,873,485 | 68,904 |
| Events in quadrant B | 1,835,464 | 87,867 |
| Events in quadrant C | 820,464 | 91,563 |
| Events in quadrant D | 1,292,452 | 89,783 |
| Mode M0 | |||
|---|---|---|---|
| Quadrant | BADHDUFLAG | Total packets | Discarded packets |
| A | 0 | 9723 | 2 |
| B | 0 | 6587 | 0 |
| C | 0 | 3469 | 0 |
| D | 0 | 4953 | 0 |
| Mode SS | |||
|---|---|---|---|
| Quadrant | BADHDUFLAG | Total packets | Discarded packets |
| A | 0 | 34 | 0 |
| B | 0 | 34 | 0 |
| C | 0 | 34 | 0 |
| D | 0 | 34 | 0 |
| Quadrant | Total seconds | Saturated seconds | Saturation percentage |
|---|---|---|---|
| A | 1703 | 949 | 55.725191% |
| B | 1703 | 355 | 20.845567% |
| C | 1703 | 7 | 0.411039% |
| D | 1704 | 103 | 6.044601% |
Noise dominated data is calculated using 1-second bins in cleaned event files. If a bin has >2000 counts, and if more than 50% of those come from <1% of pixels, then it is considered to be noise-dominated and hence unusable.
| Quadrant | # 1 sec bins | Bins with >0 counts | Bins with >2000 counts | High rate bins dominated by noise | Noise dominated (total time) | Noise dominated (detector-on time) | Marked lightcurve |
|---|---|---|---|---|---|---|---|
| A | 1703 | 1701 | 650 | 650 | 38.17% | 38.21% | 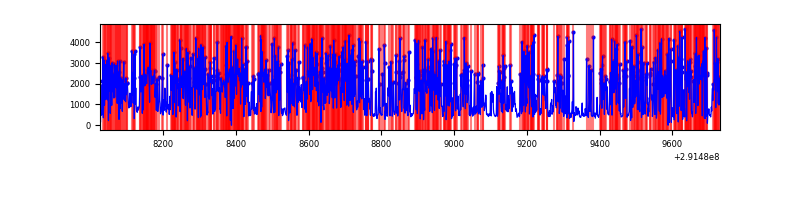 |
| B | 1703 | 1703 | 227 | 227 | 13.33% | 13.33% | 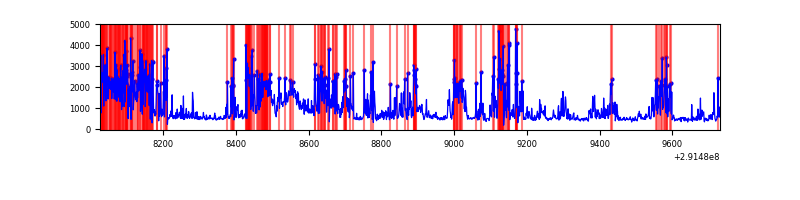 |
| C | 1703 | 1703 | 0 | 0 | 0.00% | 0.00% | 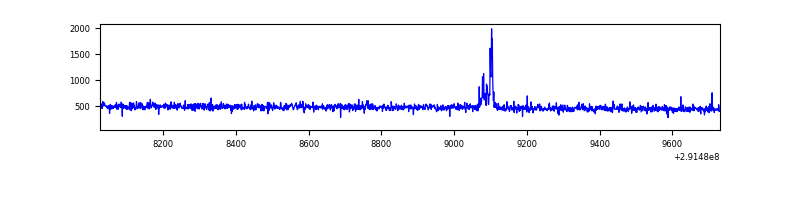 |
| D | 1704 | 1704 | 77 | 77 | 4.52% | 4.52% | 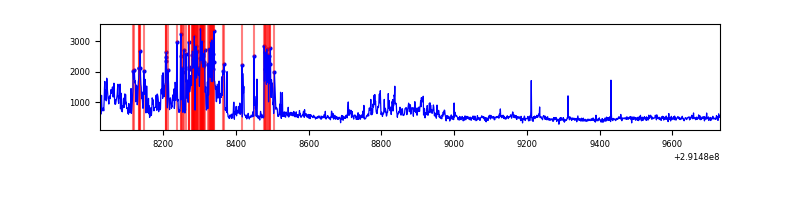 |
Top three noisy pixels from each quadrant. If the there are fewer than three noisy pixels in the level2.evt file, extra rows are filled as -1
| Pixel properties | Quadrant properties | ||||||
|---|---|---|---|---|---|---|---|
| Quadrant | DetID | PixID | Counts | Sigma | Mean | Median | Sigma |
| A | 14 | 235 | 2308825 | 75507.71 | 140 | 137 | 30.6 |
| A | 15 | 174 | 22977 | 747.0 | 140 | 137 | 30.6 |
| A | 13 | 254 | 1913 | 58.09 | 140 | 137 | 30.6 |
| B | 3 | 112 | 1035897 | 27604.27 | 184 | 180 | 37.5 |
| B | 7 | 220 | 27962 | 740.45 | 184 | 180 | 37.5 |
| B | 0 | 182 | 14468 | 380.81 | 184 | 180 | 37.5 |
| C | 14 | 238 | 30404 | 640.77 | 194 | 195 | 47.1 |
| C | 0 | 207 | 17241 | 361.56 | 194 | 195 | 47.1 |
| C | 3 | 233 | 13944 | 291.63 | 194 | 195 | 47.1 |
| D | 7 | 238 | 252377 | 5043.5 | 194 | 188 | 50.0 |
| D | 12 | 233 | 243261 | 4861.19 | 194 | 188 | 50.0 |
| D | 12 | 110 | 27238 | 540.97 | 194 | 188 | 50.0 |
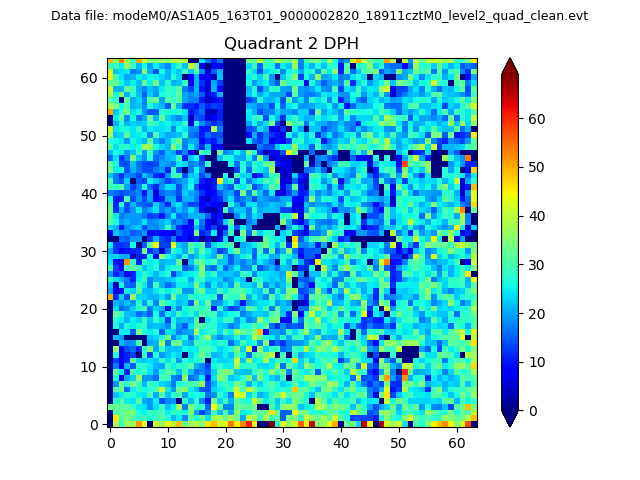
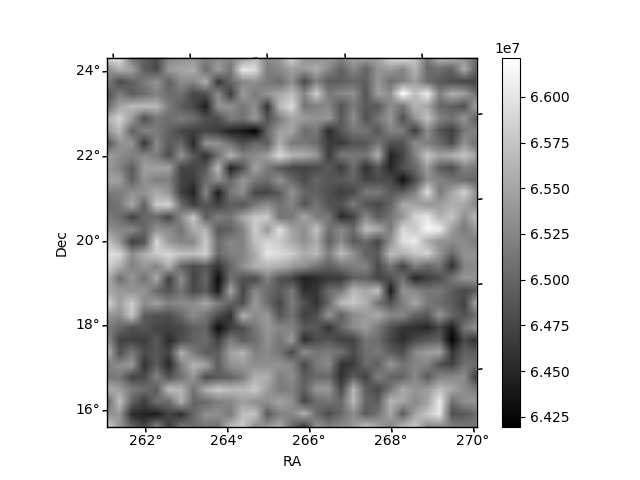
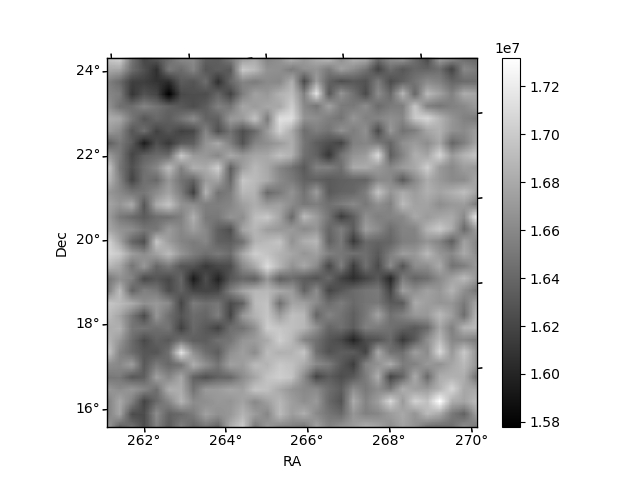
Histogram calculated using DETX and DETY for each event in the final _common_clean file
| Quadrant A | 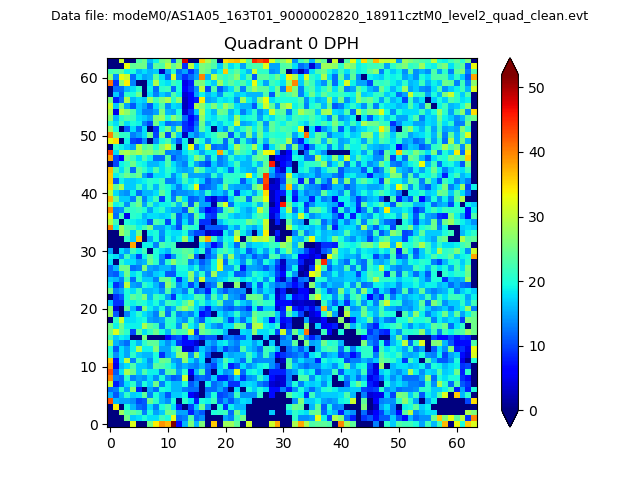 |
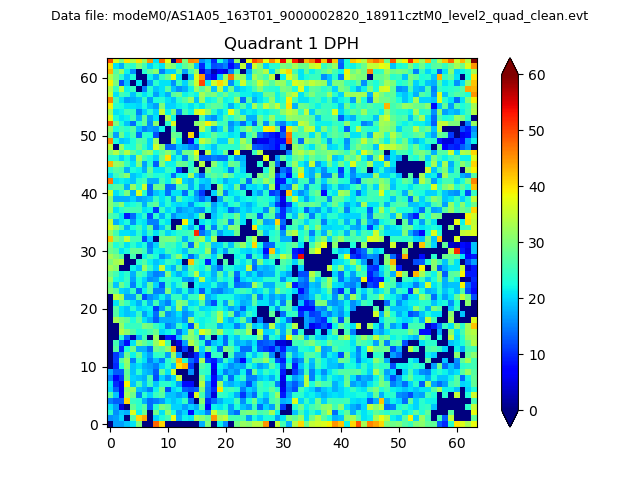 |
Quadrant B |
|---|---|---|---|
| Quadrant D | 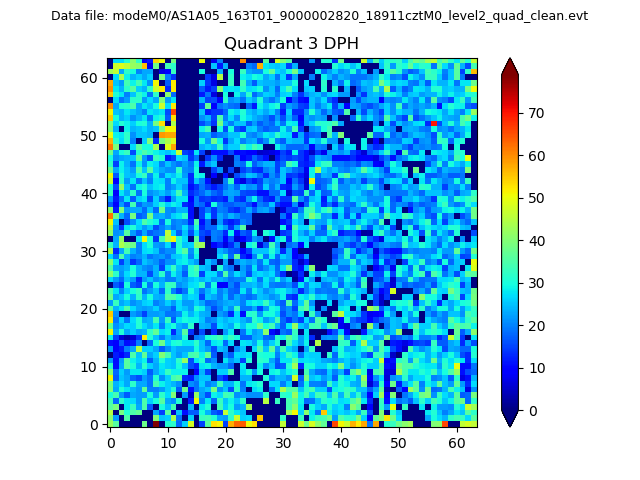 |
 |
Quadrant C |
| Plot type | Count rate plots | Images |
|---|---|---|
| Comparison with Poisson distribution Blue bars denote a histogram of data divided into 1 sec bins. Red curve is a Poisson curve with rate = median count rate of data. |
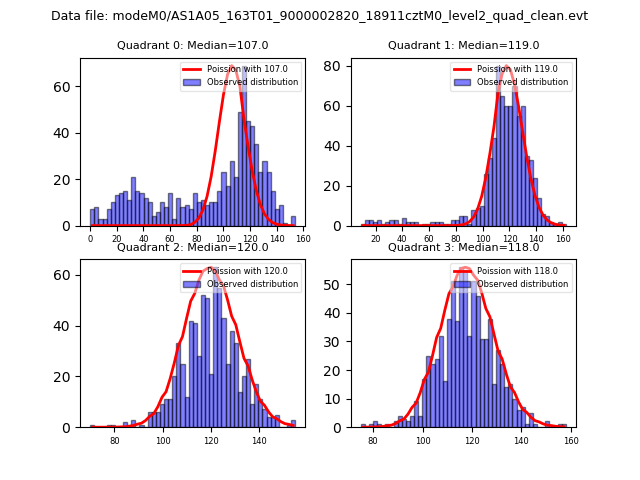 |
 |
| Quadrant-wise count rates Data is divided into 100 sec bins |
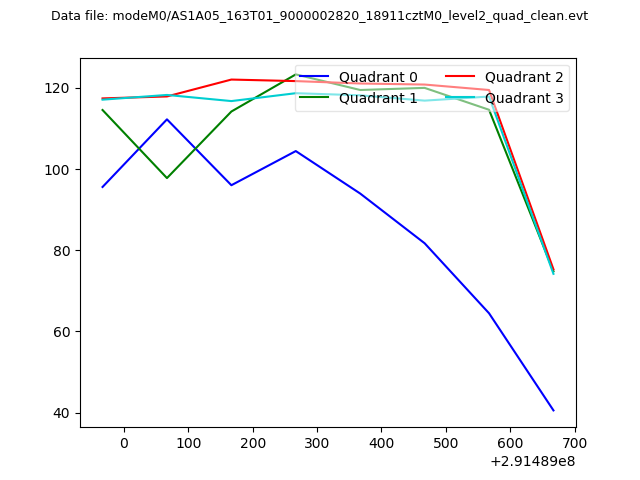 |
|
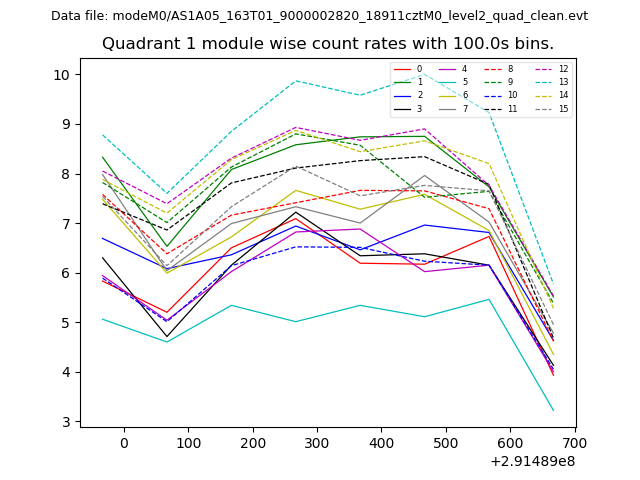
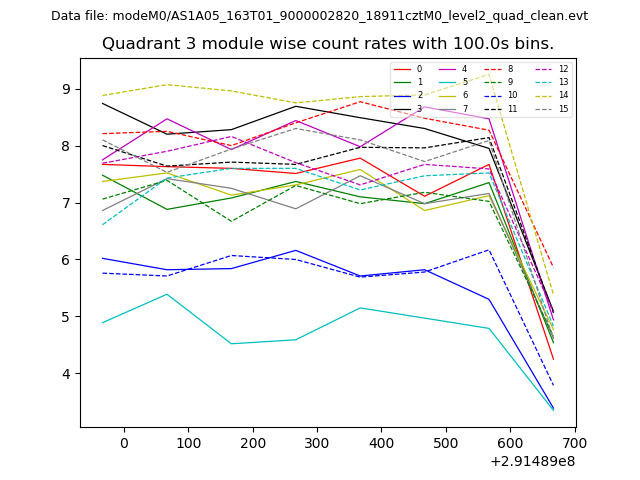
| Module-wise count rates for Quadrant A Data is divided into 100 sec bins |
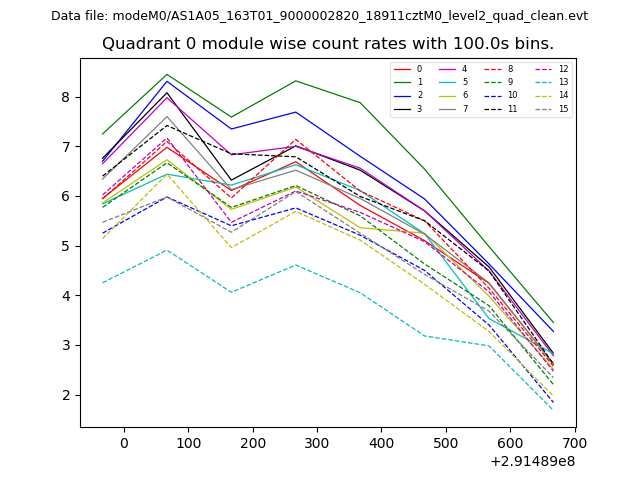 |
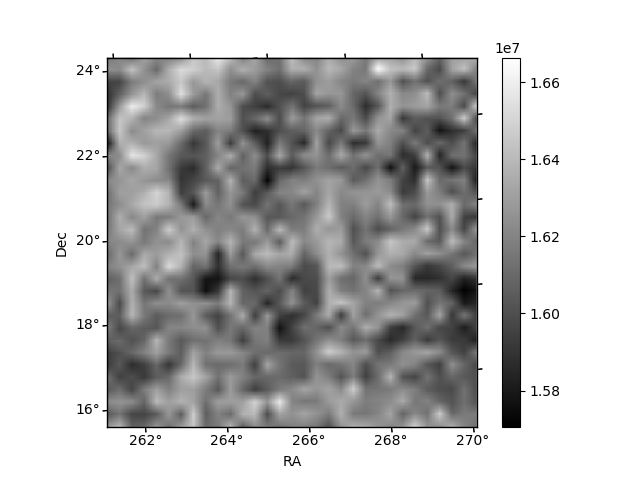 |
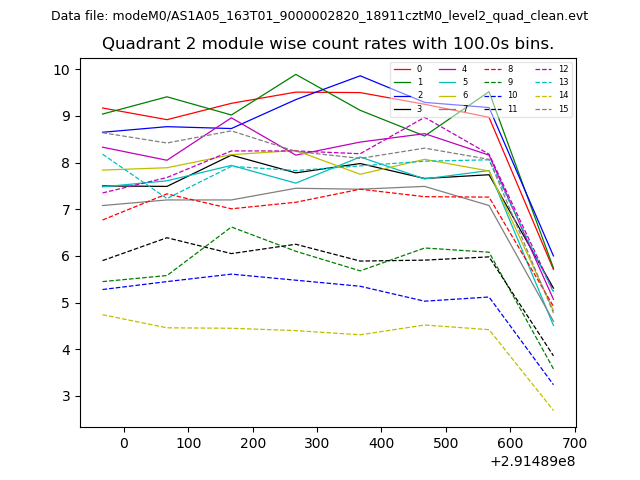
| Module-wise count rates for Quadrant B Data is divided into 100 sec bins |
 |
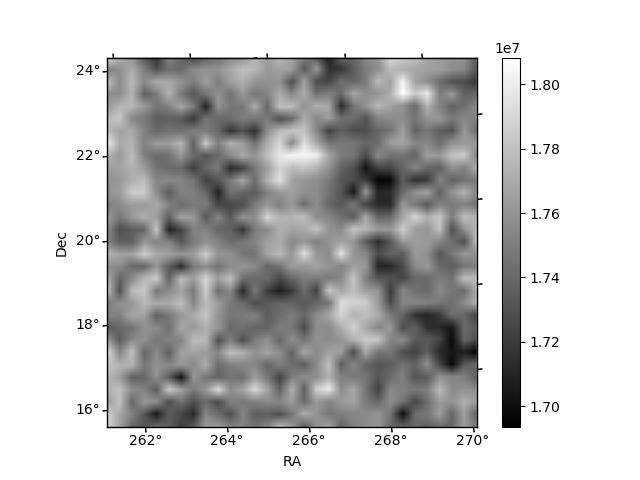 |
| Module-wise count rates for Quadrant C Data is divided into 100 sec bins |
 |
 |
| Module-wise count rates for Quadrant D Data is divided into 100 sec bins |
 |
 |
| Parameter | Plot |
|---|---|
| CZT HV Monitor | 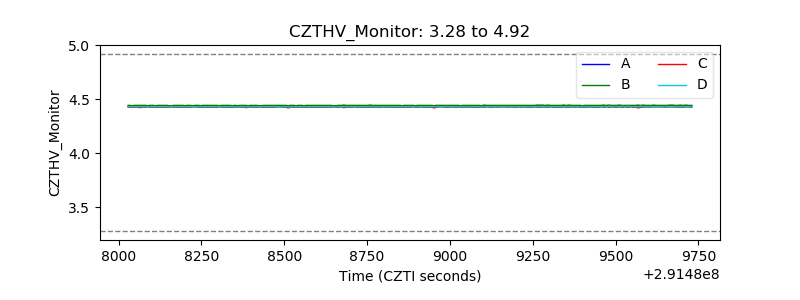 |
| D_VDD | 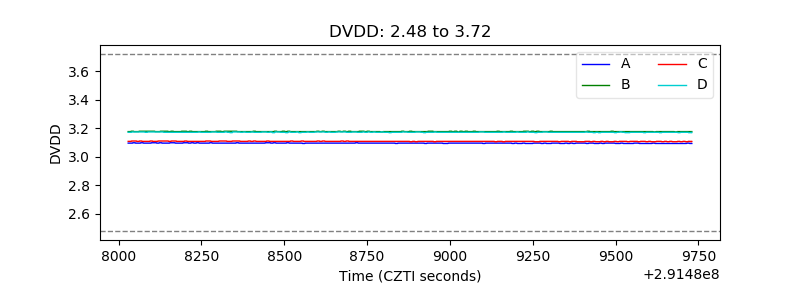 |
| Temperature 1 | 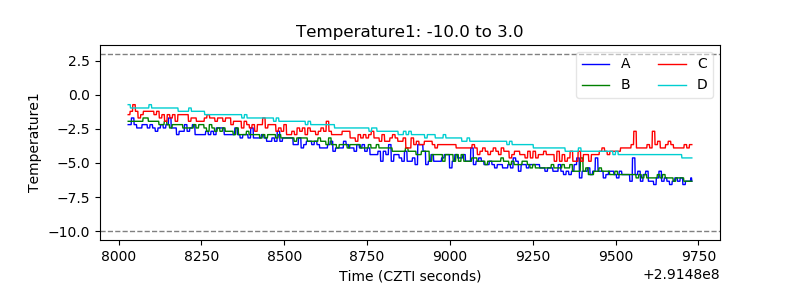 |
| Veto HV Monitor | 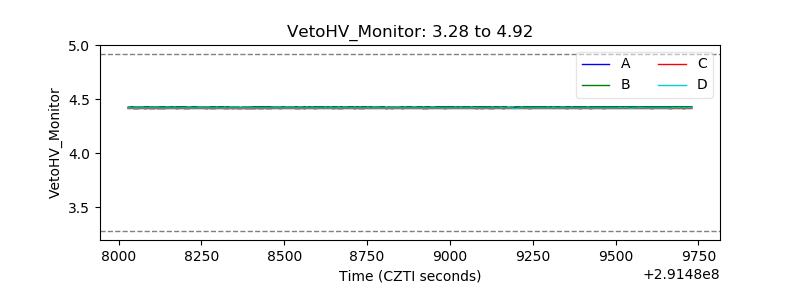 |
| Veto LLD |  |
| Alpha Counter | 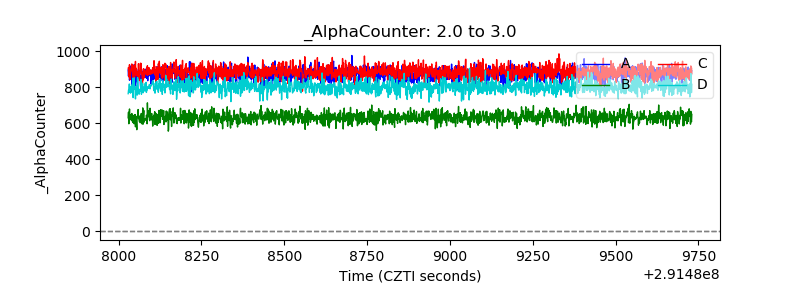 |
| _CPM_Rate | 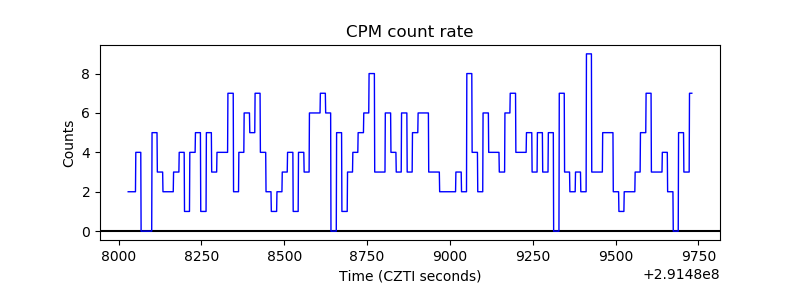 |
| CZT Counter | 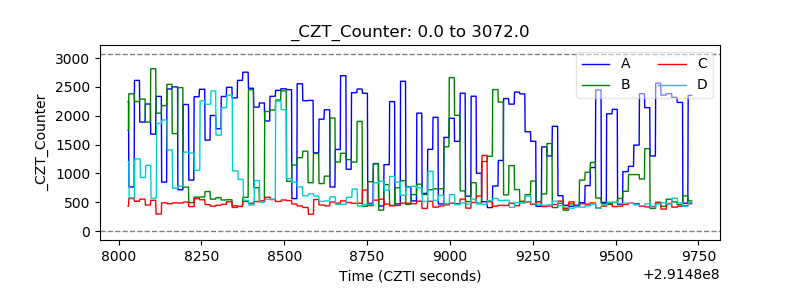 |
| +2.5 Volts monitor |  |
| +5 Volts monitor |  |
| _ROLL_ROT | 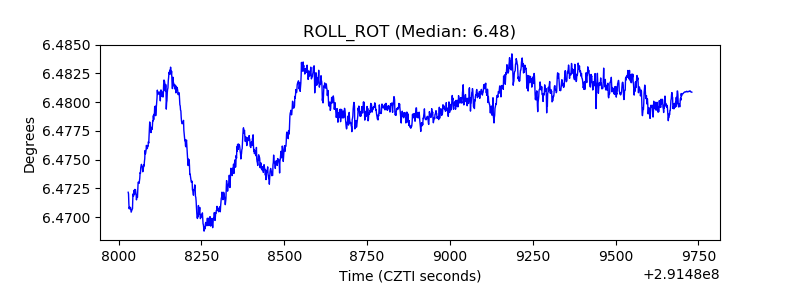 |
| _Roll_DEC | 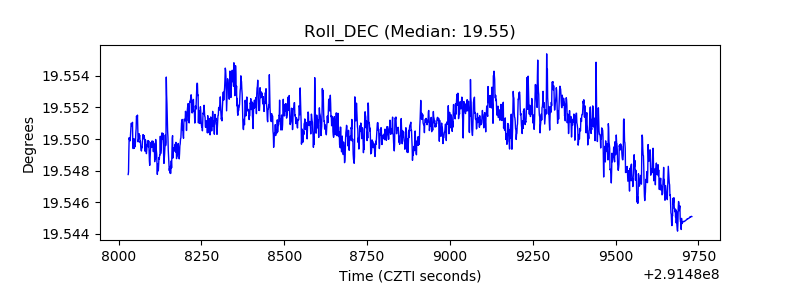 |
| _Roll_RA | 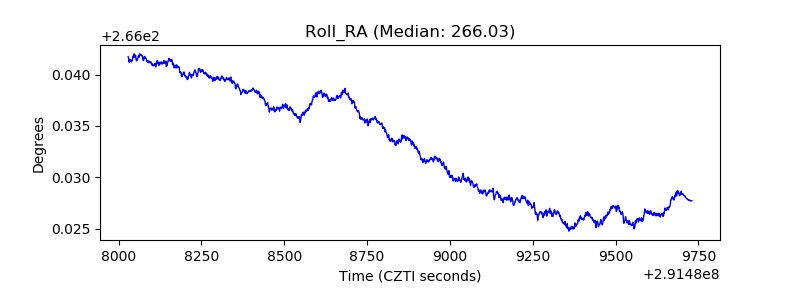 |
| Veto Counter | 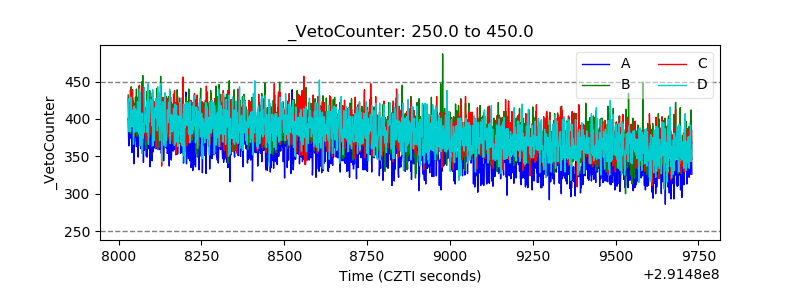 |