| Param | Original file | Final file |
|---|---|---|
| Filename | modeM0/AS1A05_163T01_9000002820_18912cztM0_level2.evt | modeM0/AS1A05_163T01_9000002820_18912cztM0_level2_quad_clean.evt |
| Size (bytes) | 1,903,913,280 | 211,366,080 |
| Size | 1.8 GB | 201.6 MB |
| Events in quadrant A | 28,578,003 | 883,136 |
| Events in quadrant B | 11,503,613 | 1,461,629 |
| Events in quadrant C | 8,004,911 | 1,466,916 |
| Events in quadrant D | 8,450,212 | 1,436,795 |
| Mode M0 | |||
|---|---|---|---|
| Quadrant | BADHDUFLAG | Total packets | Discarded packets |
| A | 0 | 96346 | 3 |
| B | 0 | 45373 | 3 |
| C | 0 | 34285 | 3 |
| D | 0 | 36056 | 3 |
| Mode SS | |||
|---|---|---|---|
| Quadrant | BADHDUFLAG | Total packets | Discarded packets |
| A | 0 | 340 | 0 |
| B | 0 | 340 | 0 |
| C | 0 | 340 | 0 |
| D | 0 | 340 | 0 |
| Mode M9 | |||
|---|---|---|---|
| Quadrant | BADHDUFLAG | Total packets | Discarded packets |
| A | 0 | 20 | 0 |
| B | 0 | 20 | 0 |
| C | 0 | 20 | 0 |
| D | 0 | 20 | 0 |
| Quadrant | Total seconds | Saturated seconds | Saturation percentage |
|---|---|---|---|
| A | 16673 | 9246 | 55.454927% |
| B | 16674 | 1248 | 7.484707% |
| C | 16674 | 168 | 1.007557% |
| D | 16674 | 87 | 0.521770% |
Noise dominated data is calculated using 1-second bins in cleaned event files. If a bin has >2000 counts, and if more than 50% of those come from <1% of pixels, then it is considered to be noise-dominated and hence unusable.
| Quadrant | # 1 sec bins | Bins with >0 counts | Bins with >2000 counts | High rate bins dominated by noise | Noise dominated (total time) | Noise dominated (detector-on time) | Marked lightcurve |
|---|---|---|---|---|---|---|---|
| A | 18738 | 16670 | 6804 | 6804 | 36.31% | 40.82% | 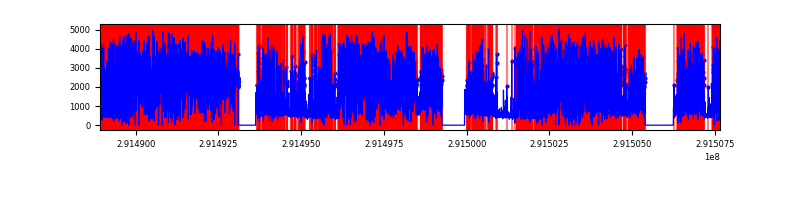 |
| B | 18739 | 16677 | 727 | 727 | 3.88% | 4.36% | 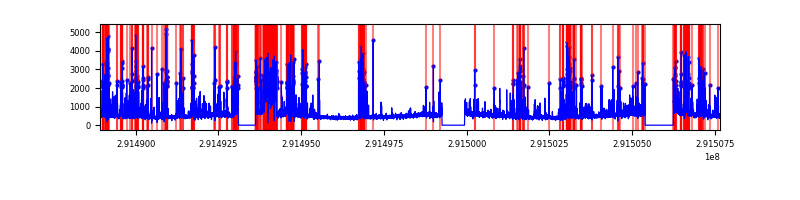 |
| C | 18739 | 16677 | 6 | 6 | 0.03% | 0.04% | 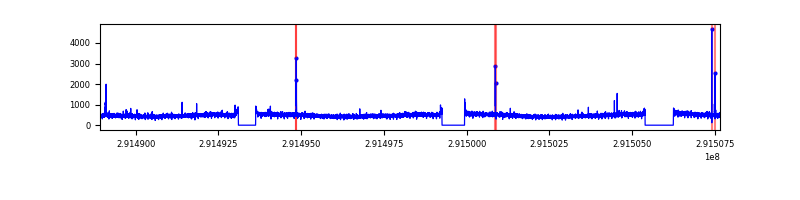 |
| D | 18739 | 16677 | 31 | 31 | 0.17% | 0.19% | 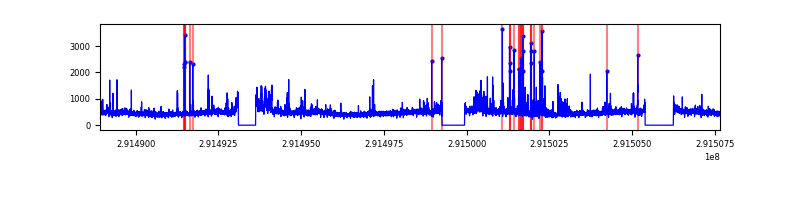 |
Top three noisy pixels from each quadrant. If the there are fewer than three noisy pixels in the level2.evt file, extra rows are filled as -1
| Pixel properties | Quadrant properties | ||||||
|---|---|---|---|---|---|---|---|
| Quadrant | DetID | PixID | Counts | Sigma | Mean | Median | Sigma |
| A | 14 | 235 | 23360705 | 85717.73 | 1347 | 1316 | 272.5 |
| A | 13 | 210 | 18734 | 63.92 | 1347 | 1316 | 272.5 |
| A | 13 | 254 | 17061 | 57.78 | 1347 | 1316 | 272.5 |
| B | 3 | 112 | 3583827 | 9664.88 | 1923 | 1870 | 370.6 |
| B | 0 | 189 | 145379 | 387.22 | 1923 | 1870 | 370.6 |
| B | 7 | 220 | 56301 | 146.87 | 1923 | 1870 | 370.6 |
| C | 14 | 238 | 295997 | 658.49 | 1913 | 1934 | 446.6 |
| C | 3 | 233 | 196662 | 436.05 | 1913 | 1934 | 446.6 |
| C | 0 | 207 | 48869 | 105.1 | 1913 | 1934 | 446.6 |
| D | 12 | 110 | 291683 | 618.66 | 1932 | 1875 | 468.4 |
| D | 7 | 238 | 274749 | 582.51 | 1932 | 1875 | 468.4 |
| D | 14 | 34 | 180370 | 381.04 | 1932 | 1875 | 468.4 |
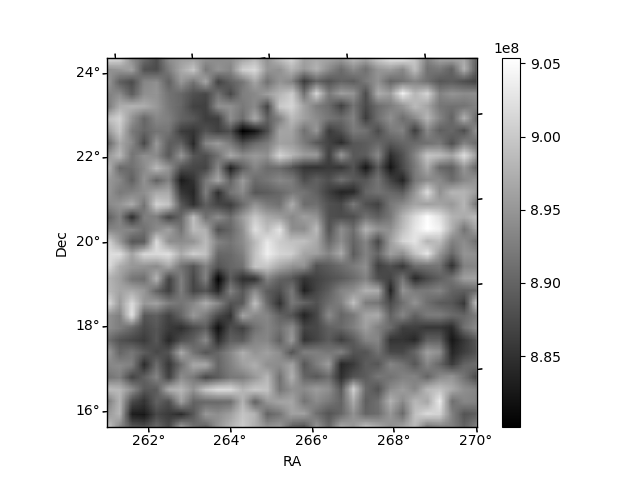
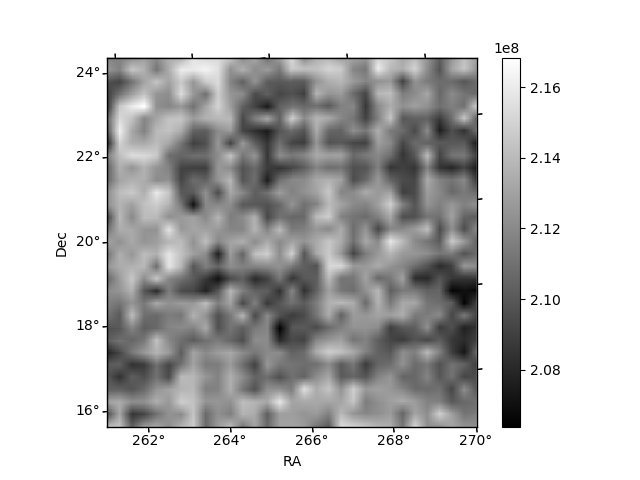
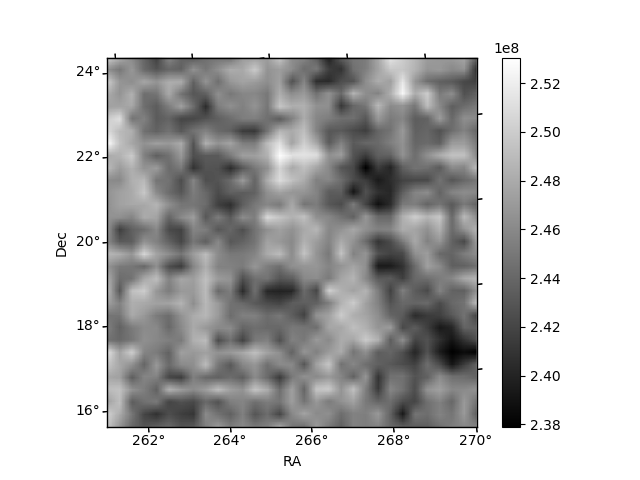
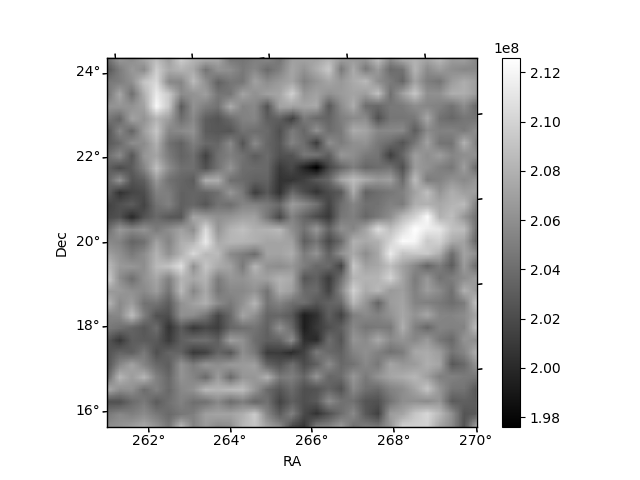
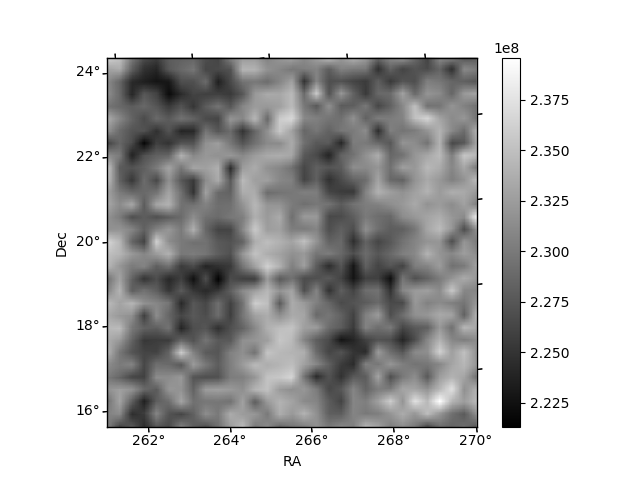
Histogram calculated using DETX and DETY for each event in the final _common_clean file
| Quadrant A | 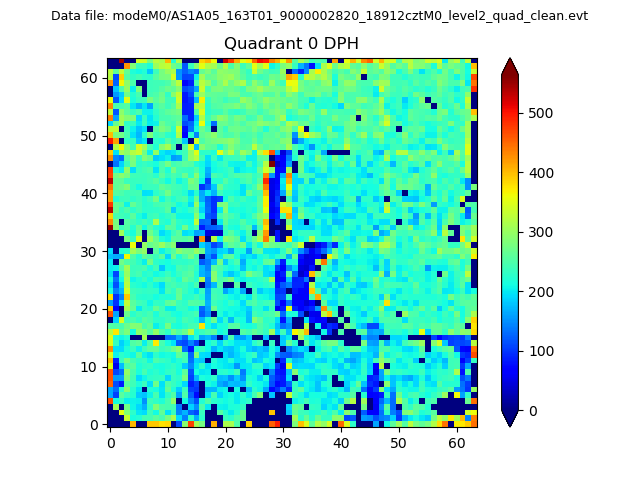 |
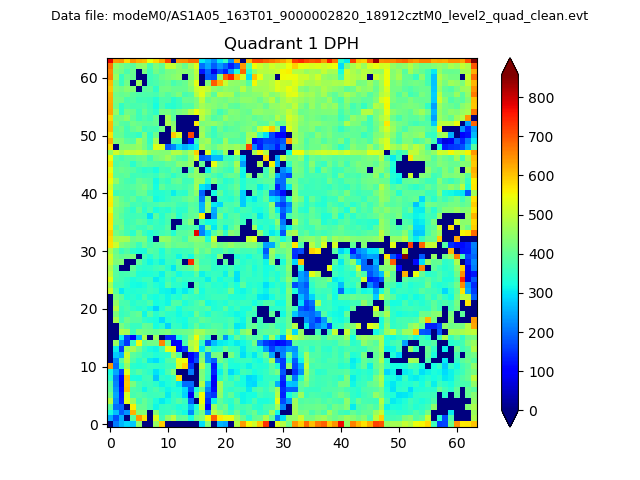 |
Quadrant B |
|---|---|---|---|
| Quadrant D | 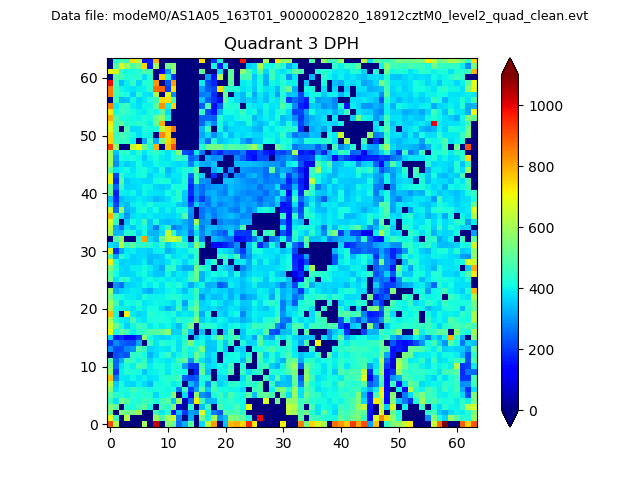 |
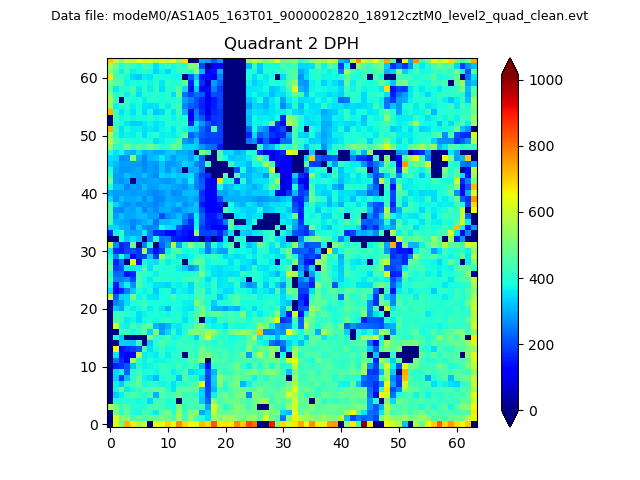 |
Quadrant C |
| Plot type | Count rate plots | Images |
|---|---|---|
| Comparison with Poisson distribution Blue bars denote a histogram of data divided into 1 sec bins. Red curve is a Poisson curve with rate = median count rate of data. |
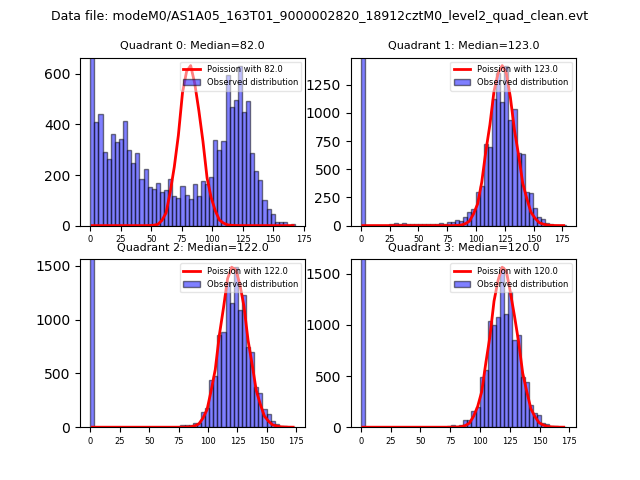 |
 |
| Quadrant-wise count rates Data is divided into 100 sec bins |
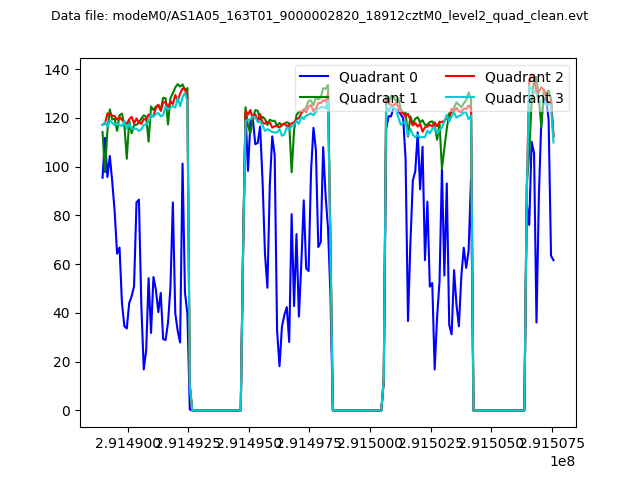 |
|
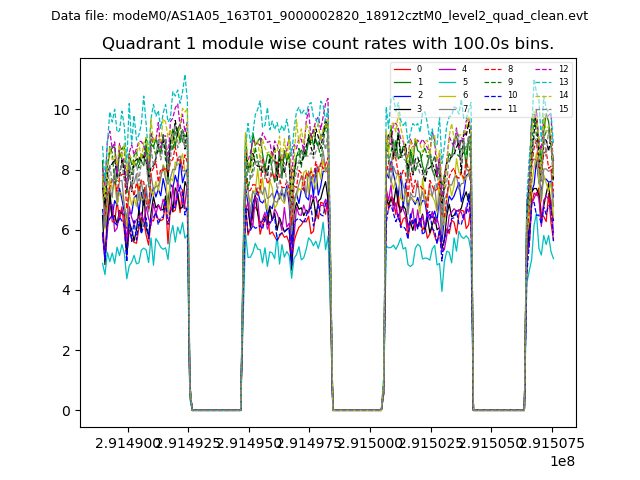
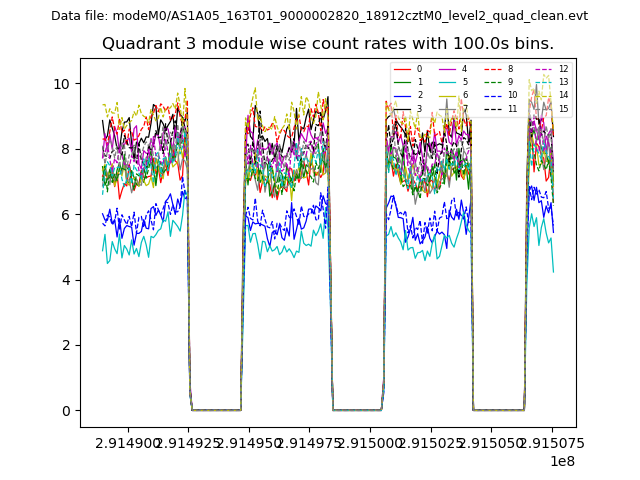
| Module-wise count rates for Quadrant A Data is divided into 100 sec bins |
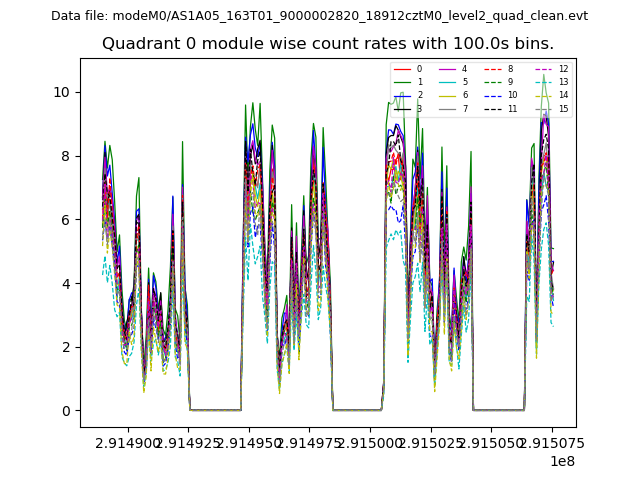 |
 |
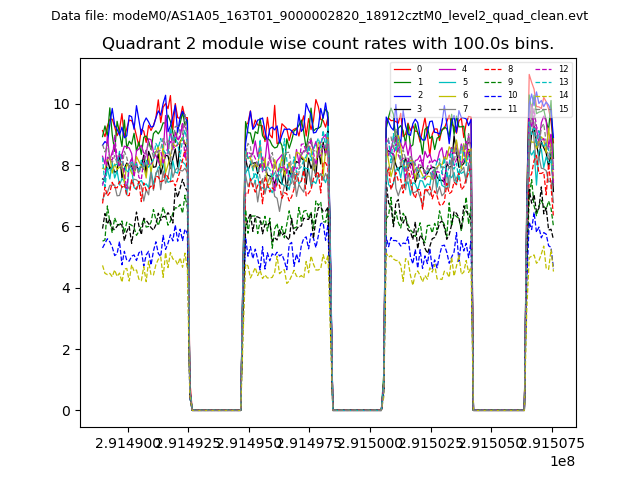
| Module-wise count rates for Quadrant B Data is divided into 100 sec bins |
 |
 |
| Module-wise count rates for Quadrant C Data is divided into 100 sec bins |
 |
 |
| Module-wise count rates for Quadrant D Data is divided into 100 sec bins |
 |
 |
| Parameter | Plot |
|---|---|
| CZT HV Monitor |  |
| D_VDD | 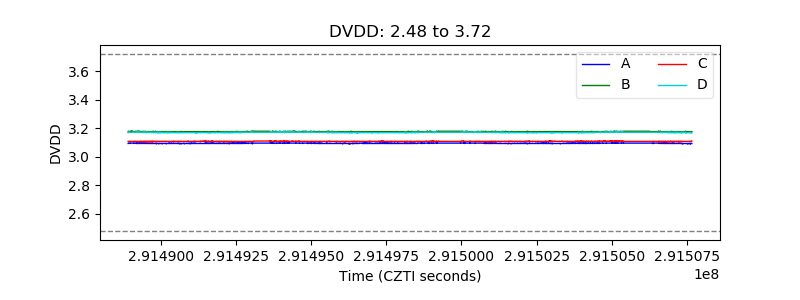 |
| Temperature 1 | 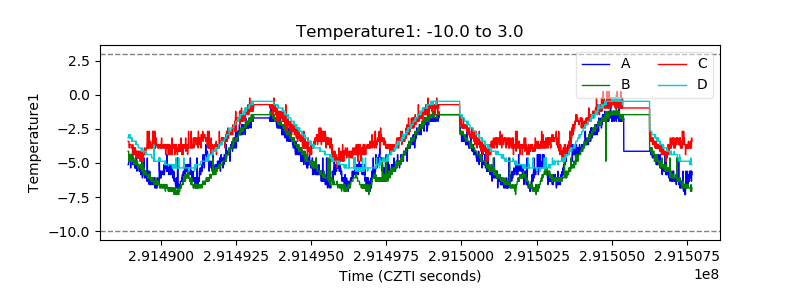 |
| Veto HV Monitor | 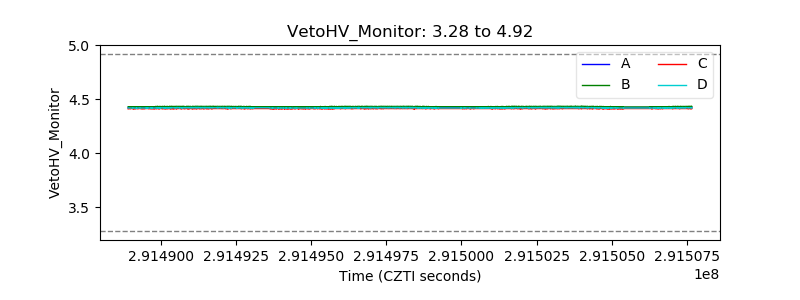 |
| Veto LLD | 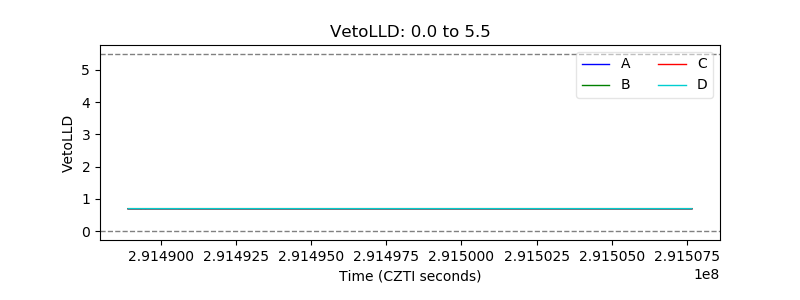 |
| Alpha Counter | 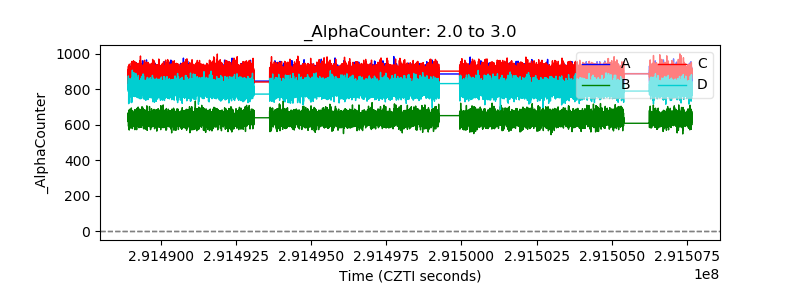 |
| _CPM_Rate | 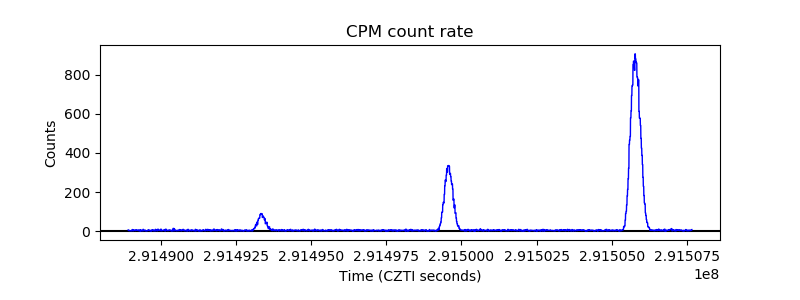 |
| CZT Counter | 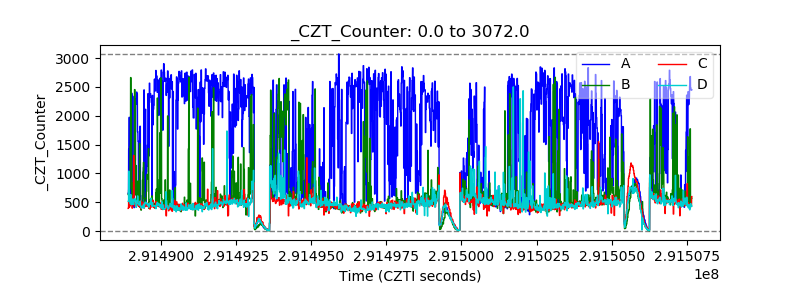 |
| +2.5 Volts monitor |  |
| +5 Volts monitor |  |
| _ROLL_ROT | 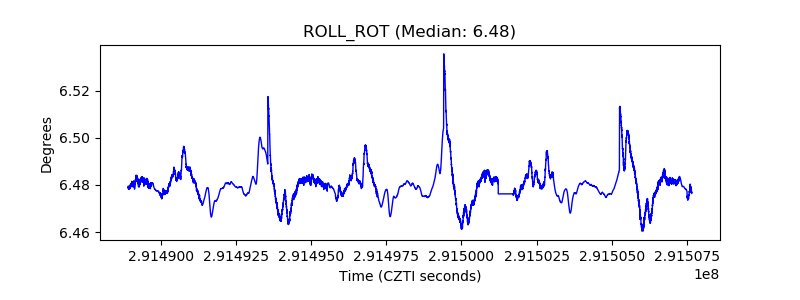 |
| _Roll_DEC |  |
| _Roll_RA | 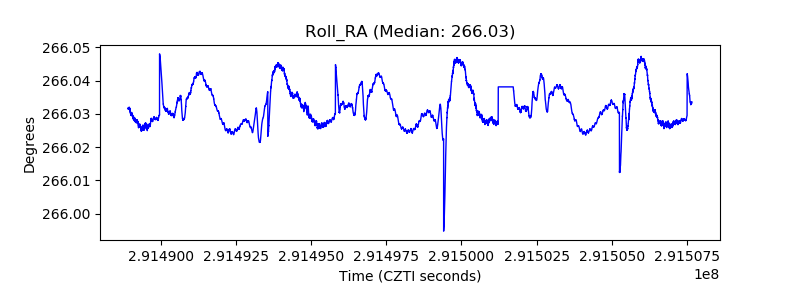 |
| Veto Counter | 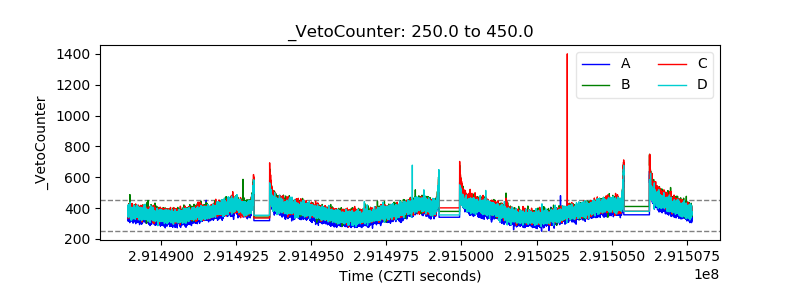 |