| Param | Original file | Final file |
|---|---|---|
| Filename | modeM0/AS1A05_163T01_9000002820_18913cztM0_level2.evt | modeM0/AS1A05_163T01_9000002820_18913cztM0_level2_quad_clean.evt |
| Size (bytes) | 809,337,600 | 91,759,680 |
| Size | 771.8 MB | 87.5 MB |
| Events in quadrant A | 12,055,979 | 408,418 |
| Events in quadrant B | 5,104,685 | 632,248 |
| Events in quadrant C | 3,380,150 | 637,693 |
| Events in quadrant D | 3,502,899 | 618,279 |
| Mode M0 | |||
|---|---|---|---|
| Quadrant | BADHDUFLAG | Total packets | Discarded packets |
| A | 0 | 40527 | 2 |
| B | 0 | 19830 | 2 |
| C | 0 | 14403 | 2 |
| D | 0 | 14972 | 2 |
| Mode SS | |||
|---|---|---|---|
| Quadrant | BADHDUFLAG | Total packets | Discarded packets |
| A | 0 | 144 | 0 |
| B | 0 | 144 | 0 |
| C | 0 | 144 | 0 |
| D | 0 | 144 | 0 |
| Mode M9 | |||
|---|---|---|---|
| Quadrant | BADHDUFLAG | Total packets | Discarded packets |
| A | 0 | 18 | 0 |
| B | 0 | 18 | 0 |
| C | 0 | 18 | 0 |
| D | 0 | 18 | 0 |
| Quadrant | Total seconds | Saturated seconds | Saturation percentage |
|---|---|---|---|
| A | 6895 | 4163 | 60.377085% |
| B | 6896 | 485 | 7.033063% |
| C | 6896 | 102 | 1.479118% |
| D | 6895 | 59 | 0.855693% |
Noise dominated data is calculated using 1-second bins in cleaned event files. If a bin has >2000 counts, and if more than 50% of those come from <1% of pixels, then it is considered to be noise-dominated and hence unusable.
| Quadrant | # 1 sec bins | Bins with >0 counts | Bins with >2000 counts | High rate bins dominated by noise | Noise dominated (total time) | Noise dominated (detector-on time) | Marked lightcurve |
|---|---|---|---|---|---|---|---|
| A | 8760 | 6895 | 3039 | 3039 | 34.69% | 44.08% | 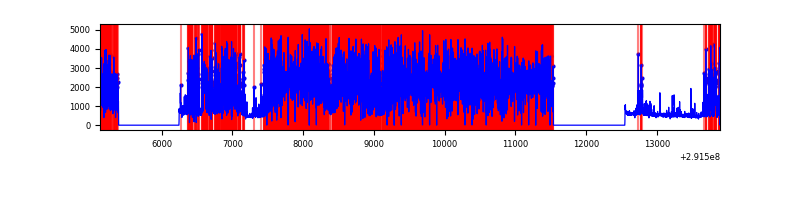 |
| B | 8761 | 6897 | 232 | 232 | 2.65% | 3.36% | 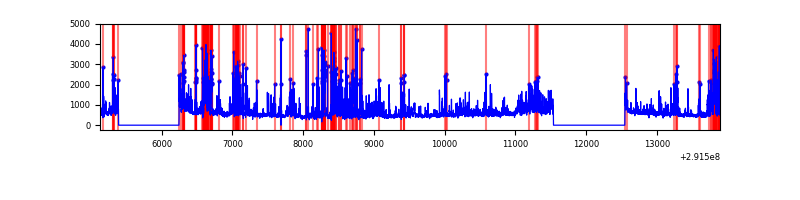 |
| C | 8761 | 6898 | 2 | 2 | 0.02% | 0.03% | 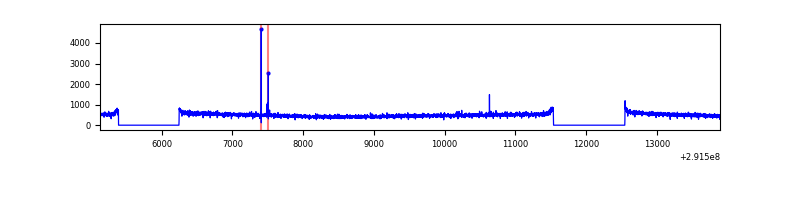 |
| D | 8760 | 6897 | 8 | 8 | 0.09% | 0.12% | 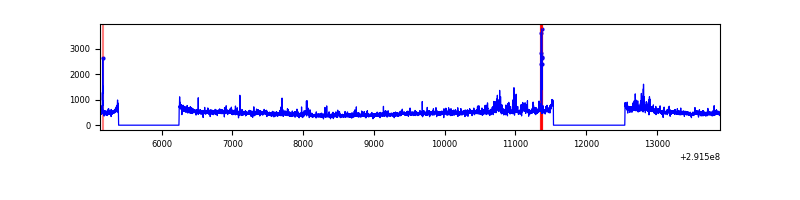 |
Top three noisy pixels from each quadrant. If the there are fewer than three noisy pixels in the level2.evt file, extra rows are filled as -1
| Pixel properties | Quadrant properties | ||||||
|---|---|---|---|---|---|---|---|
| Quadrant | DetID | PixID | Counts | Sigma | Mean | Median | Sigma |
| A | 14 | 235 | 10032079 | 93213.95 | 525 | 514 | 107.6 |
| A | 13 | 254 | 6487 | 55.5 | 525 | 514 | 107.6 |
| A | 0 | 226 | 4487 | 36.92 | 525 | 514 | 107.6 |
| B | 3 | 112 | 1524581 | 9556.66 | 829 | 807 | 159.4 |
| B | 7 | 220 | 112628 | 701.31 | 829 | 807 | 159.4 |
| B | 0 | 189 | 86670 | 538.51 | 829 | 807 | 159.4 |
| C | 14 | 238 | 126258 | 654.81 | 815 | 821 | 191.6 |
| C | 3 | 233 | 59747 | 307.61 | 815 | 821 | 191.6 |
| C | 5 | 112 | 15430 | 76.26 | 815 | 821 | 191.6 |
| D | 7 | 238 | 191421 | 942.01 | 821 | 799 | 202.4 |
| D | 12 | 110 | 154420 | 759.16 | 821 | 799 | 202.4 |
| D | 2 | 234 | 34001 | 164.08 | 821 | 799 | 202.4 |
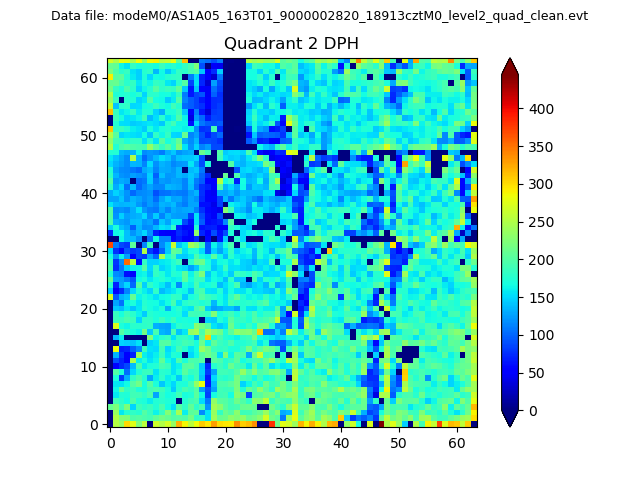
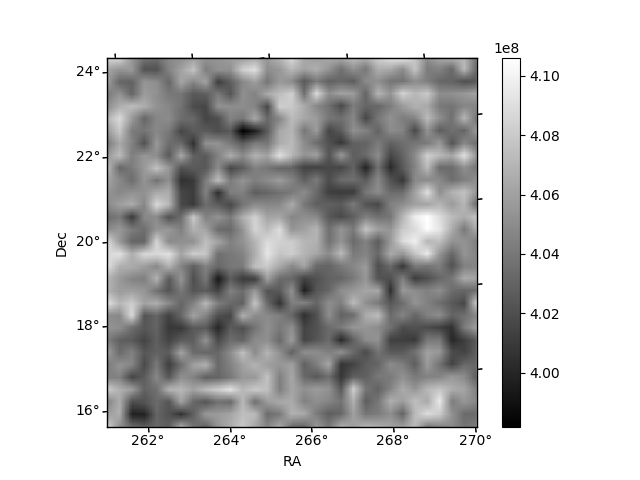
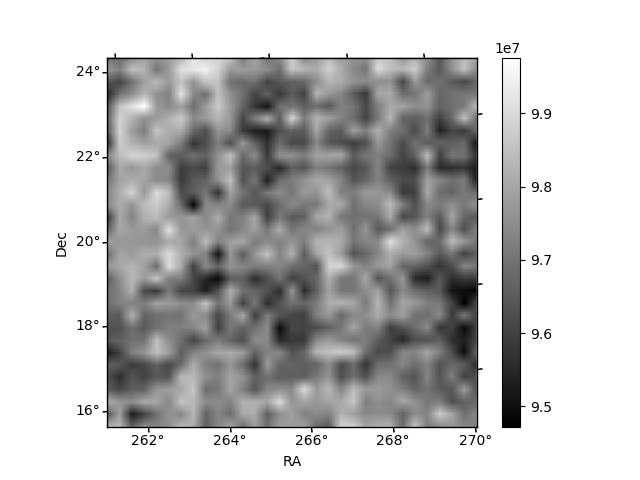
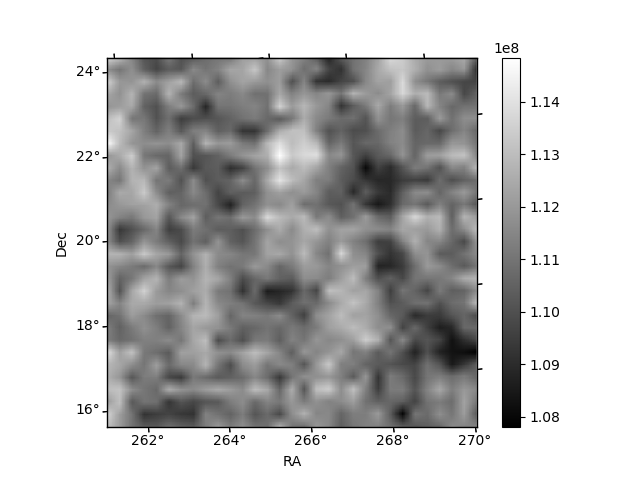
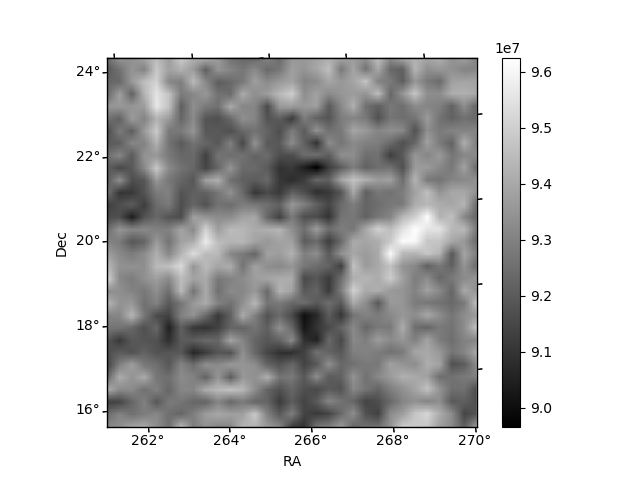
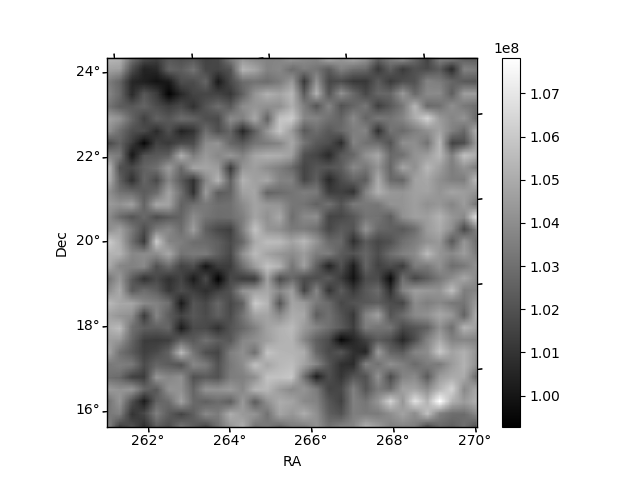
Histogram calculated using DETX and DETY for each event in the final _common_clean file
| Quadrant A | 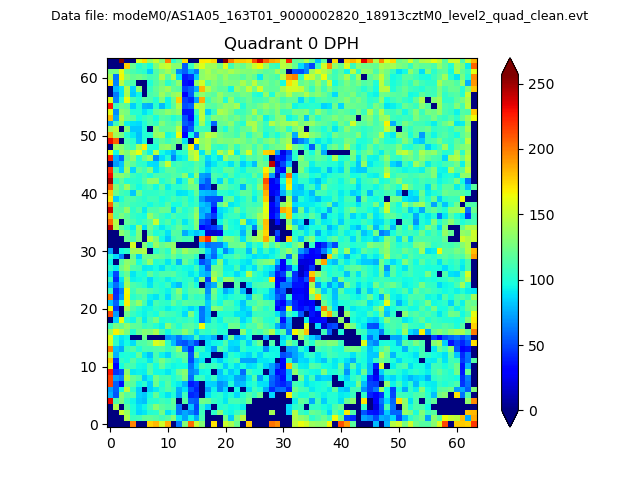 |
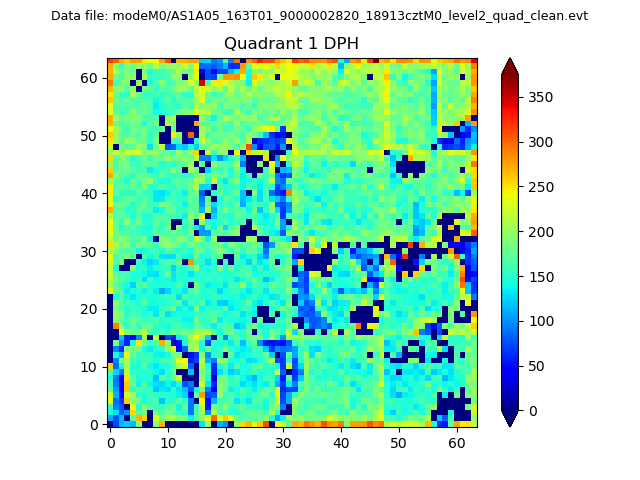 |
Quadrant B |
|---|---|---|---|
| Quadrant D | 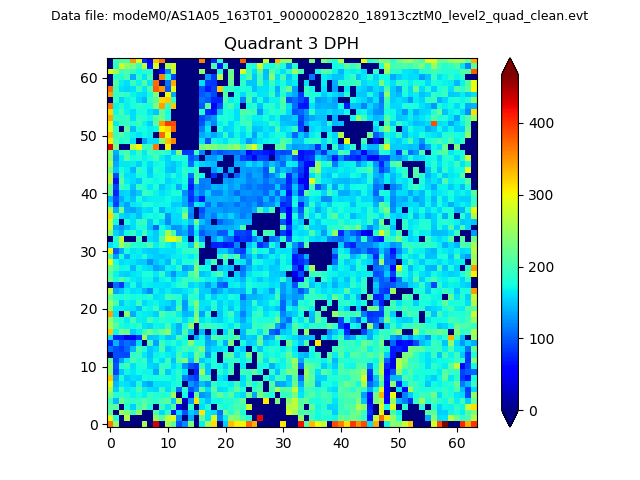 |
 |
Quadrant C |
| Plot type | Count rate plots | Images |
|---|---|---|
| Comparison with Poisson distribution Blue bars denote a histogram of data divided into 1 sec bins. Red curve is a Poisson curve with rate = median count rate of data. |
 |
 |
| Quadrant-wise count rates Data is divided into 100 sec bins |
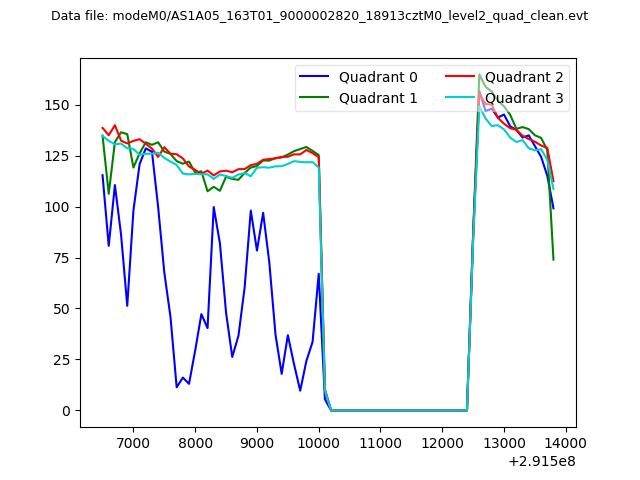 |
|
| Module-wise count rates for Quadrant A Data is divided into 100 sec bins |
 |
 |
| Module-wise count rates for Quadrant B Data is divided into 100 sec bins |
 |
 |
| Module-wise count rates for Quadrant C Data is divided into 100 sec bins |
 |
 |
| Module-wise count rates for Quadrant D Data is divided into 100 sec bins |
 |
 |
| Parameter | Plot |
|---|---|
| CZT HV Monitor |  |
| D_VDD | 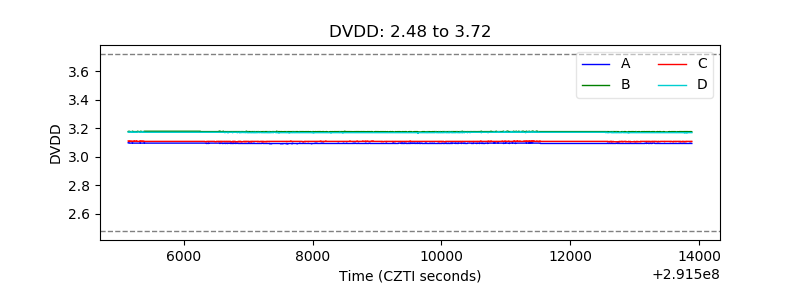 |
| Temperature 1 | 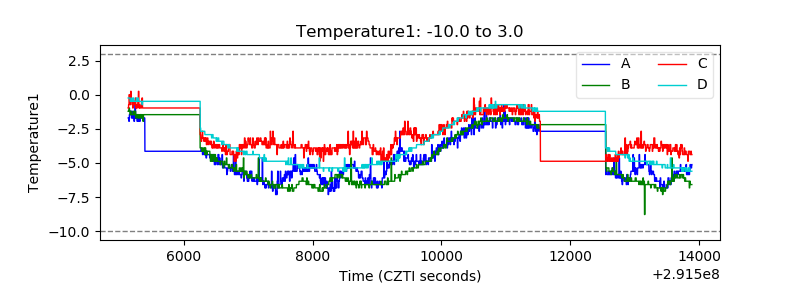 |
| Veto HV Monitor | 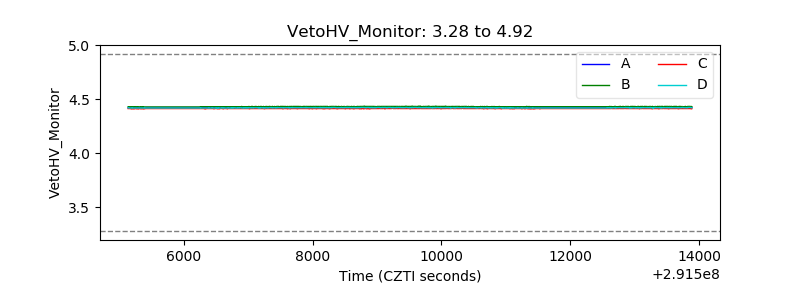 |
| Veto LLD | 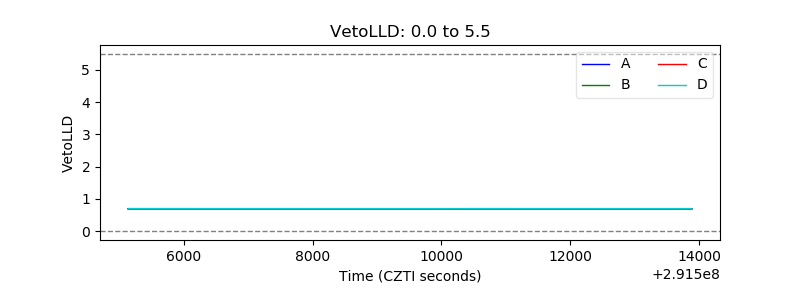 |
| Alpha Counter | 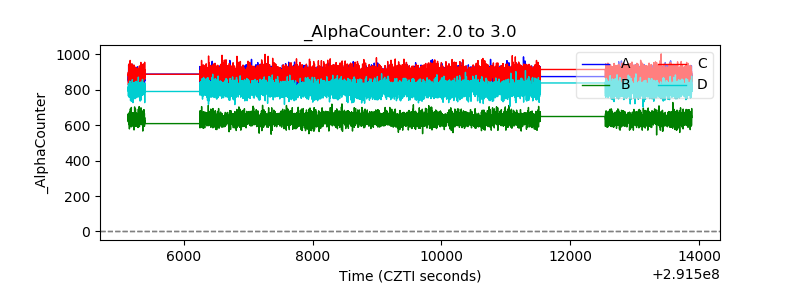 |
| _CPM_Rate | 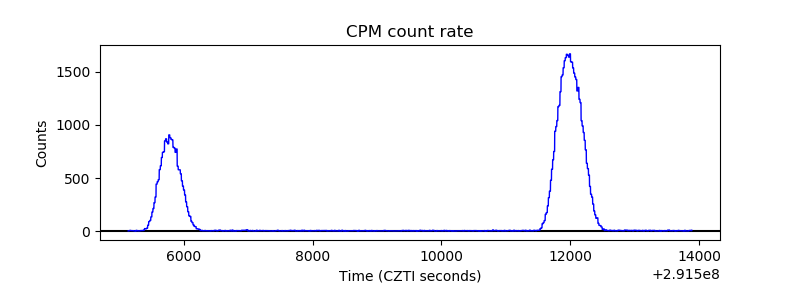 |
| CZT Counter | 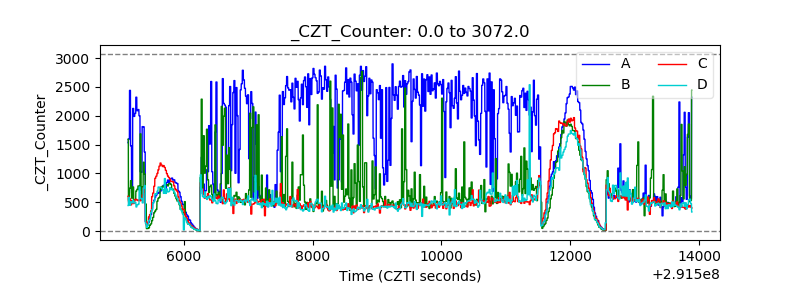 |
| +2.5 Volts monitor |  |
| +5 Volts monitor | 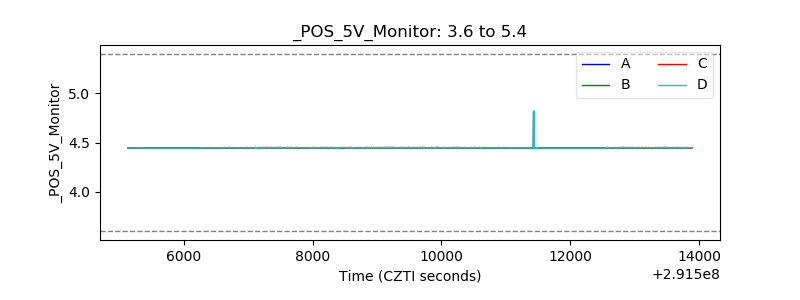 |
| _ROLL_ROT | 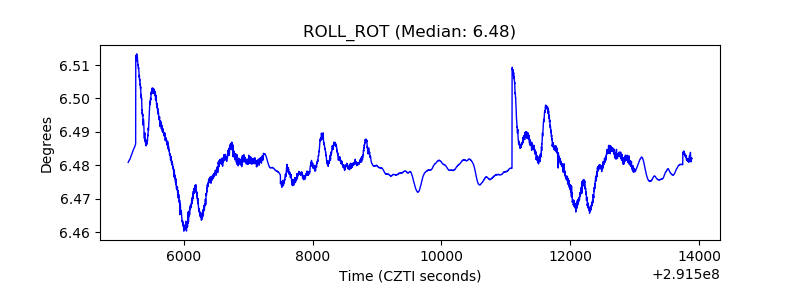 |
| _Roll_DEC | 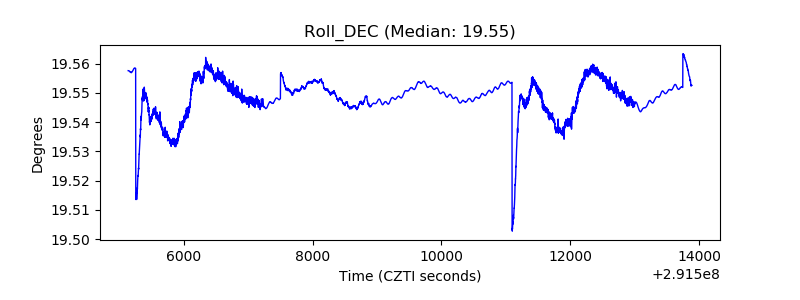 |
| _Roll_RA | 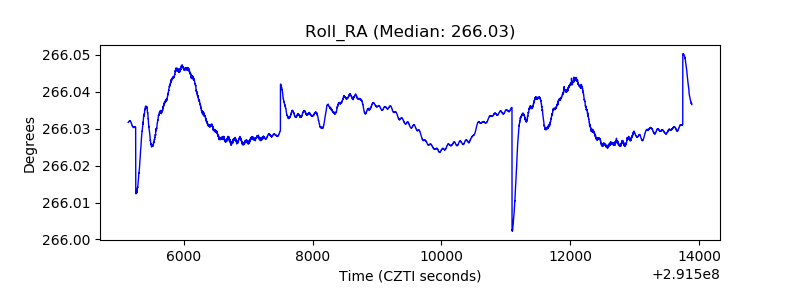 |
| Veto Counter |  |