| Param | Original file | Final file |
|---|---|---|
| Filename | modeM0/AS1A05_163T01_9000002820_18915cztM0_level2.evt | modeM0/AS1A05_163T01_9000002820_18915cztM0_level2_quad_clean.evt |
| Size (bytes) | 709,381,440 | 91,707,840 |
| Size | 676.5 MB | 87.5 MB |
| Events in quadrant A | 10,807,211 | 452,171 |
| Events in quadrant B | 3,830,241 | 646,132 |
| Events in quadrant C | 3,246,161 | 626,373 |
| Events in quadrant D | 3,166,706 | 605,408 |
| Mode M0 | |||
|---|---|---|---|
| Quadrant | BADHDUFLAG | Total packets | Discarded packets |
| A | 0 | 36504 | 2 |
| B | 0 | 15682 | 4 |
| C | 0 | 13783 | 2 |
| D | 0 | 13730 | 2 |
| Mode SS | |||
|---|---|---|---|
| Quadrant | BADHDUFLAG | Total packets | Discarded packets |
| A | 0 | 132 | 0 |
| B | 0 | 132 | 0 |
| C | 0 | 132 | 0 |
| D | 0 | 132 | 0 |
| Mode M9 | |||
|---|---|---|---|
| Quadrant | BADHDUFLAG | Total packets | Discarded packets |
| A | 0 | 22 | 0 |
| B | 0 | 22 | 0 |
| C | 0 | 22 | 0 |
| D | 0 | 22 | 0 |
| Quadrant | Total seconds | Saturated seconds | Saturation percentage |
|---|---|---|---|
| A | 6395 | 3450 | 53.948397% |
| B | 6394 | 230 | 3.597122% |
| C | 6395 | 149 | 2.329945% |
| D | 6395 | 34 | 0.531665% |
Noise dominated data is calculated using 1-second bins in cleaned event files. If a bin has >2000 counts, and if more than 50% of those come from <1% of pixels, then it is considered to be noise-dominated and hence unusable.
| Quadrant | # 1 sec bins | Bins with >0 counts | Bins with >2000 counts | High rate bins dominated by noise | Noise dominated (total time) | Noise dominated (detector-on time) | Marked lightcurve |
|---|---|---|---|---|---|---|---|
| A | 8545 | 6397 | 2571 | 2571 | 30.09% | 40.19% | 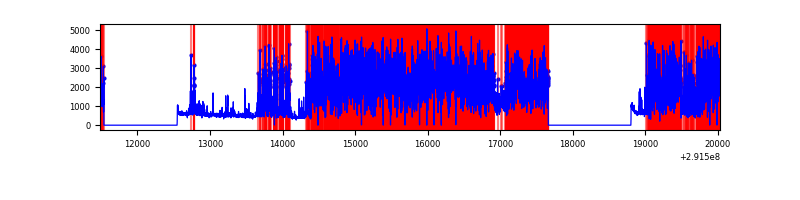 |
| B | 8544 | 6396 | 86 | 86 | 1.01% | 1.34% | 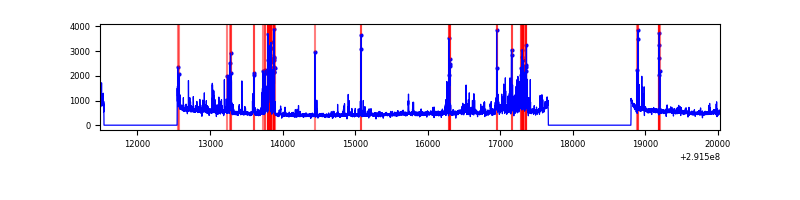 |
| C | 8545 | 6397 | 0 | 0 | 0.00% | 0.00% |  |
| D | 8545 | 6397 | 0 | 0 | 0.00% | 0.00% | 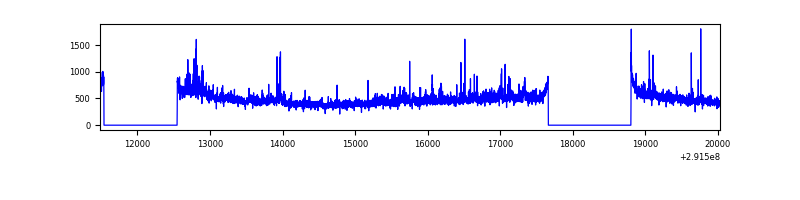 |
Top three noisy pixels from each quadrant. If the there are fewer than three noisy pixels in the level2.evt file, extra rows are filled as -1
| Pixel properties | Quadrant properties | ||||||
|---|---|---|---|---|---|---|---|
| Quadrant | DetID | PixID | Counts | Sigma | Mean | Median | Sigma |
| A | 14 | 235 | 8617659 | 76211.93 | 555 | 544 | 113.1 |
| A | 15 | 174 | 52688 | 461.17 | 555 | 544 | 113.1 |
| A | 13 | 254 | 6143 | 49.52 | 555 | 544 | 113.1 |
| B | 3 | 112 | 427649 | 2817.82 | 792 | 773 | 151.5 |
| B | 4 | 216 | 108802 | 713.1 | 792 | 773 | 151.5 |
| B | 7 | 220 | 67265 | 438.92 | 792 | 773 | 151.5 |
| C | 3 | 233 | 149257 | 832.86 | 764 | 770 | 178.3 |
| C | 14 | 238 | 118941 | 662.82 | 764 | 770 | 178.3 |
| C | 13 | 61 | 5402 | 25.98 | 764 | 770 | 178.3 |
| D | 7 | 238 | 177382 | 930.58 | 769 | 746 | 189.8 |
| D | 12 | 110 | 34571 | 178.2 | 769 | 746 | 189.8 |
| D | 2 | 234 | 29807 | 153.1 | 769 | 746 | 189.8 |
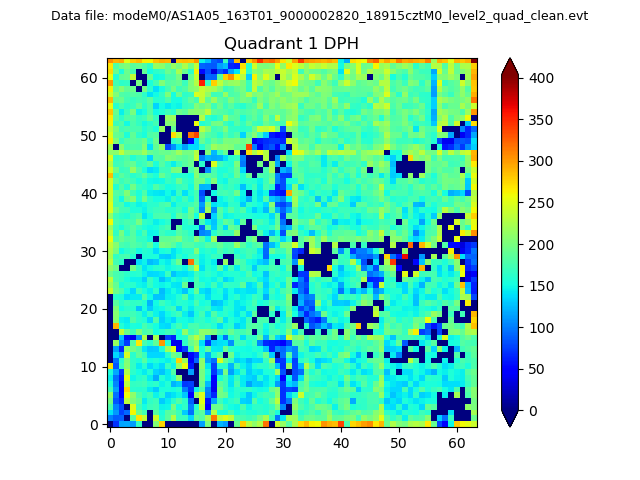
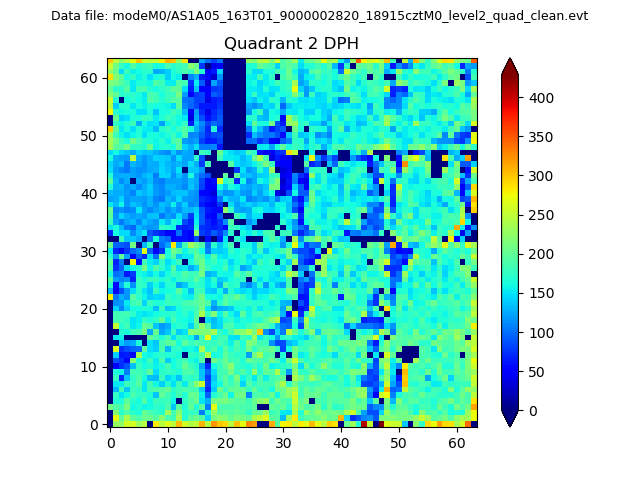
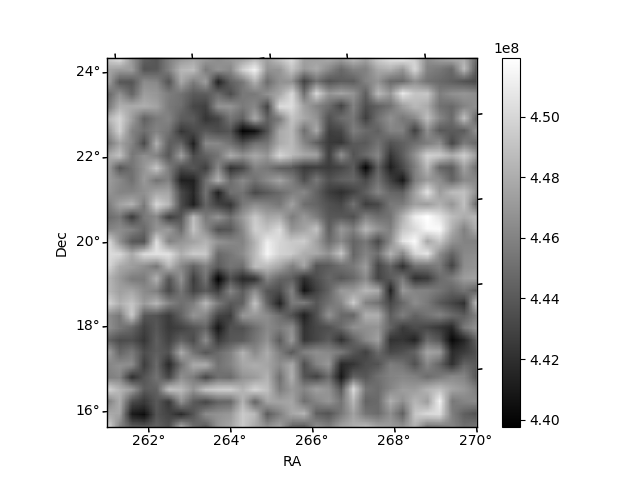
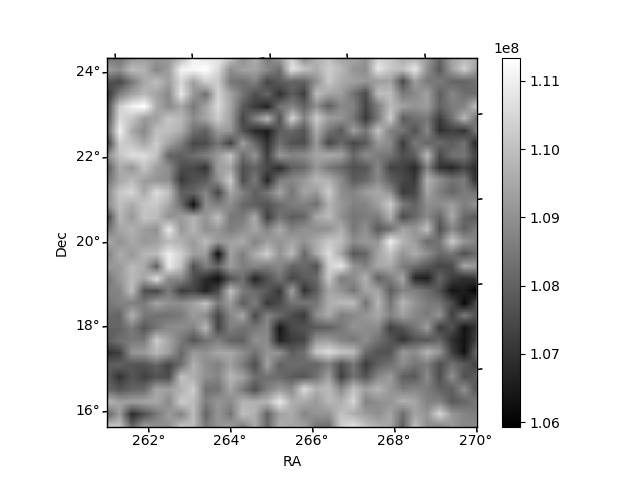
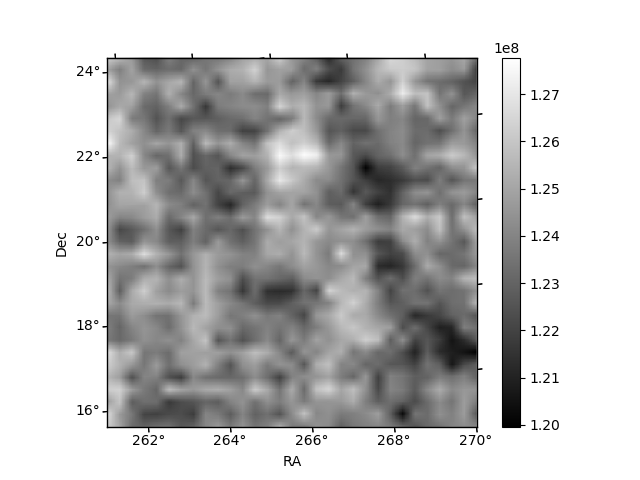
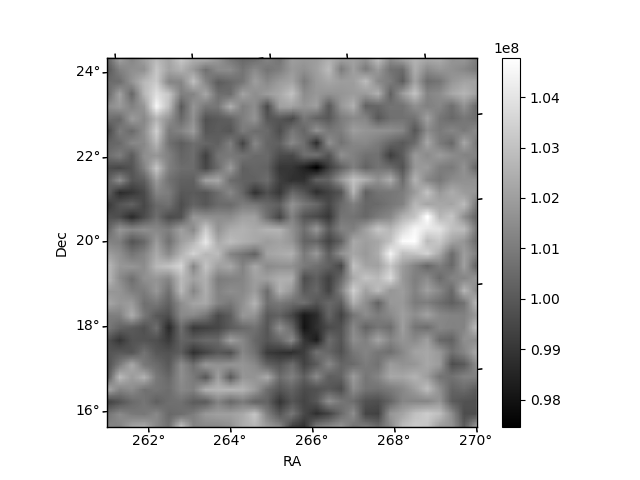
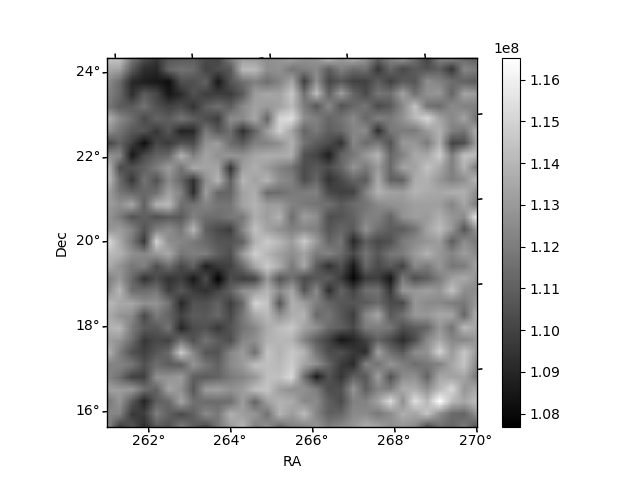
Histogram calculated using DETX and DETY for each event in the final _common_clean file
| Quadrant A | 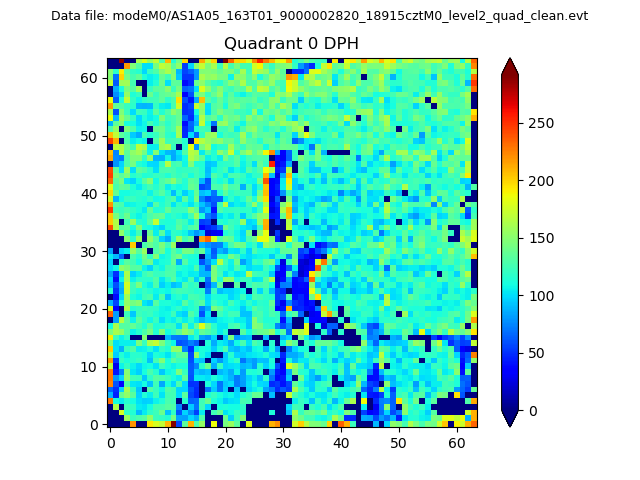 |
 |
Quadrant B |
|---|---|---|---|
| Quadrant D | 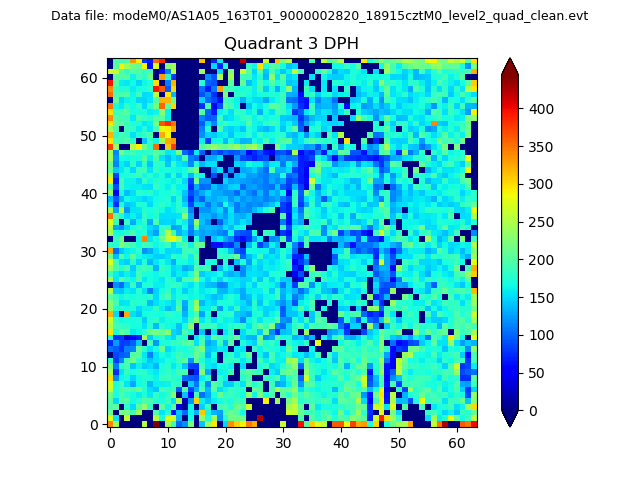 |
 |
Quadrant C |
| Plot type | Count rate plots | Images |
|---|---|---|
| Comparison with Poisson distribution Blue bars denote a histogram of data divided into 1 sec bins. Red curve is a Poisson curve with rate = median count rate of data. |
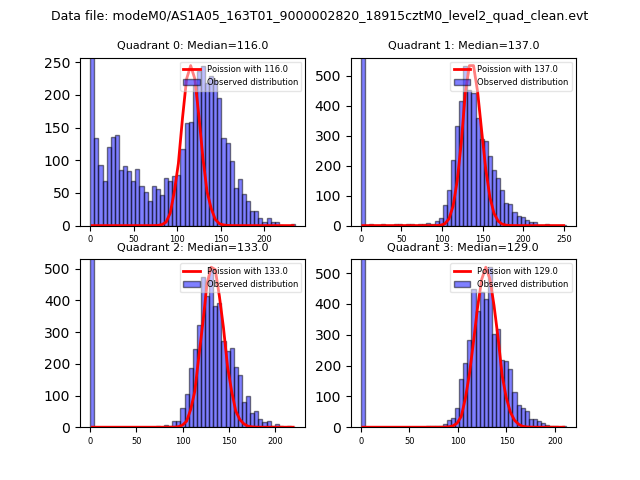 |
 |
| Quadrant-wise count rates Data is divided into 100 sec bins |
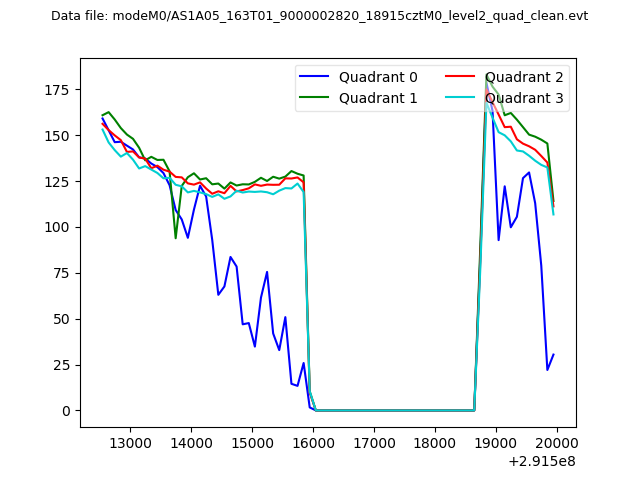 |
|
| Module-wise count rates for Quadrant A Data is divided into 100 sec bins |
 |
 |
| Module-wise count rates for Quadrant B Data is divided into 100 sec bins |
 |
 |
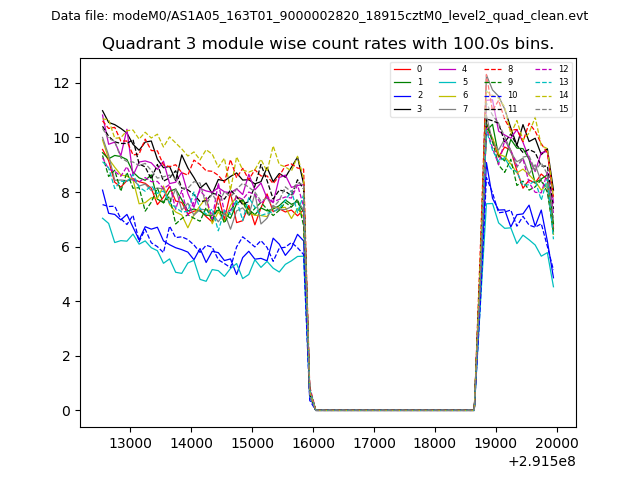
| Module-wise count rates for Quadrant C Data is divided into 100 sec bins |
 |
 |
| Module-wise count rates for Quadrant D Data is divided into 100 sec bins |
 |
 |
| Parameter | Plot |
|---|---|
| CZT HV Monitor | 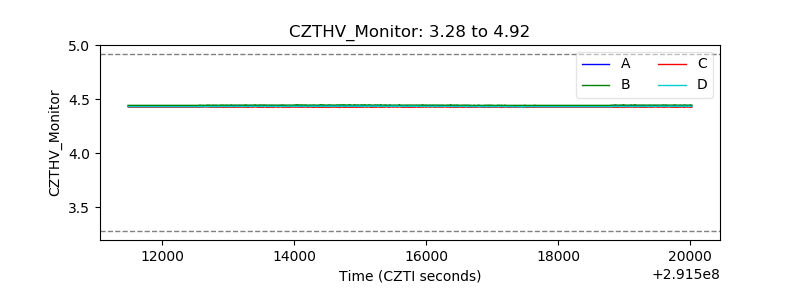 |
| D_VDD | 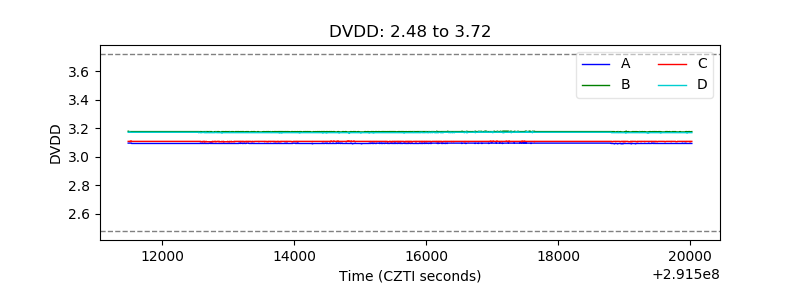 |
| Temperature 1 | 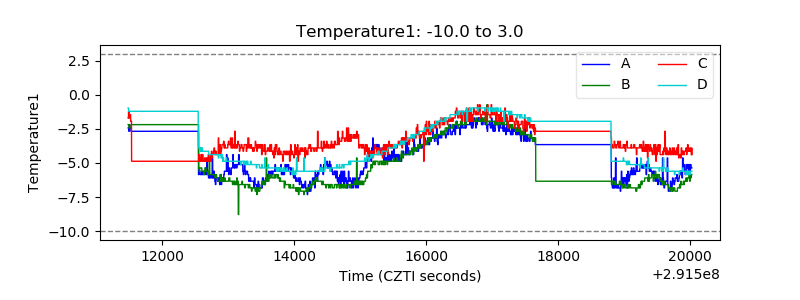 |
| Veto HV Monitor | 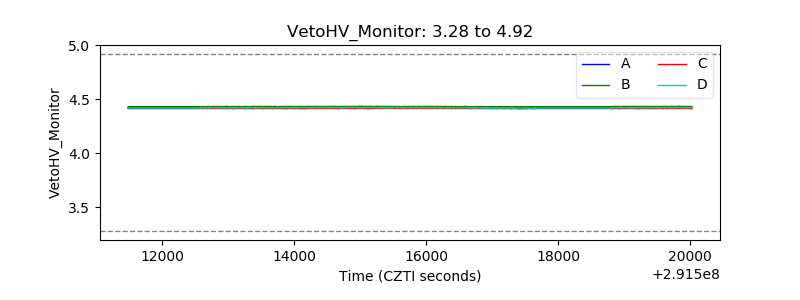 |
| Veto LLD | 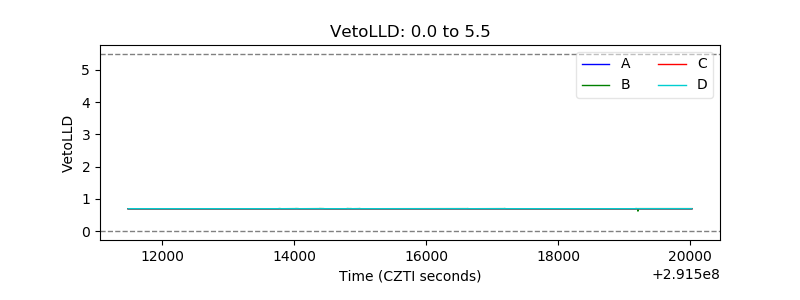 |
| Alpha Counter | 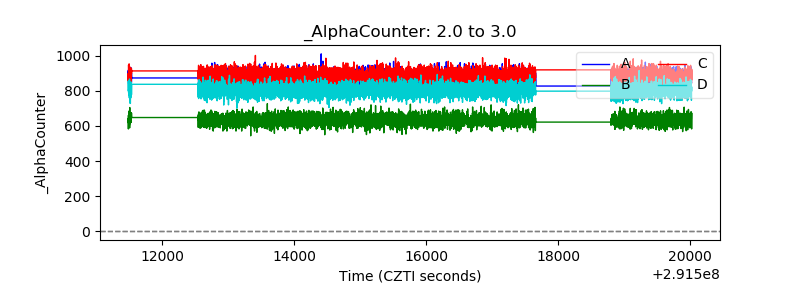 |
| _CPM_Rate | 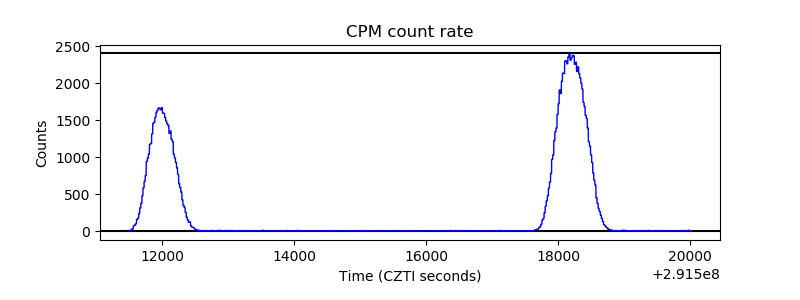 |
| CZT Counter | 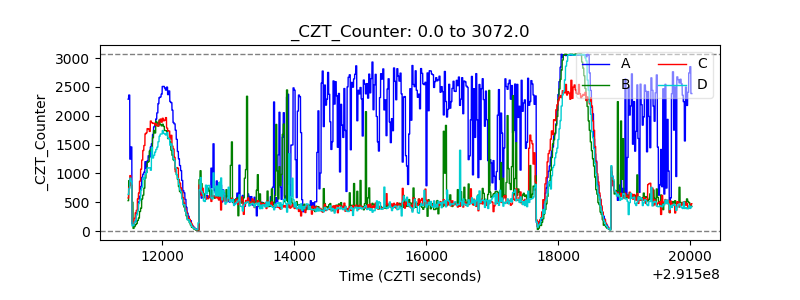 |
| +2.5 Volts monitor |  |
| +5 Volts monitor |  |
| _ROLL_ROT | 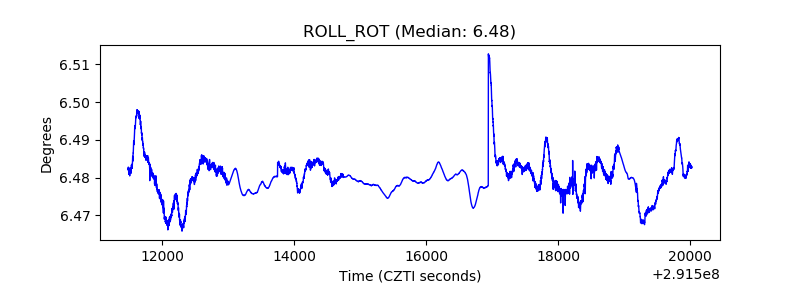 |
| _Roll_DEC | 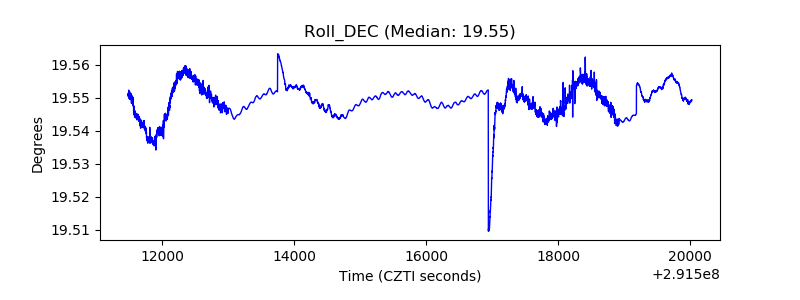 |
| _Roll_RA | 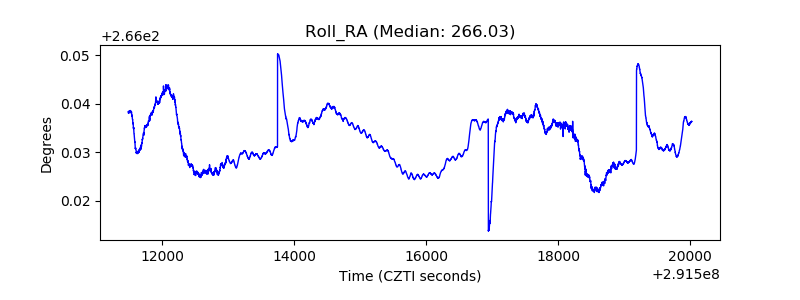 |
| Veto Counter |  |