| Param | Original file | Final file |
|---|---|---|
| Filename | modeM0/AS1A05_163T01_9000002820_18916cztM0_level2.evt | modeM0/AS1A05_163T01_9000002820_18916cztM0_level2_quad_clean.evt |
| Size (bytes) | 785,278,080 | 94,965,120 |
| Size | 748.9 MB | 90.6 MB |
| Events in quadrant A | 12,584,854 | 432,399 |
| Events in quadrant B | 4,059,411 | 686,173 |
| Events in quadrant C | 3,430,659 | 659,737 |
| Events in quadrant D | 3,261,634 | 637,106 |
| Mode M0 | |||
|---|---|---|---|
| Quadrant | BADHDUFLAG | Total packets | Discarded packets |
| A | 0 | 41955 | 2 |
| B | 0 | 16254 | 2 |
| C | 0 | 14244 | 2 |
| D | 0 | 13984 | 2 |
| Mode SS | |||
|---|---|---|---|
| Quadrant | BADHDUFLAG | Total packets | Discarded packets |
| A | 0 | 134 | 0 |
| B | 0 | 134 | 0 |
| C | 0 | 134 | 0 |
| D | 0 | 134 | 0 |
| Mode M9 | |||
|---|---|---|---|
| Quadrant | BADHDUFLAG | Total packets | Discarded packets |
| A | 0 | 20 | 0 |
| B | 0 | 21 | 0 |
| C | 0 | 21 | 0 |
| D | 0 | 21 | 0 |
| Quadrant | Total seconds | Saturated seconds | Saturation percentage |
|---|---|---|---|
| A | 6584 | 4198 | 63.760632% |
| B | 6584 | 263 | 3.994532% |
| C | 6584 | 80 | 1.215067% |
| D | 6584 | 16 | 0.243013% |
Noise dominated data is calculated using 1-second bins in cleaned event files. If a bin has >2000 counts, and if more than 50% of those come from <1% of pixels, then it is considered to be noise-dominated and hence unusable.
| Quadrant | # 1 sec bins | Bins with >0 counts | Bins with >2000 counts | High rate bins dominated by noise | Noise dominated (total time) | Noise dominated (detector-on time) | Marked lightcurve |
|---|---|---|---|---|---|---|---|
| A | 7824 | 6585 | 3083 | 3083 | 39.40% | 46.82% | 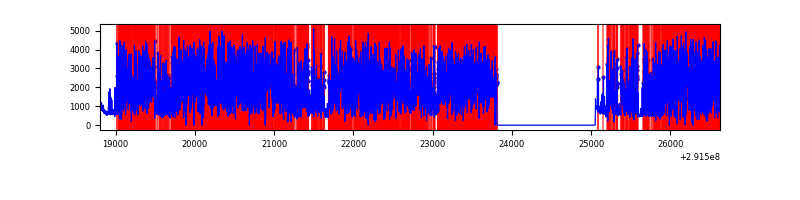 |
| B | 7824 | 6585 | 111 | 111 | 1.42% | 1.69% | 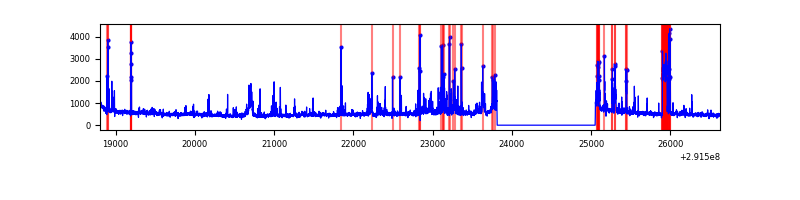 |
| C | 7824 | 6585 | 9 | 9 | 0.12% | 0.14% | 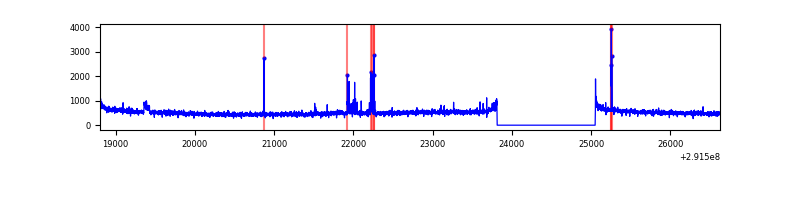 |
| D | 7824 | 6585 | 4 | 4 | 0.05% | 0.06% | 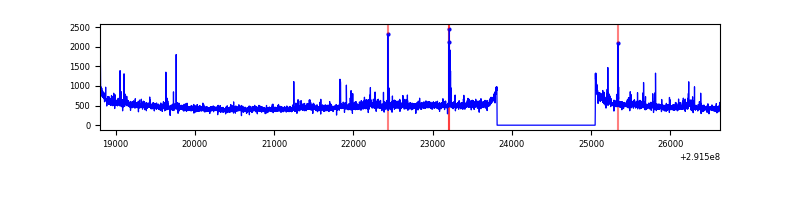 |
Top three noisy pixels from each quadrant. If the there are fewer than three noisy pixels in the level2.evt file, extra rows are filled as -1
| Pixel properties | Quadrant properties | ||||||
|---|---|---|---|---|---|---|---|
| Quadrant | DetID | PixID | Counts | Sigma | Mean | Median | Sigma |
| A | 14 | 235 | 10515198 | 97635.06 | 536 | 527 | 107.7 |
| A | 13 | 254 | 5148 | 42.91 | 536 | 527 | 107.7 |
| A | 0 | 226 | 4631 | 38.11 | 536 | 527 | 107.7 |
| B | 3 | 112 | 520576 | 3292.12 | 834 | 814 | 157.9 |
| B | 5 | 250 | 129483 | 814.98 | 834 | 814 | 157.9 |
| B | 0 | 189 | 37994 | 235.49 | 834 | 814 | 157.9 |
| C | 14 | 238 | 127688 | 680.71 | 805 | 813 | 186.4 |
| C | 3 | 233 | 86278 | 458.54 | 805 | 813 | 186.4 |
| C | 6 | 96 | 72217 | 383.1 | 805 | 813 | 186.4 |
| D | 7 | 238 | 160431 | 822.23 | 805 | 782 | 194.2 |
| D | 2 | 234 | 26511 | 132.51 | 805 | 782 | 194.2 |
| D | 12 | 110 | 17313 | 85.14 | 805 | 782 | 194.2 |
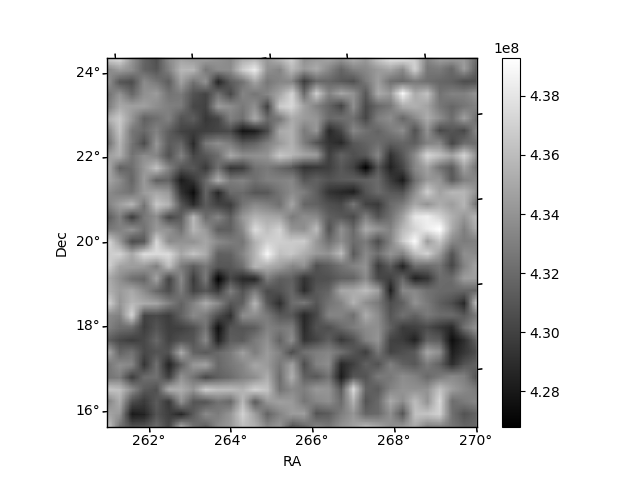
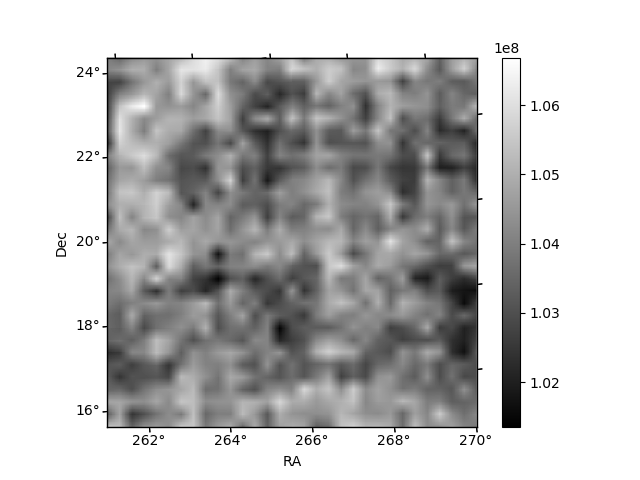
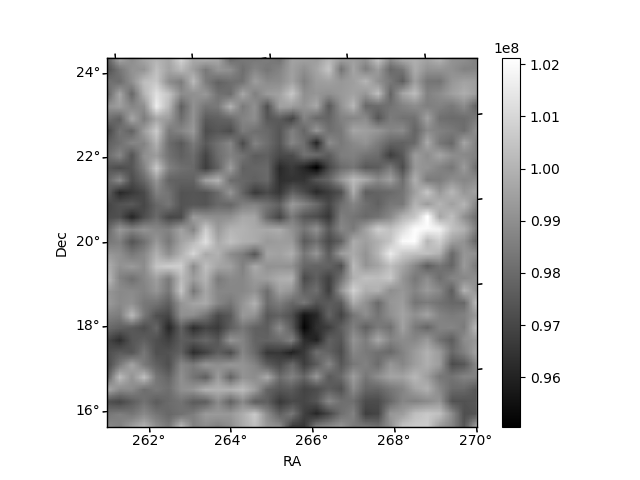
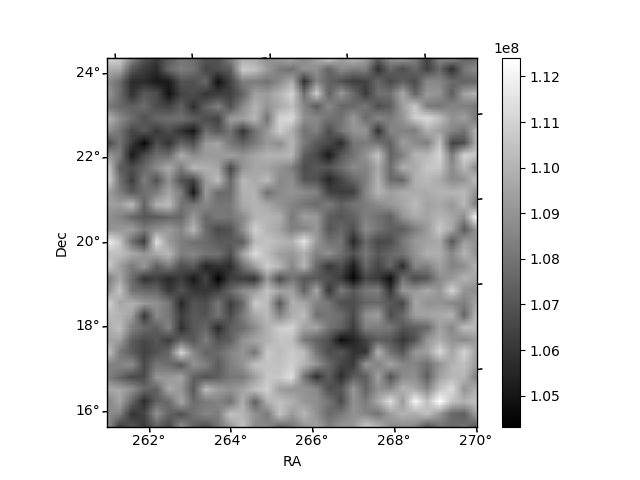
Histogram calculated using DETX and DETY for each event in the final _common_clean file
| Quadrant A | 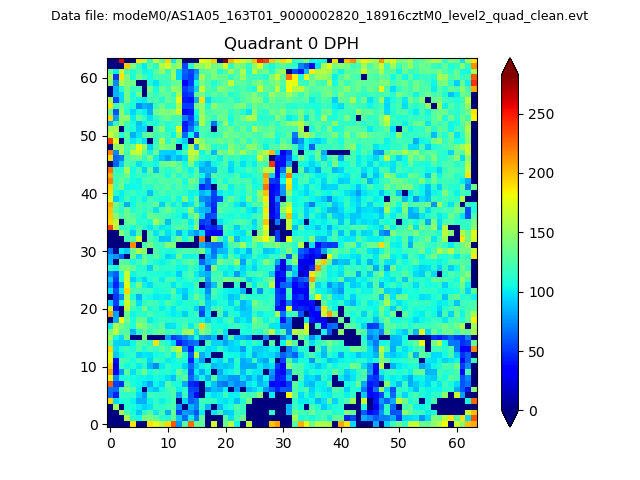 |
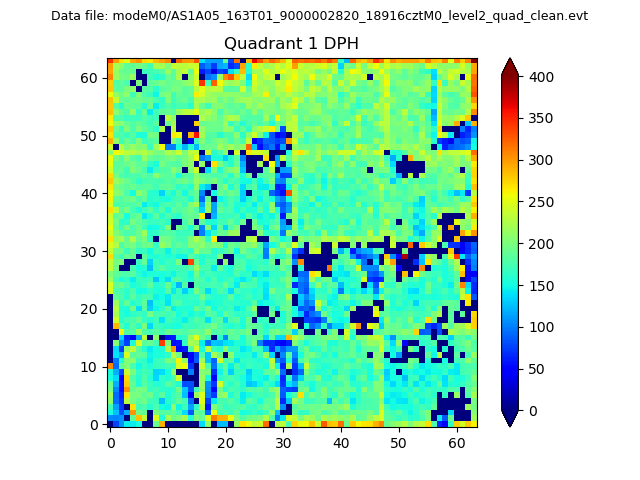 |
Quadrant B |
|---|---|---|---|
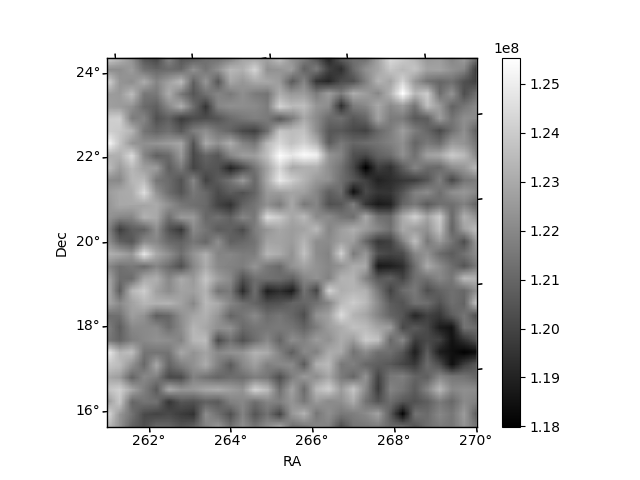
| Quadrant D | 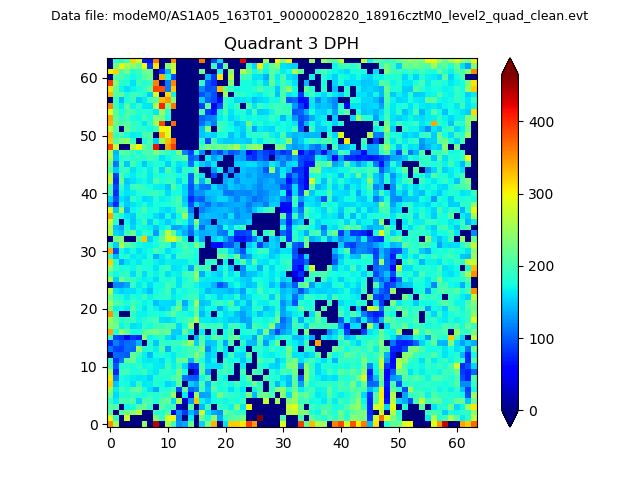 |
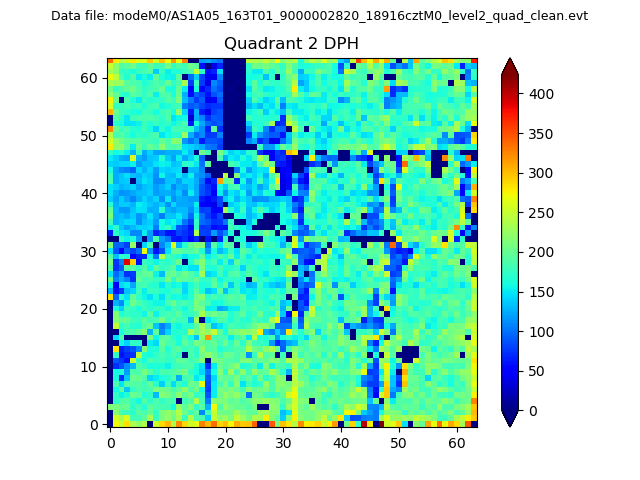 |
Quadrant C |
| Plot type | Count rate plots | Images |
|---|---|---|
| Comparison with Poisson distribution Blue bars denote a histogram of data divided into 1 sec bins. Red curve is a Poisson curve with rate = median count rate of data. |
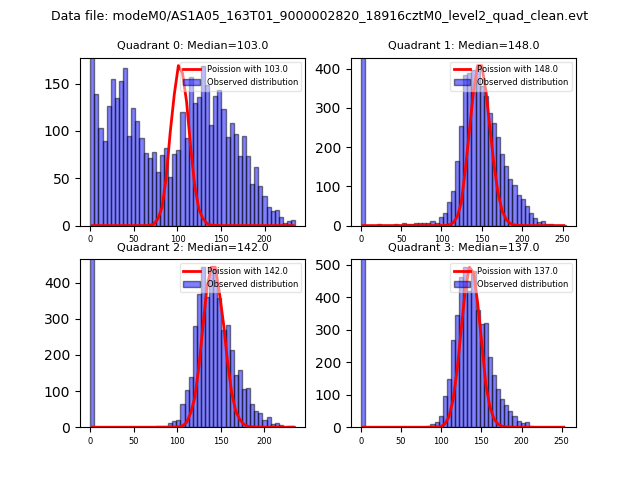 |
 |
| Quadrant-wise count rates Data is divided into 100 sec bins |
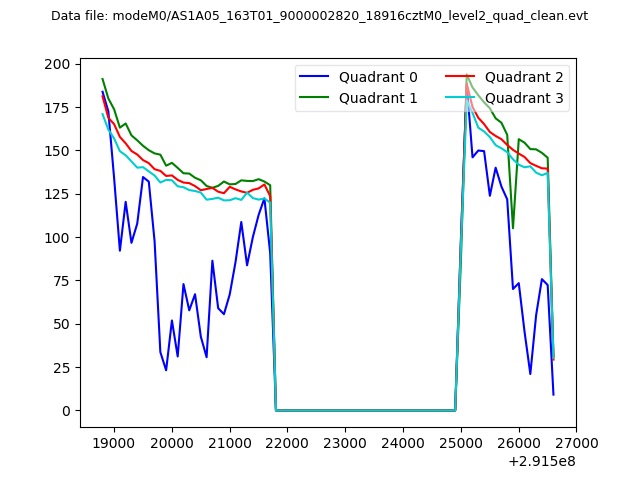 |
|
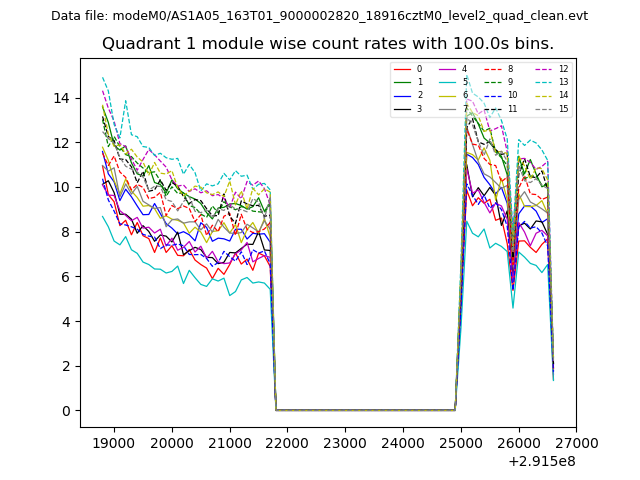
| Module-wise count rates for Quadrant A Data is divided into 100 sec bins |
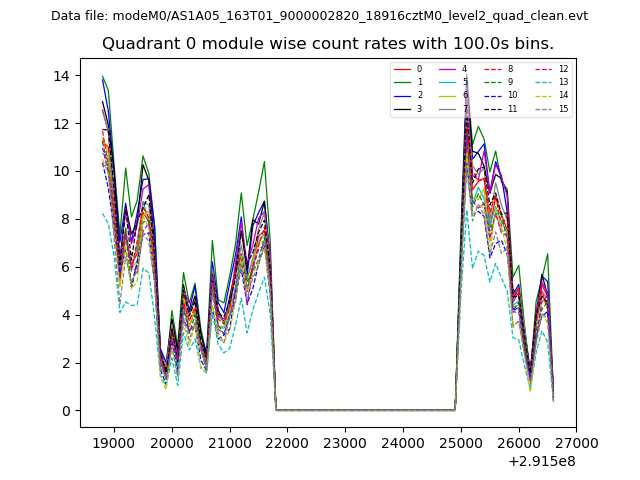 |
 |
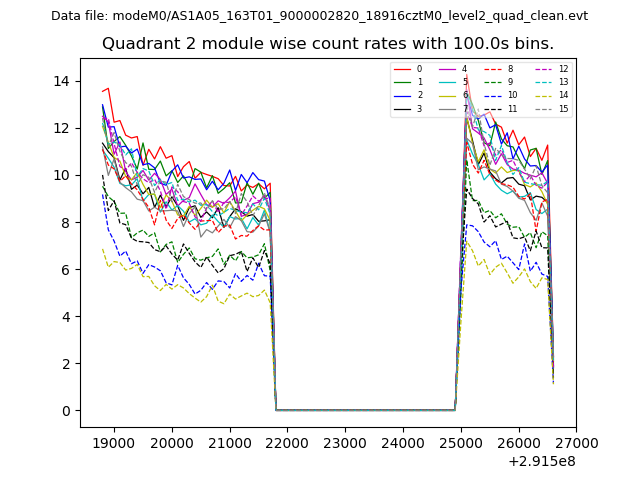
| Module-wise count rates for Quadrant B Data is divided into 100 sec bins |
 |
 |
| Module-wise count rates for Quadrant C Data is divided into 100 sec bins |
 |
 |
| Module-wise count rates for Quadrant D Data is divided into 100 sec bins |
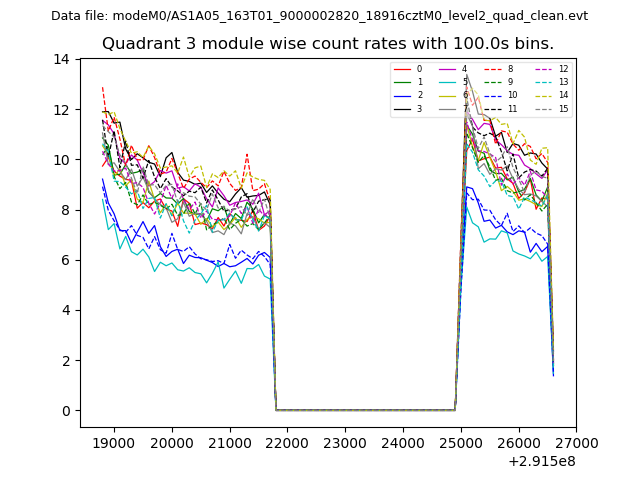 |
 |
| Parameter | Plot |
|---|---|
| CZT HV Monitor | 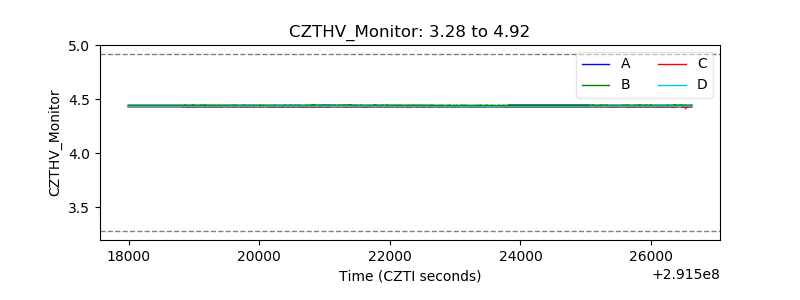 |
| D_VDD |  |
| Temperature 1 | 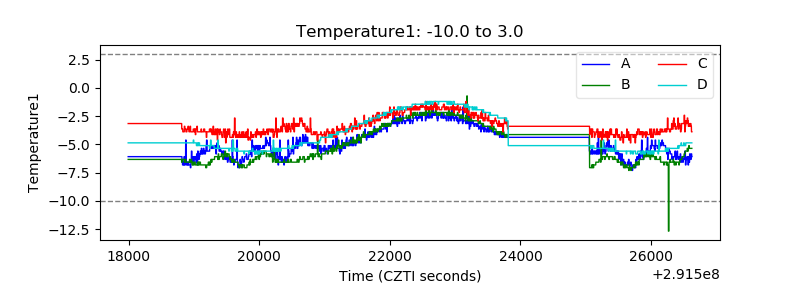 |
| Veto HV Monitor | 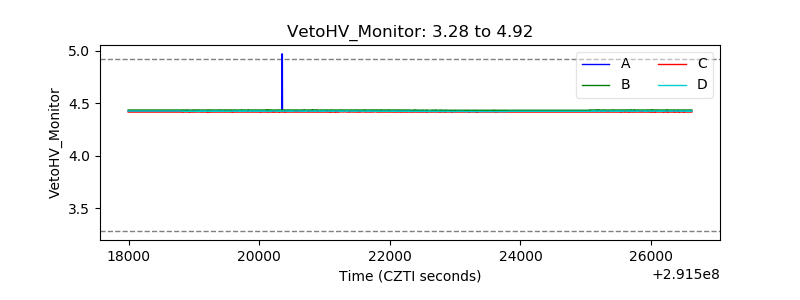 |
| Veto LLD |  |
| Alpha Counter | 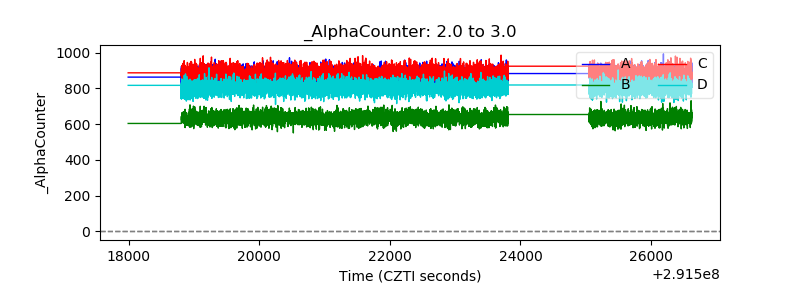 |
| _CPM_Rate | 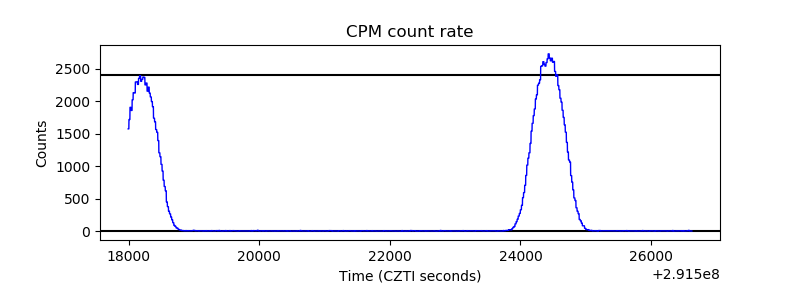 |
| CZT Counter | 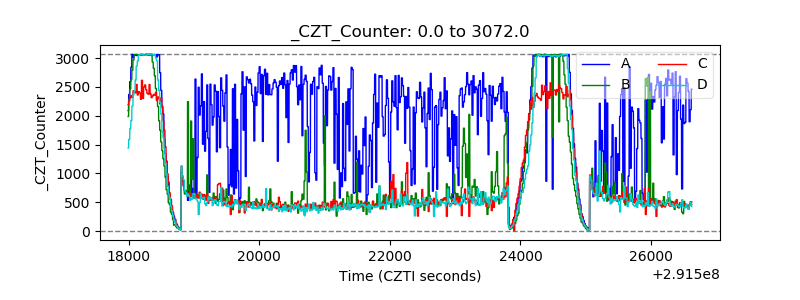 |
| +2.5 Volts monitor |  |
| +5 Volts monitor |  |
| _ROLL_ROT |  |
| _Roll_DEC | 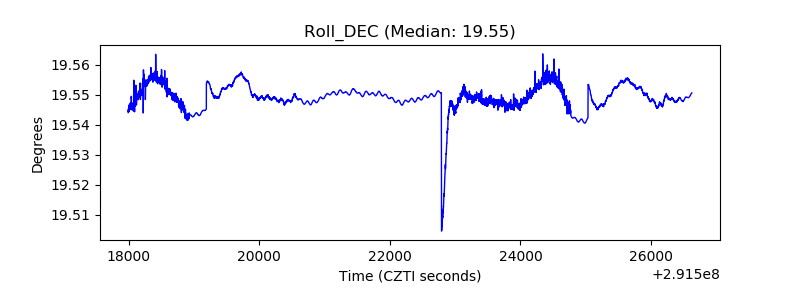 |
| _Roll_RA | 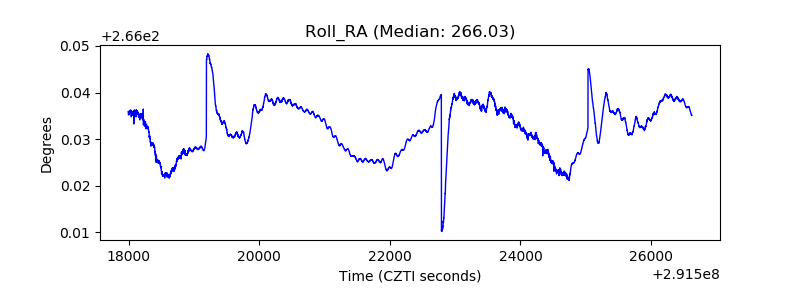 |
| Veto Counter | 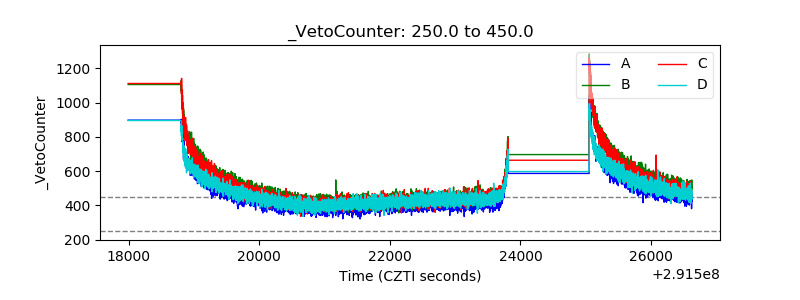 |