| Param | Original file | Final file |
|---|---|---|
| Filename | modeM0/AS1A05_163T01_9000002820_18917cztM0_level2.evt | modeM0/AS1A05_163T01_9000002820_18917cztM0_level2_quad_clean.evt |
| Size (bytes) | 758,260,800 | 82,494,720 |
| Size | 723.1 MB | 78.7 MB |
| Events in quadrant A | 11,449,012 | 352,321 |
| Events in quadrant B | 4,887,464 | 593,498 |
| Events in quadrant C | 3,159,819 | 572,727 |
| Events in quadrant D | 3,056,860 | 554,633 |
| Mode M0 | |||
|---|---|---|---|
| Quadrant | BADHDUFLAG | Total packets | Discarded packets |
| A | 0 | 38114 | 1 |
| B | 0 | 18361 | 1 |
| C | 0 | 12914 | 1 |
| D | 0 | 12948 | 1 |
| Mode SS | |||
|---|---|---|---|
| Quadrant | BADHDUFLAG | Total packets | Discarded packets |
| A | 0 | 122 | 0 |
| B | 0 | 122 | 0 |
| C | 0 | 122 | 0 |
| D | 0 | 122 | 0 |
| Mode M9 | |||
|---|---|---|---|
| Quadrant | BADHDUFLAG | Total packets | Discarded packets |
| A | 0 | 14 | 0 |
| B | 0 | 14 | 0 |
| C | 0 | 14 | 0 |
| D | 0 | 14 | 0 |
| Quadrant | Total seconds | Saturated seconds | Saturation percentage |
|---|---|---|---|
| A | 6071 | 4233 | 69.724922% |
| B | 6071 | 794 | 13.078570% |
| C | 6072 | 68 | 1.119895% |
| D | 6072 | 26 | 0.428195% |
Noise dominated data is calculated using 1-second bins in cleaned event files. If a bin has >2000 counts, and if more than 50% of those come from <1% of pixels, then it is considered to be noise-dominated and hence unusable.
| Quadrant | # 1 sec bins | Bins with >0 counts | Bins with >2000 counts | High rate bins dominated by noise | Noise dominated (total time) | Noise dominated (detector-on time) | Marked lightcurve |
|---|---|---|---|---|---|---|---|
| A | 7390 | 6070 | 2833 | 2833 | 38.34% | 46.67% | 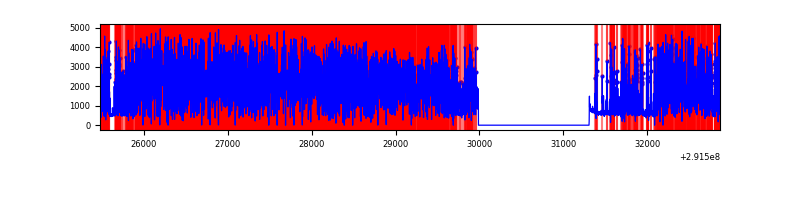 |
| B | 7391 | 6072 | 512 | 512 | 6.93% | 8.43% | 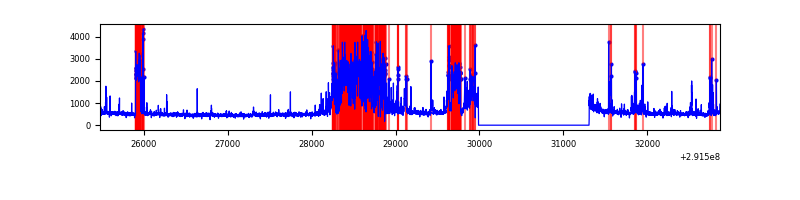 |
| C | 7392 | 6073 | 0 | 0 | 0.00% | 0.00% | 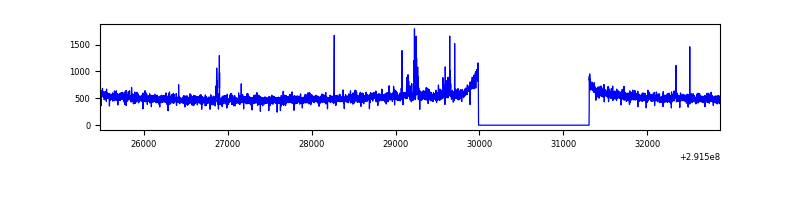 |
| D | 7392 | 6073 | 7 | 7 | 0.09% | 0.12% | 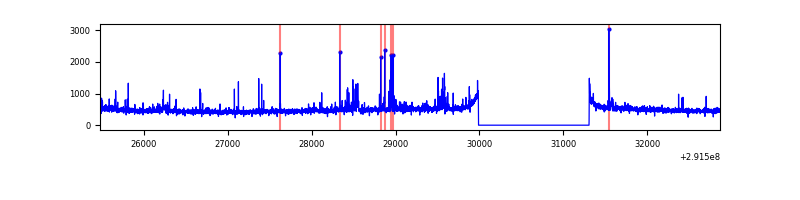 |
Top three noisy pixels from each quadrant. If the there are fewer than three noisy pixels in the level2.evt file, extra rows are filled as -1
| Pixel properties | Quadrant properties | ||||||
|---|---|---|---|---|---|---|---|
| Quadrant | DetID | PixID | Counts | Sigma | Mean | Median | Sigma |
| A | 14 | 235 | 9705896 | 106765.07 | 452 | 444 | 90.9 |
| A | 13 | 254 | 4435 | 43.9 | 452 | 444 | 90.9 |
| A | 0 | 226 | 4011 | 39.24 | 452 | 444 | 90.9 |
| B | 3 | 112 | 1648776 | 11827.05 | 751 | 734 | 139.3 |
| B | 5 | 250 | 129333 | 922.88 | 751 | 734 | 139.3 |
| B | 7 | 220 | 82129 | 584.13 | 751 | 734 | 139.3 |
| C | 14 | 238 | 120194 | 687.25 | 749 | 753 | 173.8 |
| C | 3 | 233 | 78471 | 447.18 | 749 | 753 | 173.8 |
| C | 6 | 96 | 42049 | 237.61 | 749 | 753 | 173.8 |
| D | 14 | 34 | 68053 | 371.18 | 757 | 736 | 181.4 |
| D | 7 | 238 | 58534 | 318.69 | 757 | 736 | 181.4 |
| D | 2 | 234 | 22321 | 119.02 | 757 | 736 | 181.4 |
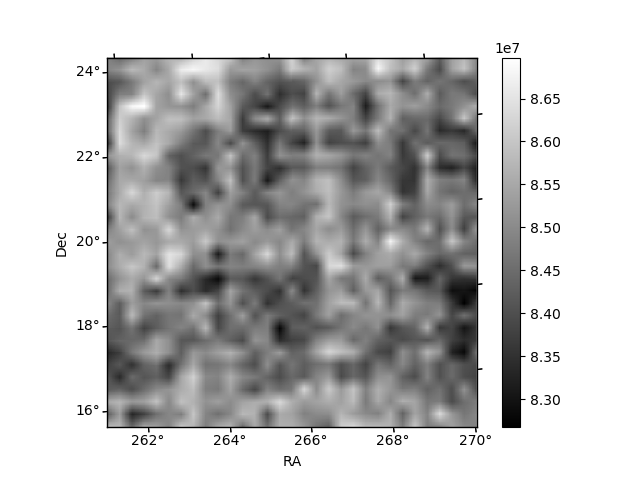
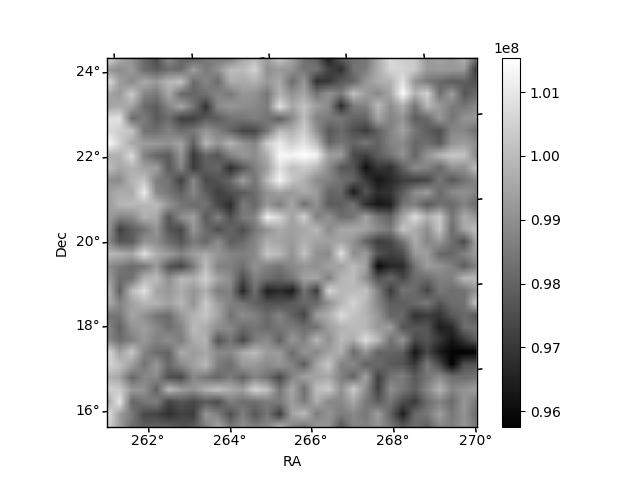
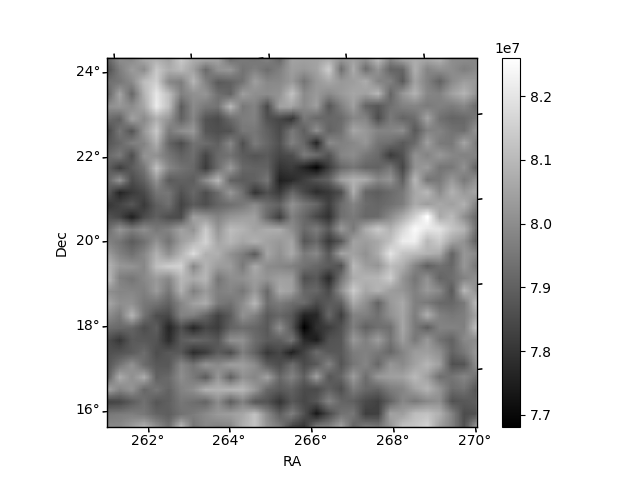
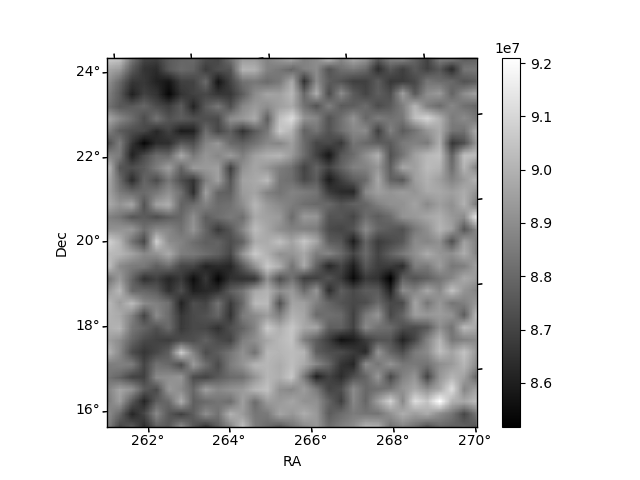
Histogram calculated using DETX and DETY for each event in the final _common_clean file
| Quadrant A | 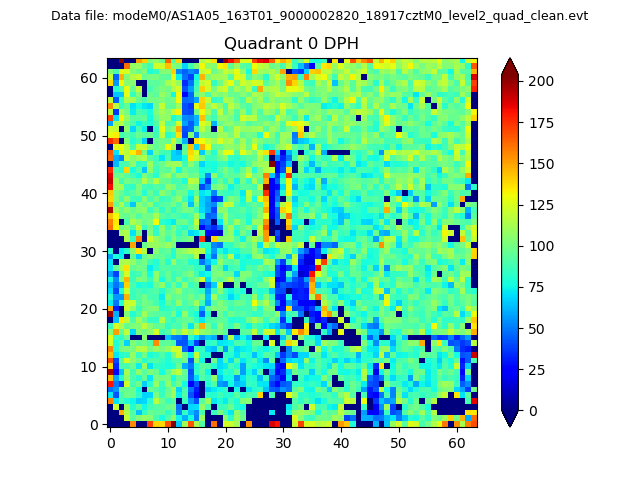 |
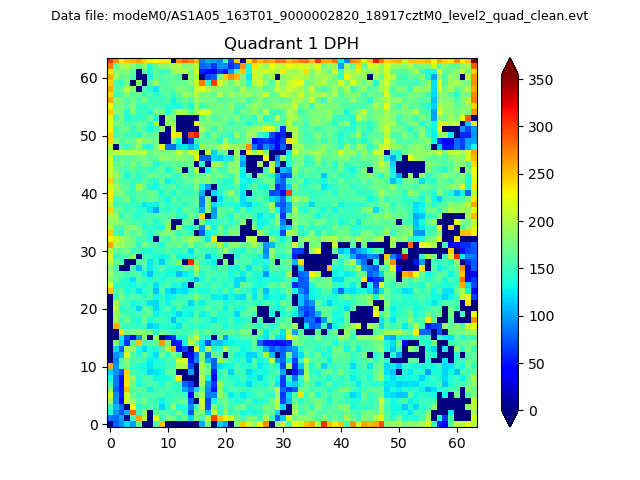 |
Quadrant B |
|---|---|---|---|
| Quadrant D | 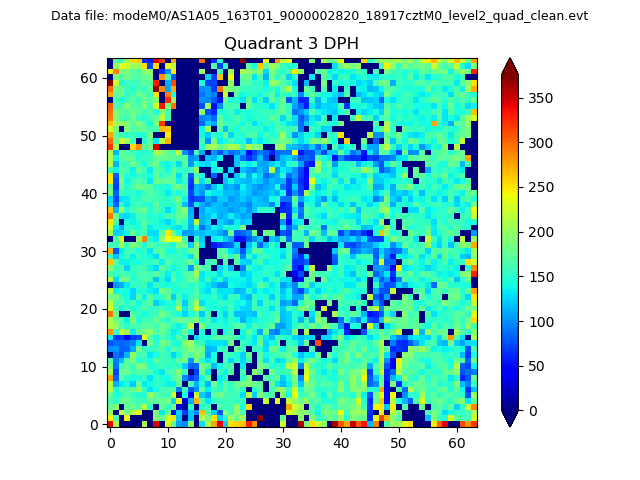 |
 |
Quadrant C |
| Plot type | Count rate plots | Images |
|---|---|---|
| Comparison with Poisson distribution Blue bars denote a histogram of data divided into 1 sec bins. Red curve is a Poisson curve with rate = median count rate of data. |
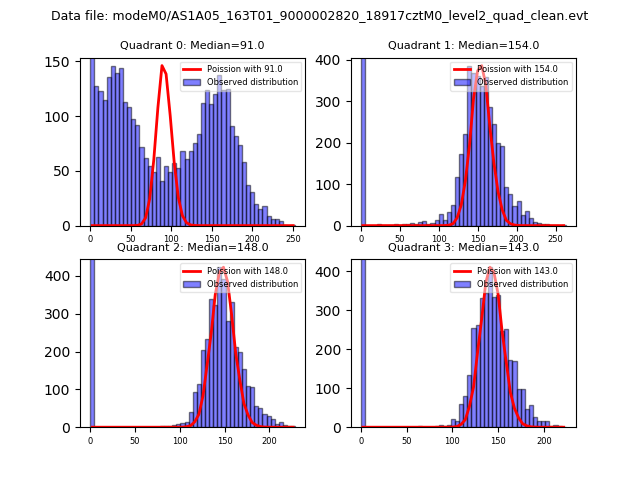 |
 |
| Quadrant-wise count rates Data is divided into 100 sec bins |
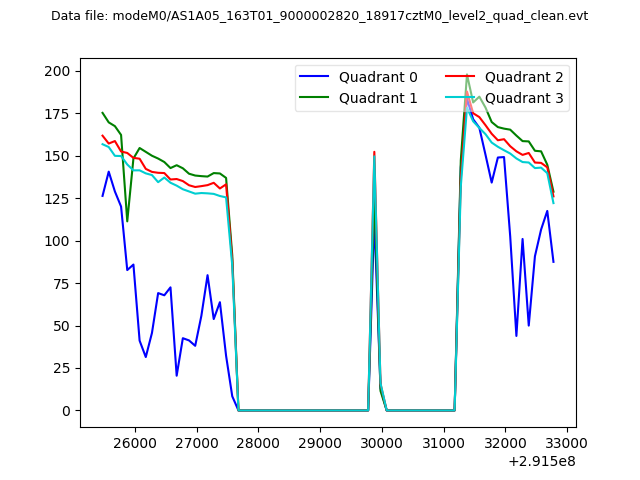 |
|
| Module-wise count rates for Quadrant A Data is divided into 100 sec bins |
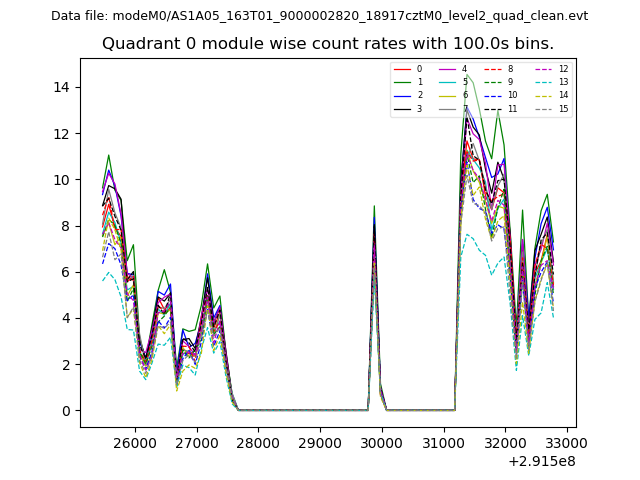 |
 |
| Module-wise count rates for Quadrant B Data is divided into 100 sec bins |
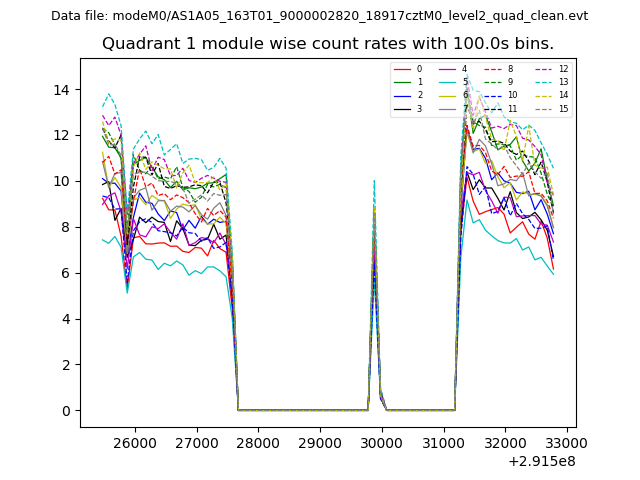 |
 |
| Module-wise count rates for Quadrant C Data is divided into 100 sec bins |
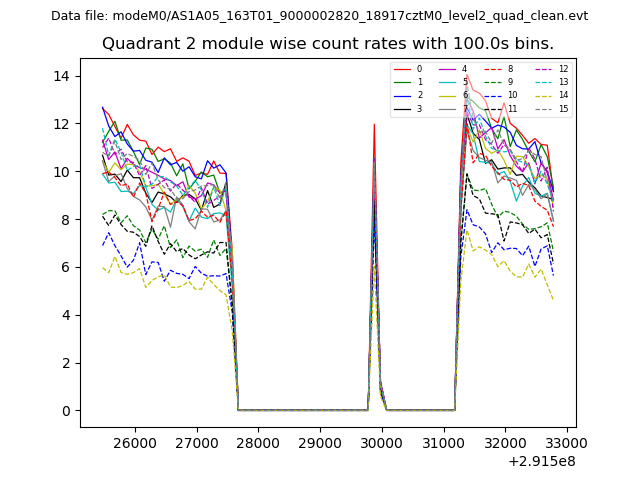 |
 |
| Module-wise count rates for Quadrant D Data is divided into 100 sec bins |
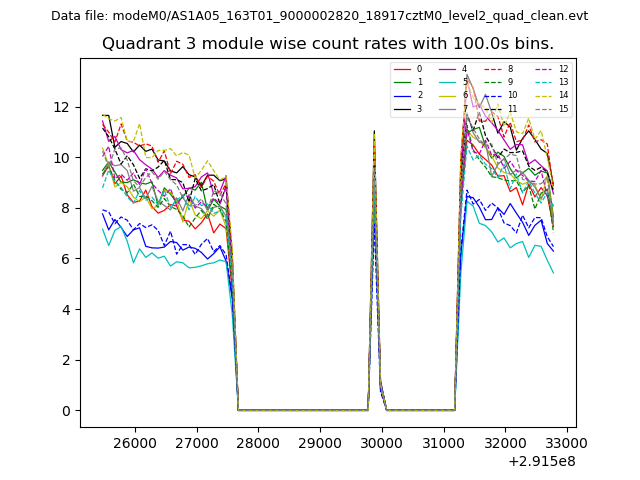 |
 |
| Parameter | Plot |
|---|---|
| CZT HV Monitor | 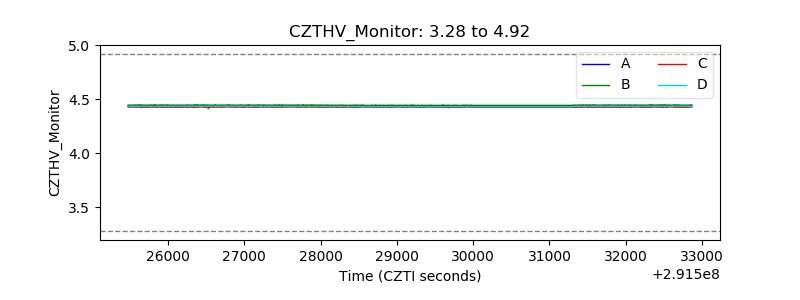 |
| D_VDD | 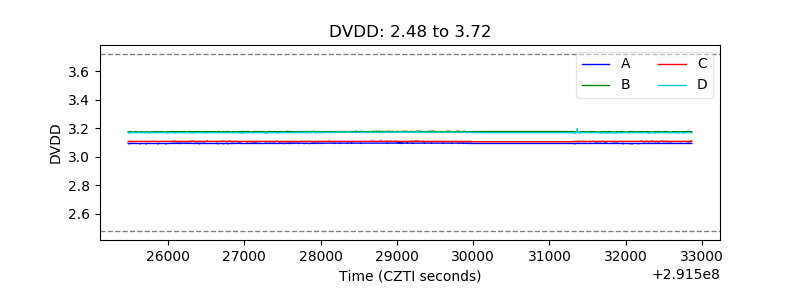 |
| Temperature 1 | 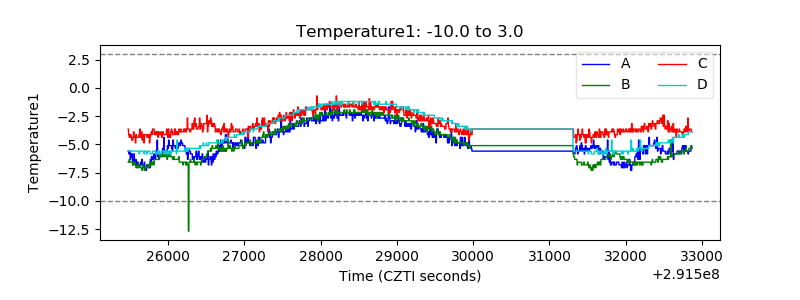 |
| Veto HV Monitor | 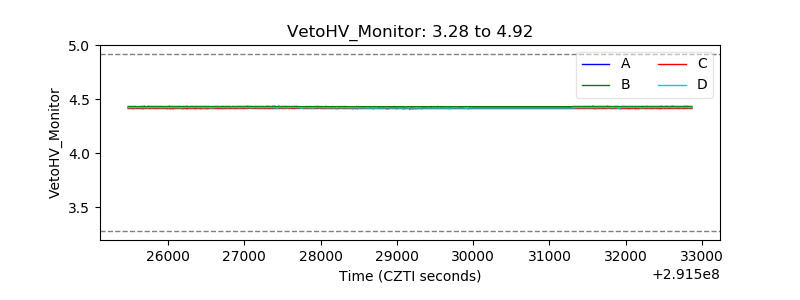 |
| Veto LLD | 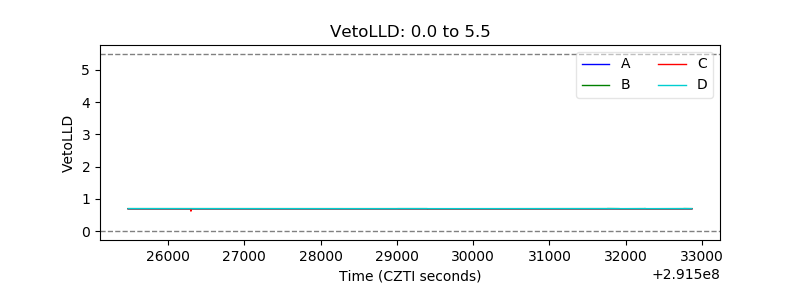 |
| Alpha Counter | 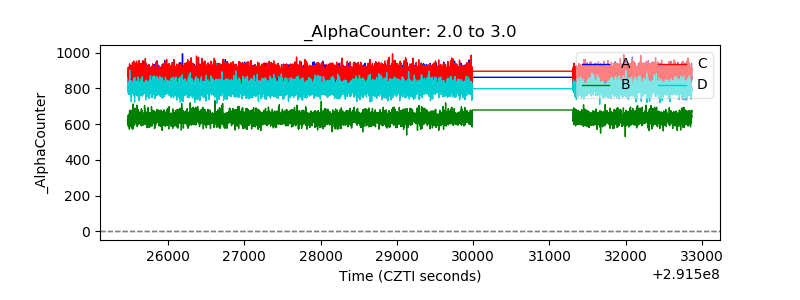 |
| _CPM_Rate | 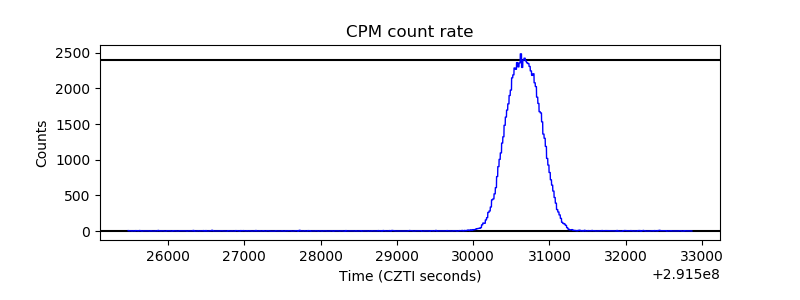 |
| CZT Counter |  |
| +2.5 Volts monitor | 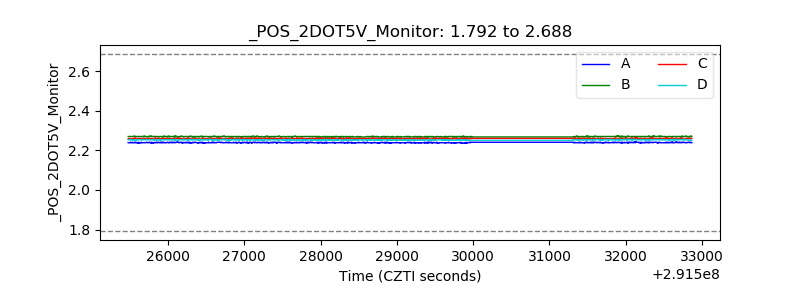 |
| +5 Volts monitor |  |
| _ROLL_ROT | 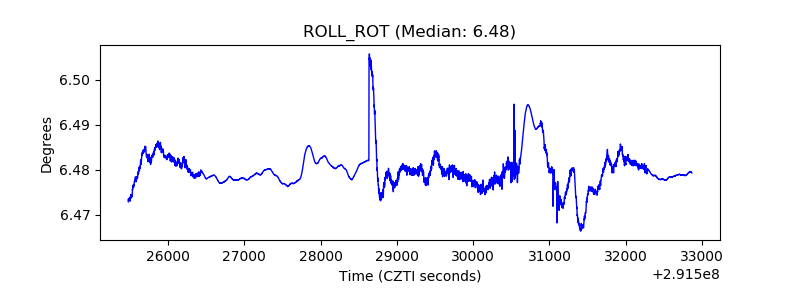 |
| _Roll_DEC | 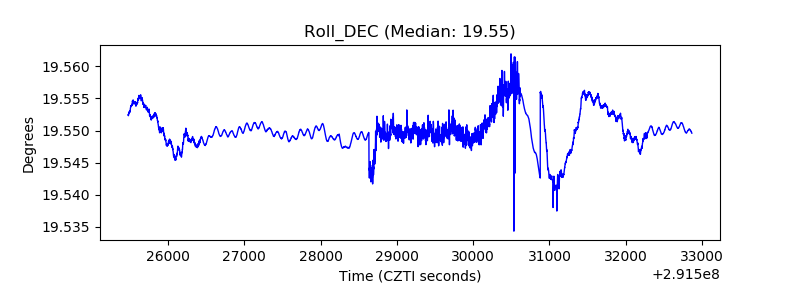 |
| _Roll_RA |  |
| Veto Counter | 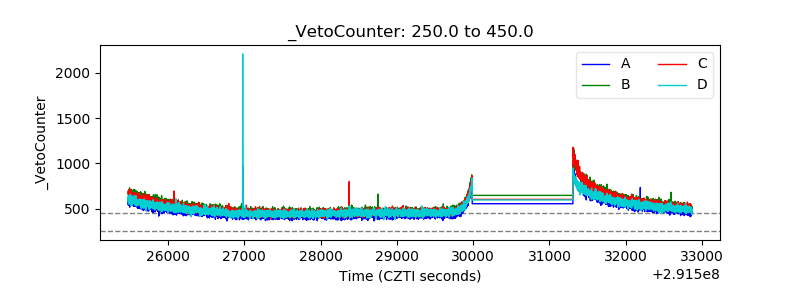 |