| Param | Original file | Final file |
|---|---|---|
| Filename | modeM0/AS1A05_163T01_9000002820_18918cztM0_level2.evt | modeM0/AS1A05_163T01_9000002820_18918cztM0_level2_quad_clean.evt |
| Size (bytes) | 713,822,400 | 88,577,280 |
| Size | 680.8 MB | 84.5 MB |
| Events in quadrant A | 10,641,237 | 411,632 |
| Events in quadrant B | 3,952,980 | 633,861 |
| Events in quadrant C | 3,253,044 | 608,133 |
| Events in quadrant D | 3,347,718 | 591,698 |
| Mode M0 | |||
|---|---|---|---|
| Quadrant | BADHDUFLAG | Total packets | Discarded packets |
| A | 0 | 35900 | 8 |
| B | 0 | 15611 | 1 |
| C | 0 | 13215 | 1 |
| D | 0 | 13798 | 1 |
| Mode SS | |||
|---|---|---|---|
| Quadrant | BADHDUFLAG | Total packets | Discarded packets |
| A | 0 | 126 | 0 |
| B | 0 | 126 | 0 |
| C | 0 | 126 | 0 |
| D | 0 | 126 | 0 |
| Mode M9 | |||
|---|---|---|---|
| Quadrant | BADHDUFLAG | Total packets | Discarded packets |
| A | 0 | 14 | 0 |
| B | 0 | 14 | 0 |
| C | 0 | 14 | 0 |
| D | 0 | 14 | 0 |
| Quadrant | Total seconds | Saturated seconds | Saturation percentage |
|---|---|---|---|
| A | 6251 | 3648 | 58.358663% |
| B | 6252 | 155 | 2.479207% |
| C | 6252 | 56 | 0.895713% |
| D | 6252 | 41 | 0.655790% |
Noise dominated data is calculated using 1-second bins in cleaned event files. If a bin has >2000 counts, and if more than 50% of those come from <1% of pixels, then it is considered to be noise-dominated and hence unusable.
| Quadrant | # 1 sec bins | Bins with >0 counts | Bins with >2000 counts | High rate bins dominated by noise | Noise dominated (total time) | Noise dominated (detector-on time) | Marked lightcurve |
|---|---|---|---|---|---|---|---|
| A | 7611 | 6248 | 2364 | 2364 | 31.06% | 37.84% | 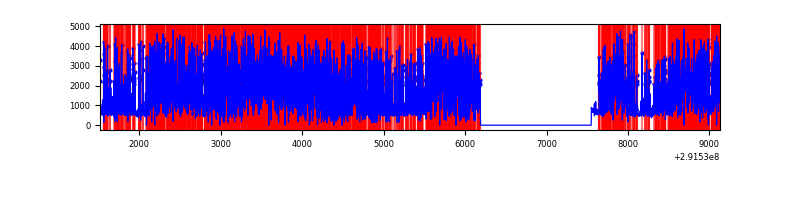 |
| B | 7613 | 6253 | 68 | 68 | 0.89% | 1.09% | 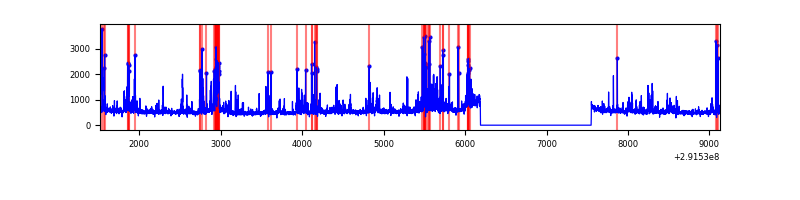 |
| C | 7613 | 6253 | 0 | 0 | 0.00% | 0.00% | 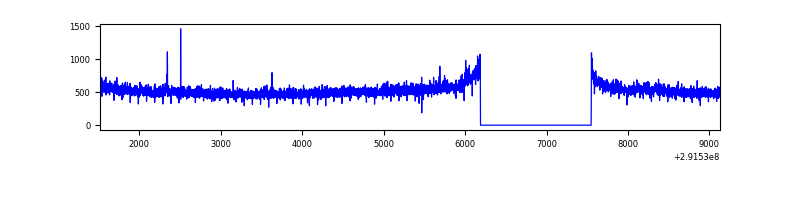 |
| D | 7613 | 6253 | 22 | 22 | 0.29% | 0.35% | 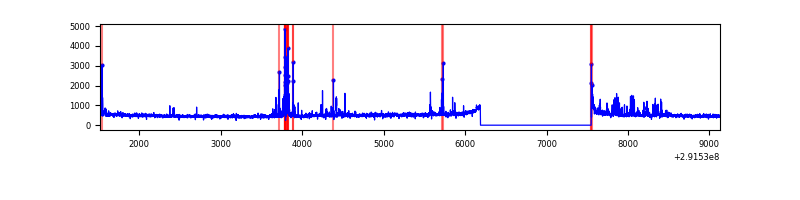 |
Top three noisy pixels from each quadrant. If the there are fewer than three noisy pixels in the level2.evt file, extra rows are filled as -1
| Pixel properties | Quadrant properties | ||||||
|---|---|---|---|---|---|---|---|
| Quadrant | DetID | PixID | Counts | Sigma | Mean | Median | Sigma |
| A | 14 | 235 | 8555011 | 79506.46 | 541 | 532 | 107.6 |
| A | 13 | 254 | 5517 | 46.33 | 541 | 532 | 107.6 |
| A | 0 | 226 | 4699 | 38.73 | 541 | 532 | 107.6 |
| B | 3 | 112 | 638785 | 4159.55 | 816 | 799 | 153.4 |
| B | 7 | 220 | 24886 | 157.04 | 816 | 799 | 153.4 |
| B | 0 | 189 | 23330 | 146.9 | 816 | 799 | 153.4 |
| C | 14 | 238 | 126153 | 692.71 | 782 | 788 | 181.0 |
| C | 3 | 233 | 72903 | 398.47 | 782 | 788 | 181.0 |
| C | 6 | 96 | 7790 | 38.69 | 782 | 788 | 181.0 |
| D | 9 | 1 | 155902 | 796.56 | 793 | 769 | 194.8 |
| D | 12 | 218 | 118431 | 604.16 | 793 | 769 | 194.8 |
| D | 7 | 238 | 32659 | 163.75 | 793 | 769 | 194.8 |
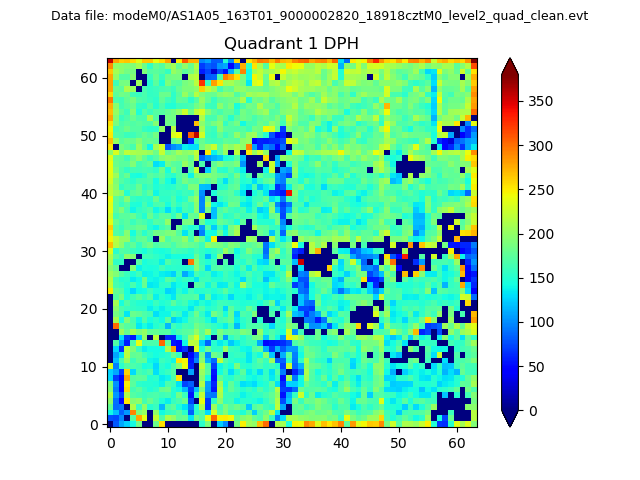
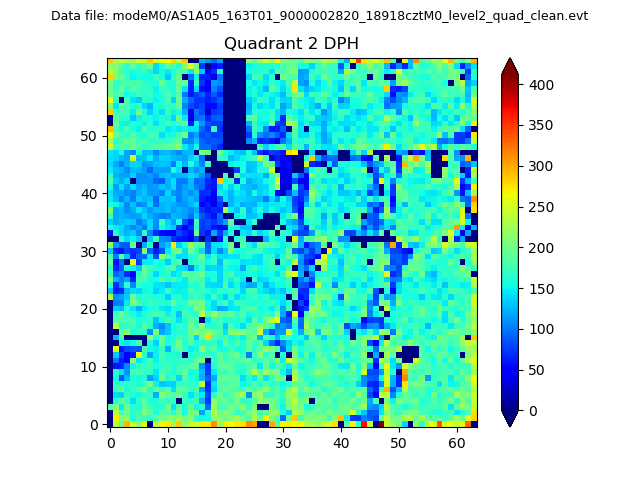
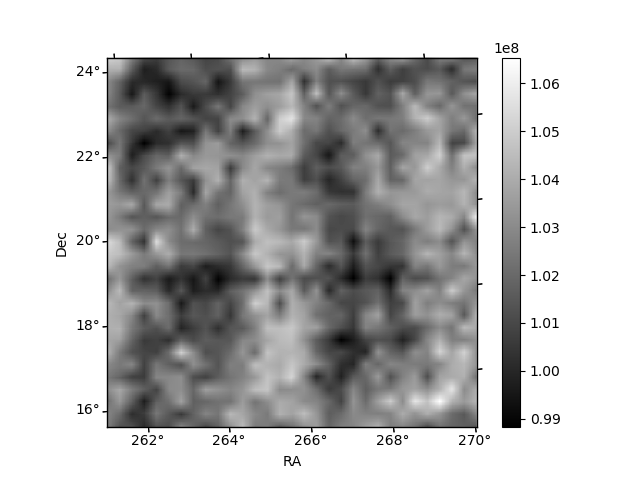
Histogram calculated using DETX and DETY for each event in the final _common_clean file
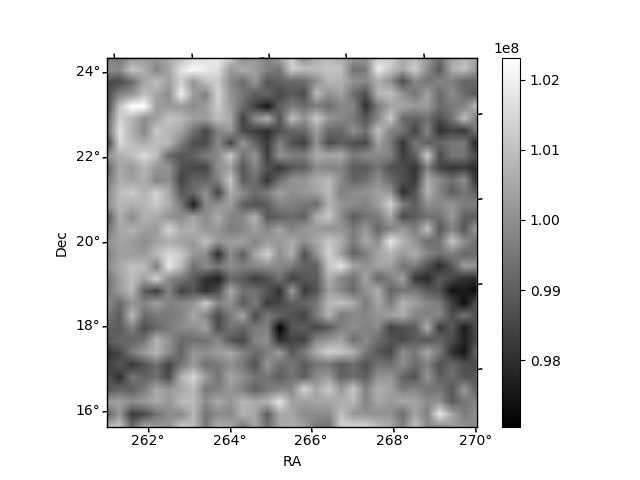
| Quadrant A |  |
 |
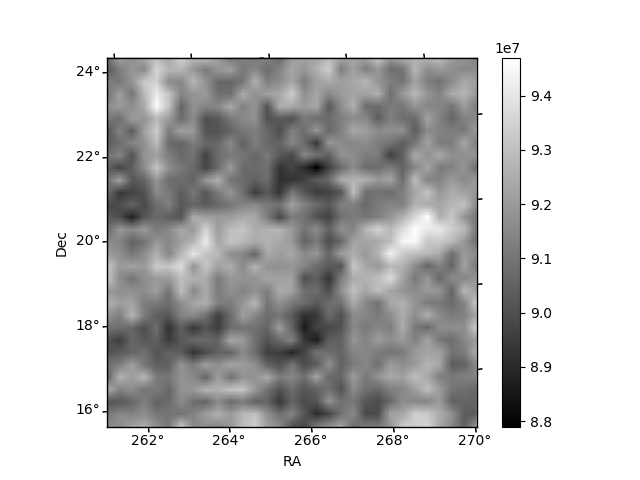
Quadrant B |
|---|---|---|---|
| Quadrant D |  |
 |
Quadrant C |
| Plot type | Count rate plots | Images |
|---|---|---|
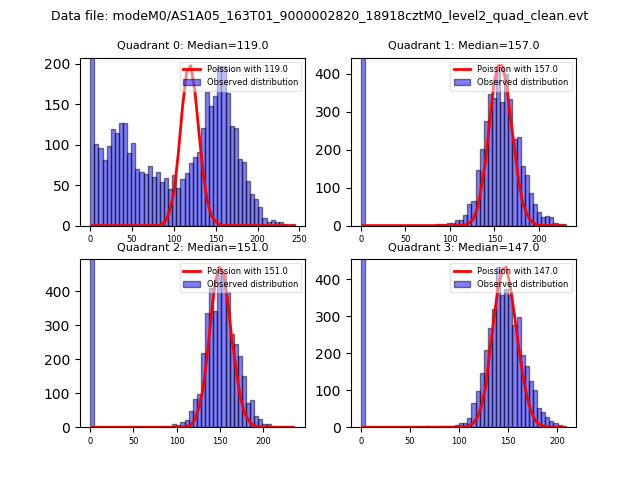
| Comparison with Poisson distribution Blue bars denote a histogram of data divided into 1 sec bins. Red curve is a Poisson curve with rate = median count rate of data. |
 |
 |
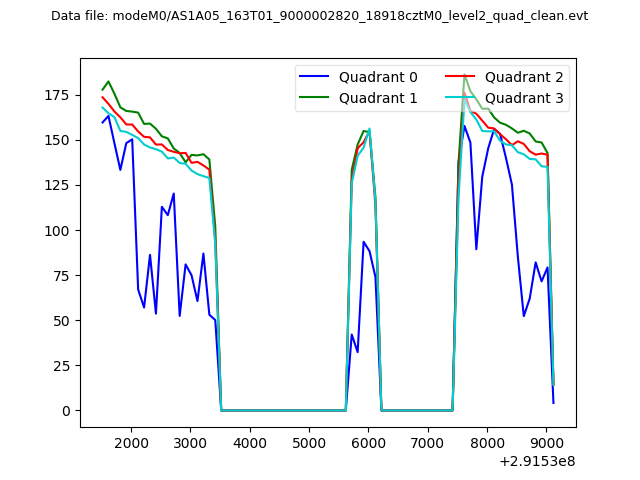
| Quadrant-wise count rates Data is divided into 100 sec bins |
 |
|
| Module-wise count rates for Quadrant A Data is divided into 100 sec bins |
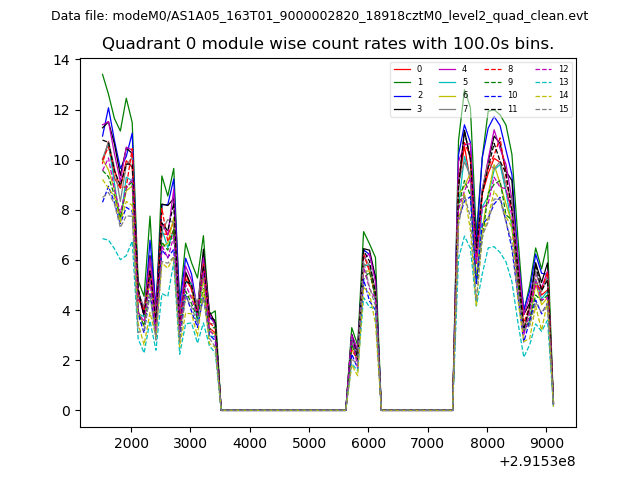 |
 |
| Module-wise count rates for Quadrant B Data is divided into 100 sec bins |
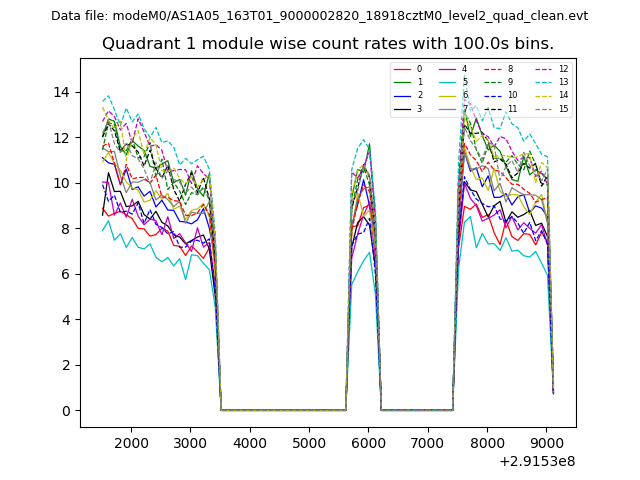 |
 |
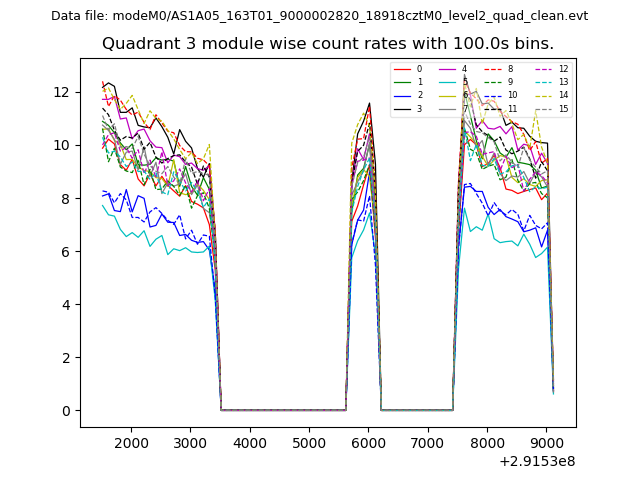
| Module-wise count rates for Quadrant C Data is divided into 100 sec bins |
 |
 |
| Module-wise count rates for Quadrant D Data is divided into 100 sec bins |
 |
 |
| Parameter | Plot |
|---|---|
| CZT HV Monitor | 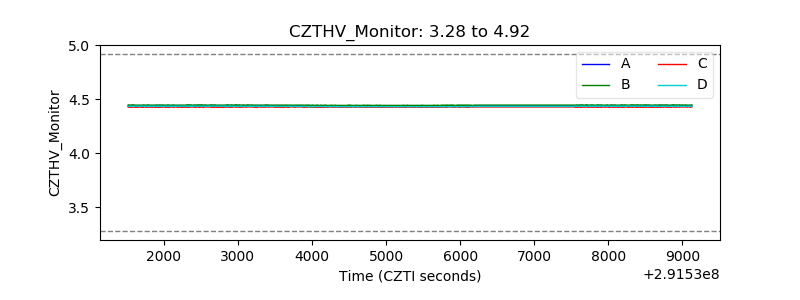 |
| D_VDD | 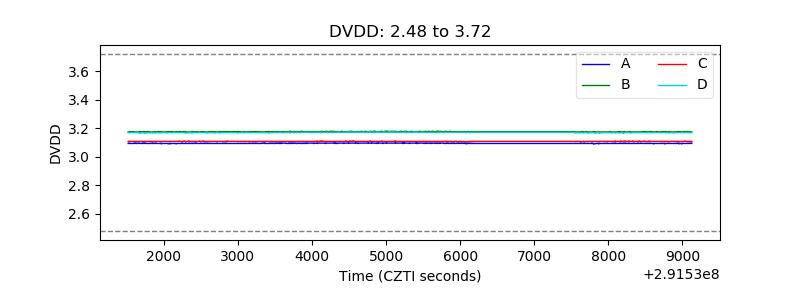 |
| Temperature 1 |  |
| Veto HV Monitor | 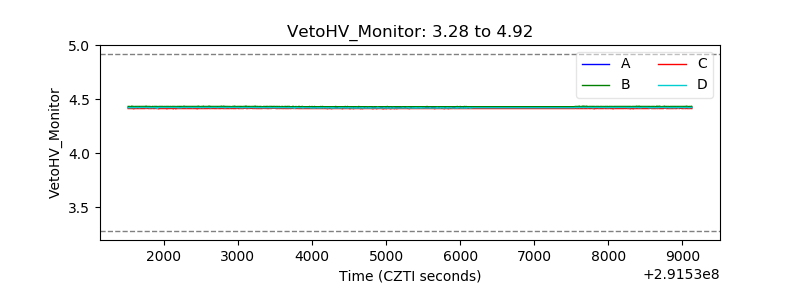 |
| Veto LLD | 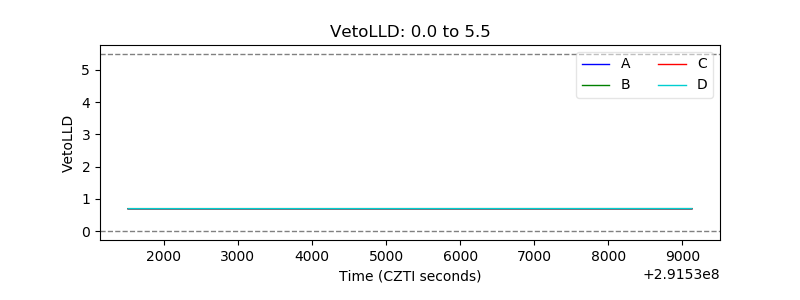 |
| Alpha Counter | 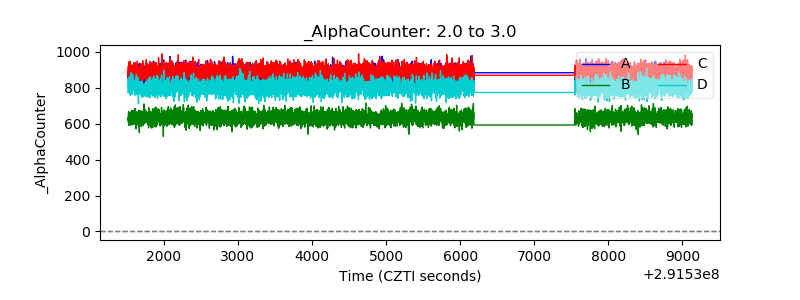 |
| _CPM_Rate | 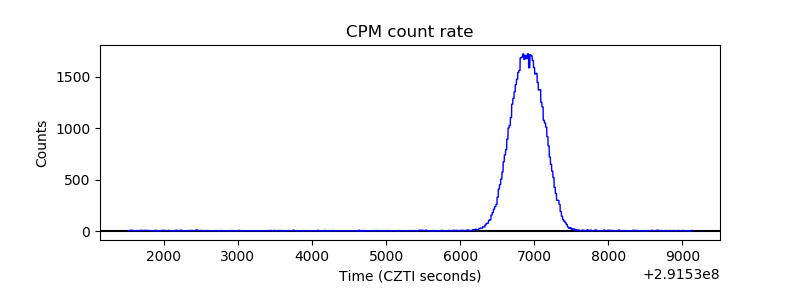 |
| CZT Counter | 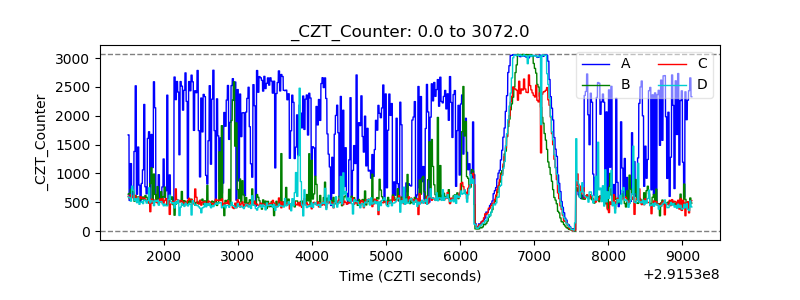 |
| +2.5 Volts monitor |  |
| +5 Volts monitor |  |
| _ROLL_ROT | 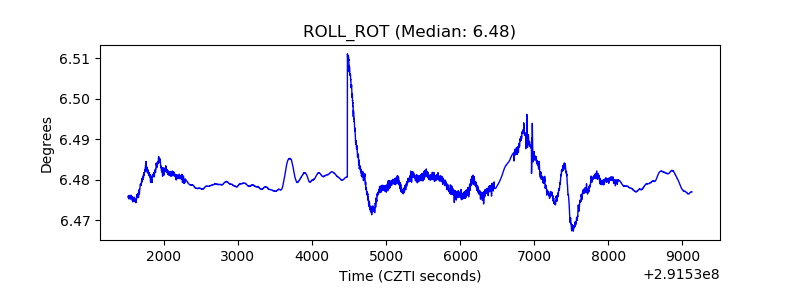 |
| _Roll_DEC | 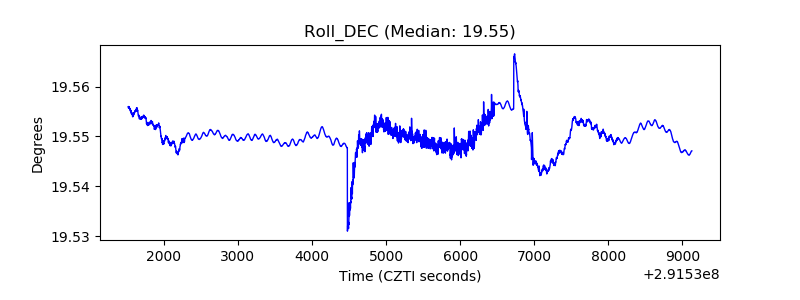 |
| _Roll_RA |  |
| Veto Counter | 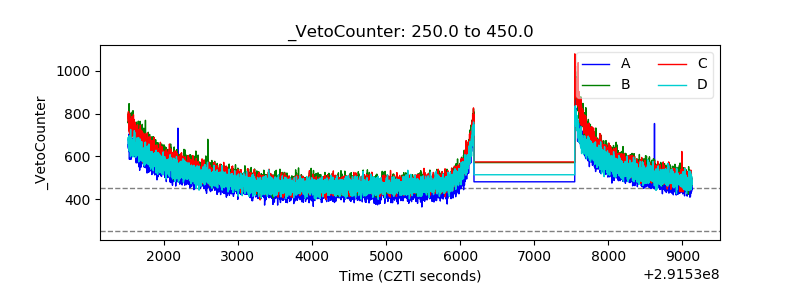 |