| Param | Original file | Final file |
|---|---|---|
| Filename | modeM0/AS1A05_163T01_9000002820_18919cztM0_level2.evt | modeM0/AS1A05_163T01_9000002820_18919cztM0_level2_quad_clean.evt |
| Size (bytes) | 663,151,680 | 78,618,240 |
| Size | 632.4 MB | 75.0 MB |
| Events in quadrant A | 9,028,525 | 378,523 |
| Events in quadrant B | 4,030,661 | 551,163 |
| Events in quadrant C | 3,097,887 | 529,042 |
| Events in quadrant D | 3,527,802 | 509,711 |
| Mode M0 | |||
|---|---|---|---|
| Quadrant | BADHDUFLAG | Total packets | Discarded packets |
| A | 0 | 30791 | 1 |
| B | 0 | 15638 | 1 |
| C | 0 | 12494 | 1 |
| D | 0 | 14135 | 1 |
| Mode SS | |||
|---|---|---|---|
| Quadrant | BADHDUFLAG | Total packets | Discarded packets |
| A | 0 | 120 | 0 |
| B | 0 | 120 | 0 |
| C | 0 | 120 | 0 |
| D | 0 | 120 | 0 |
| Mode M9 | |||
|---|---|---|---|
| Quadrant | BADHDUFLAG | Total packets | Discarded packets |
| A | 0 | 13 | 0 |
| B | 0 | 13 | 0 |
| C | 0 | 13 | 0 |
| D | 0 | 13 | 0 |
| Quadrant | Total seconds | Saturated seconds | Saturation percentage |
|---|---|---|---|
| A | 5885 | 2878 | 48.903993% |
| B | 5885 | 274 | 4.655905% |
| C | 5886 | 94 | 1.597010% |
| D | 5886 | 167 | 2.837241% |
Noise dominated data is calculated using 1-second bins in cleaned event files. If a bin has >2000 counts, and if more than 50% of those come from <1% of pixels, then it is considered to be noise-dominated and hence unusable.
| Quadrant | # 1 sec bins | Bins with >0 counts | Bins with >2000 counts | High rate bins dominated by noise | Noise dominated (total time) | Noise dominated (detector-on time) | Marked lightcurve |
|---|---|---|---|---|---|---|---|
| A | 7165 | 5886 | 1841 | 1841 | 25.69% | 31.28% | 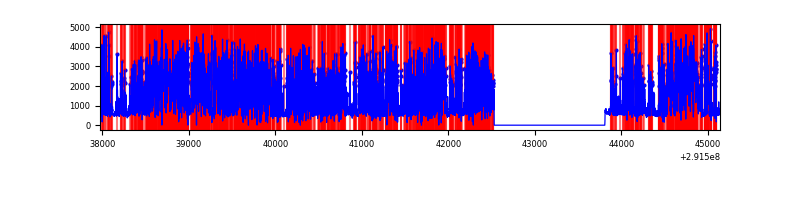 |
| B | 7165 | 5886 | 111 | 111 | 1.55% | 1.89% | 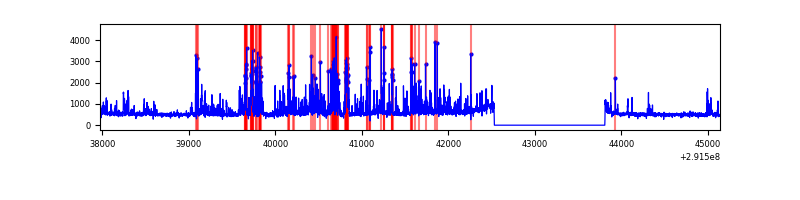 |
| C | 7166 | 5887 | 1 | 1 | 0.01% | 0.02% | 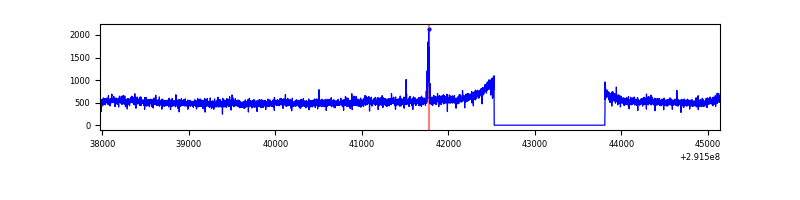 |
| D | 7166 | 5887 | 100 | 100 | 1.40% | 1.70% | 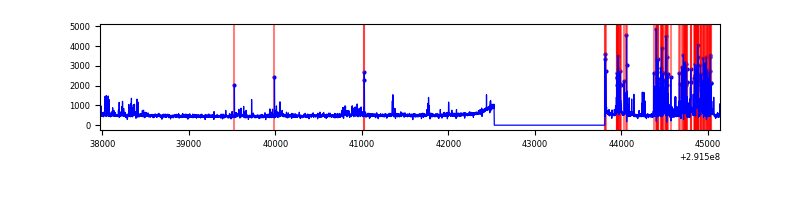 |
Top three noisy pixels from each quadrant. If the there are fewer than three noisy pixels in the level2.evt file, extra rows are filled as -1
| Pixel properties | Quadrant properties | ||||||
|---|---|---|---|---|---|---|---|
| Quadrant | DetID | PixID | Counts | Sigma | Mean | Median | Sigma |
| A | 14 | 235 | 6877198 | 61386.39 | 558 | 548 | 112.0 |
| A | 13 | 254 | 5875 | 47.55 | 558 | 548 | 112.0 |
| A | 0 | 226 | 4952 | 39.31 | 558 | 548 | 112.0 |
| B | 3 | 112 | 925472 | 6351.12 | 755 | 739 | 145.6 |
| B | 10 | 247 | 34813 | 234.02 | 755 | 739 | 145.6 |
| B | 7 | 220 | 32560 | 218.55 | 755 | 739 | 145.6 |
| C | 3 | 233 | 117048 | 688.56 | 730 | 735 | 168.9 |
| C | 14 | 238 | 115654 | 680.31 | 730 | 735 | 168.9 |
| C | 6 | 96 | 18630 | 105.94 | 730 | 735 | 168.9 |
| D | 12 | 218 | 503691 | 2811.36 | 742 | 722 | 178.9 |
| D | 9 | 1 | 111005 | 616.43 | 742 | 722 | 178.9 |
| D | 2 | 234 | 29784 | 162.44 | 742 | 722 | 178.9 |
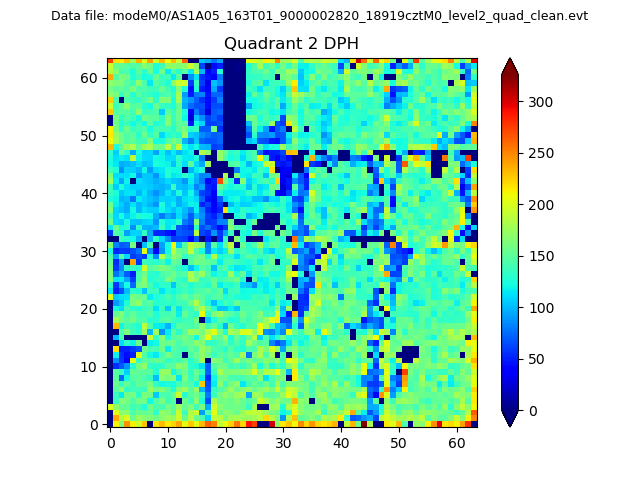
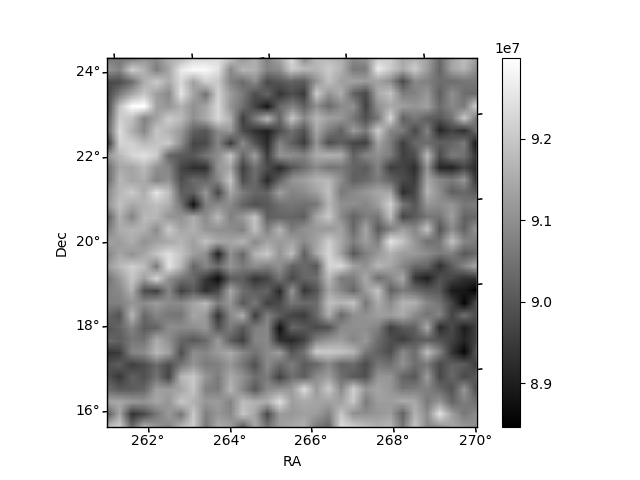
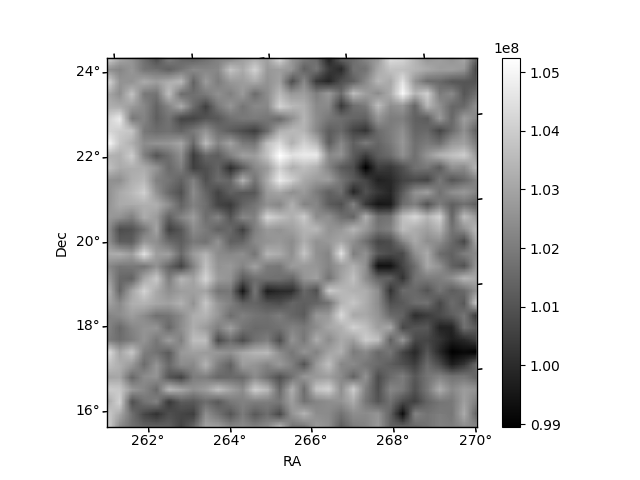
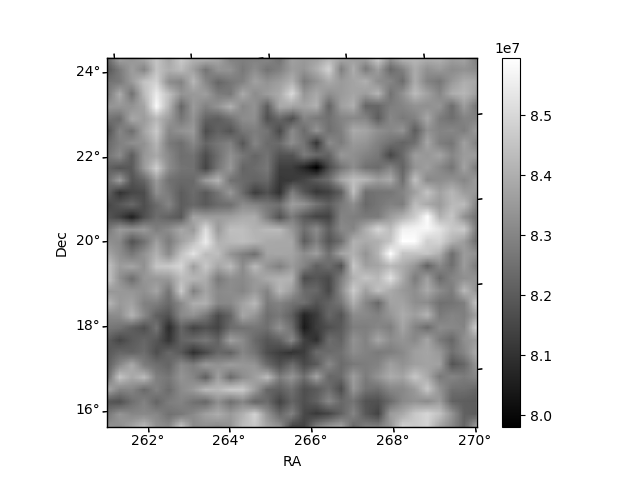
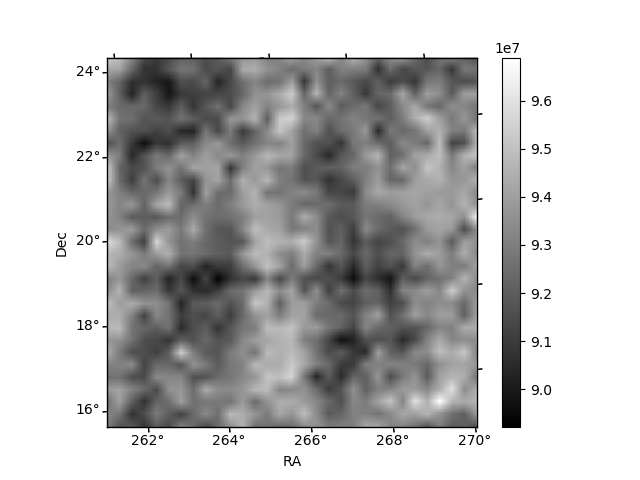
Histogram calculated using DETX and DETY for each event in the final _common_clean file
| Quadrant A |  |
 |
Quadrant B |
|---|---|---|---|
| Quadrant D | 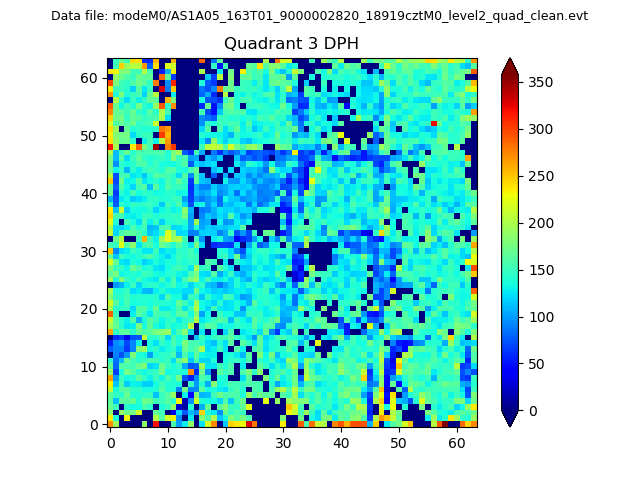 |
 |
Quadrant C |
| Plot type | Count rate plots | Images |
|---|---|---|
| Comparison with Poisson distribution Blue bars denote a histogram of data divided into 1 sec bins. Red curve is a Poisson curve with rate = median count rate of data. |
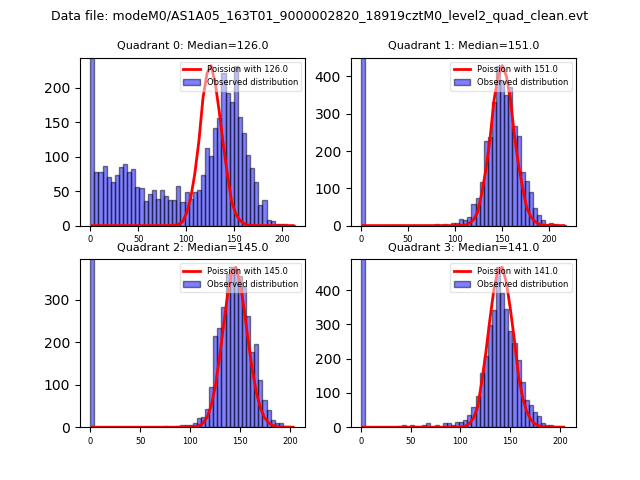 |
 |
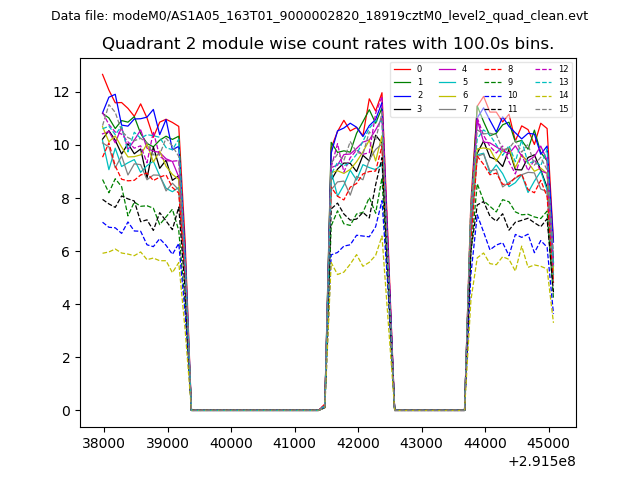
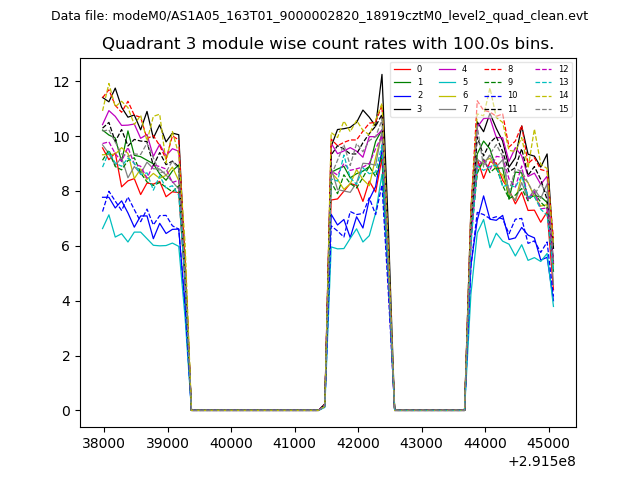
| Quadrant-wise count rates Data is divided into 100 sec bins |
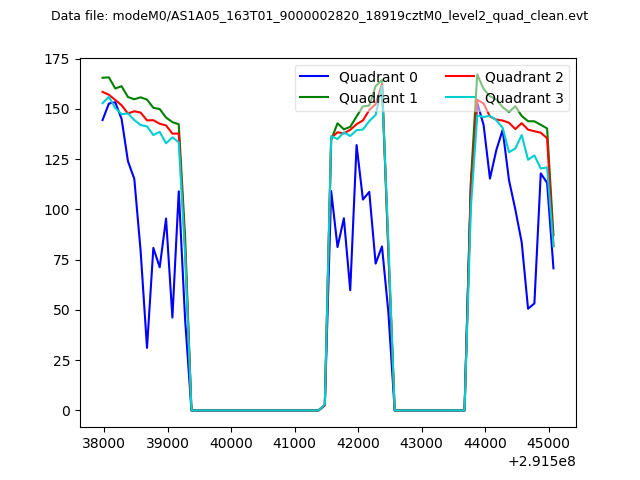 |
|
| Module-wise count rates for Quadrant A Data is divided into 100 sec bins |
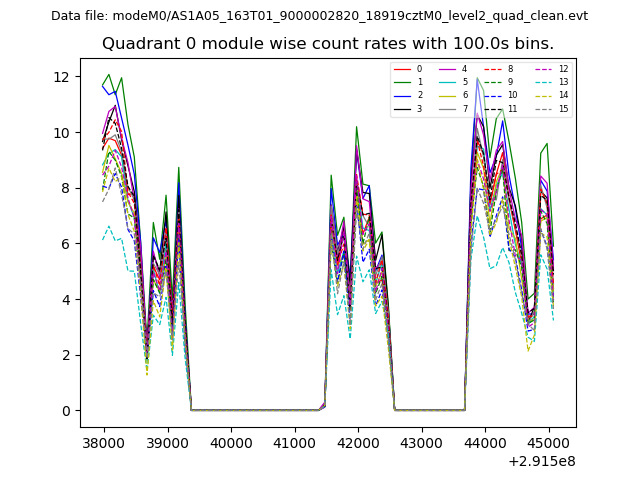 |
 |
| Module-wise count rates for Quadrant B Data is divided into 100 sec bins |
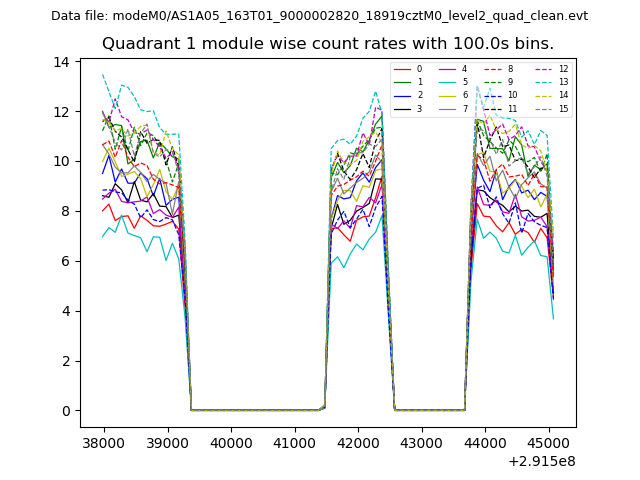 |
 |
| Module-wise count rates for Quadrant C Data is divided into 100 sec bins |
 |
 |
| Module-wise count rates for Quadrant D Data is divided into 100 sec bins |
 |
 |
| Parameter | Plot |
|---|---|
| CZT HV Monitor | 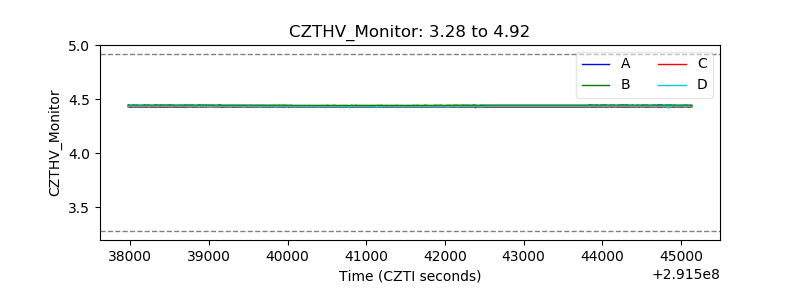 |
| D_VDD | 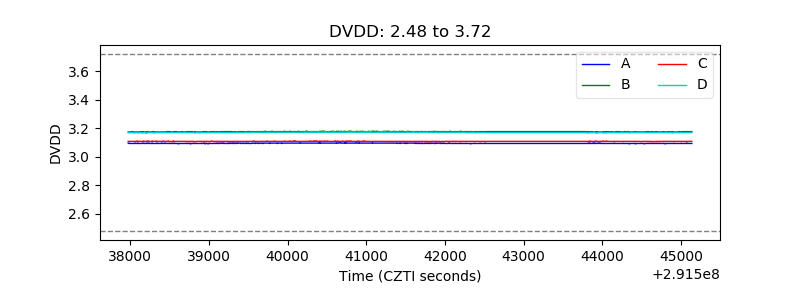 |
| Temperature 1 | 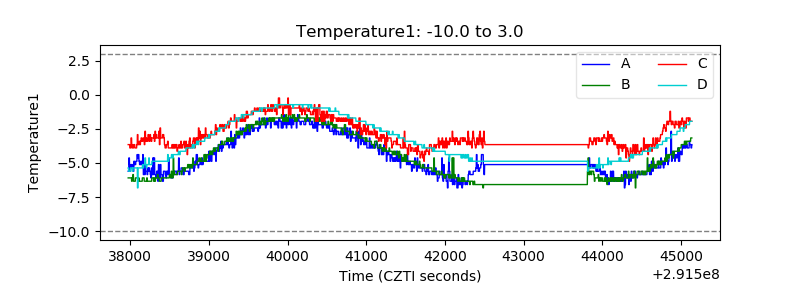 |
| Veto HV Monitor | 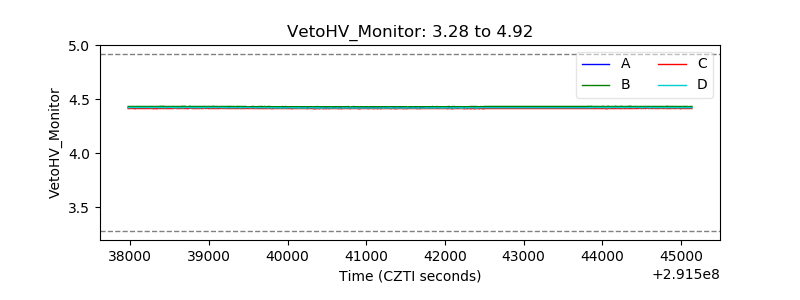 |
| Veto LLD | 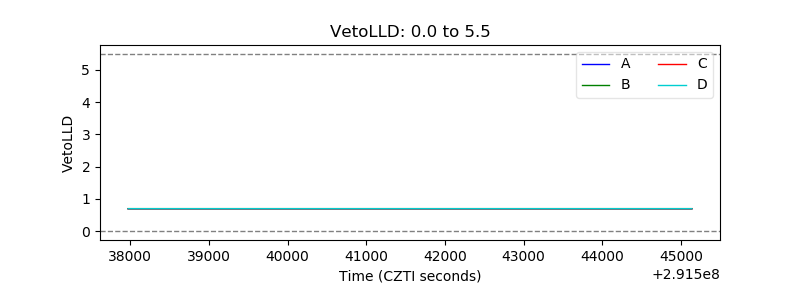 |
| Alpha Counter | 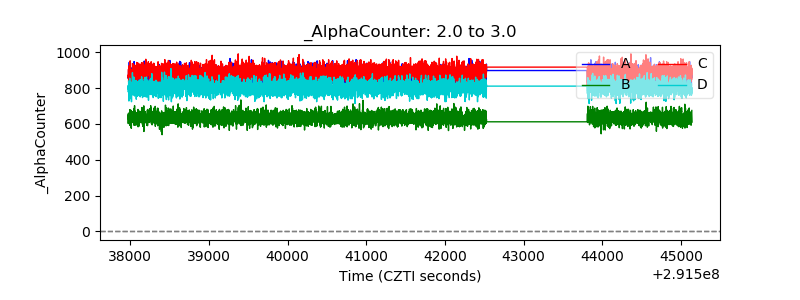 |
| _CPM_Rate | 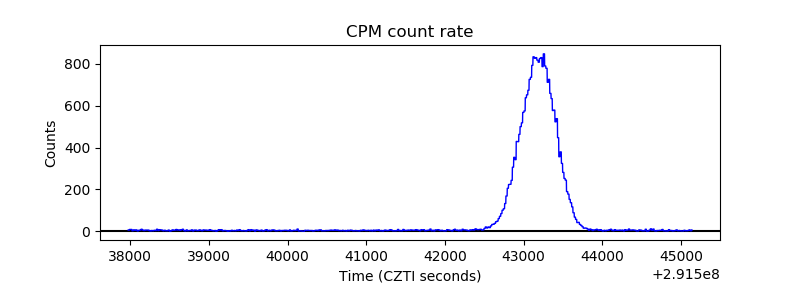 |
| CZT Counter | 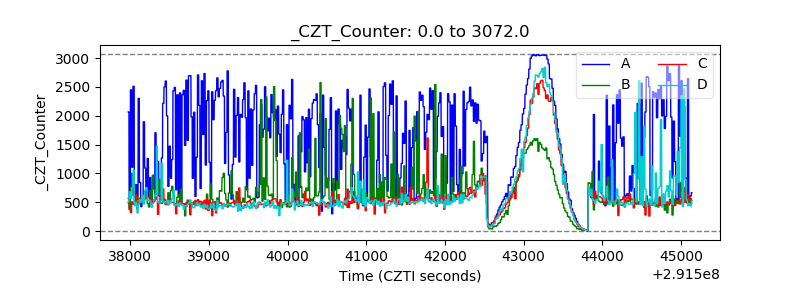 |
| +2.5 Volts monitor |  |
| +5 Volts monitor | 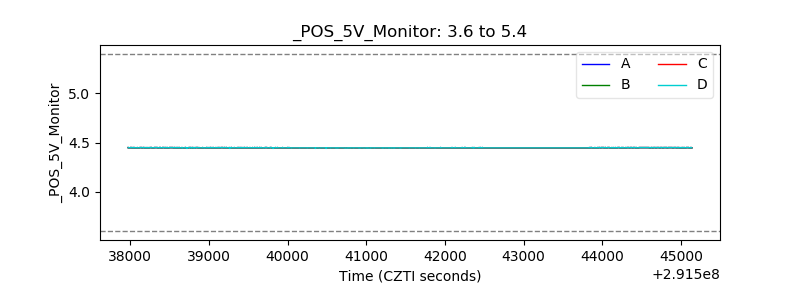 |
| _ROLL_ROT | 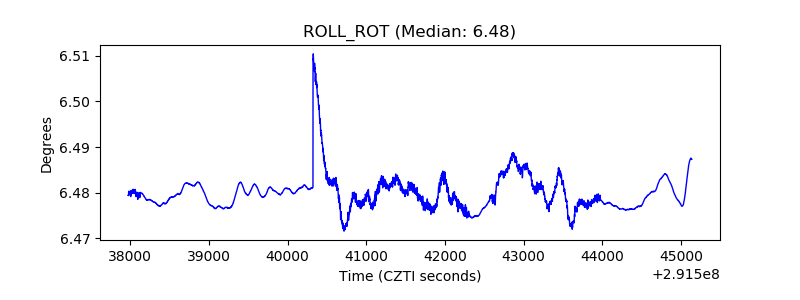 |
| _Roll_DEC | 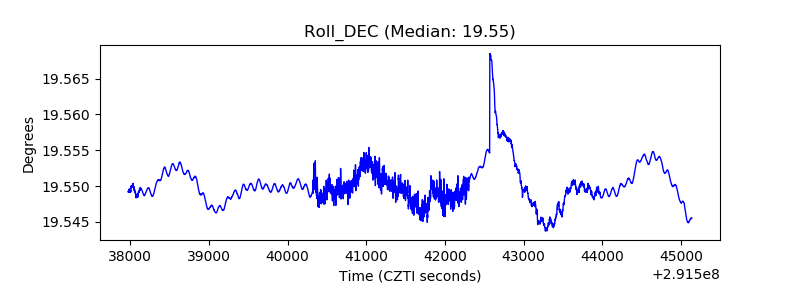 |
| _Roll_RA | 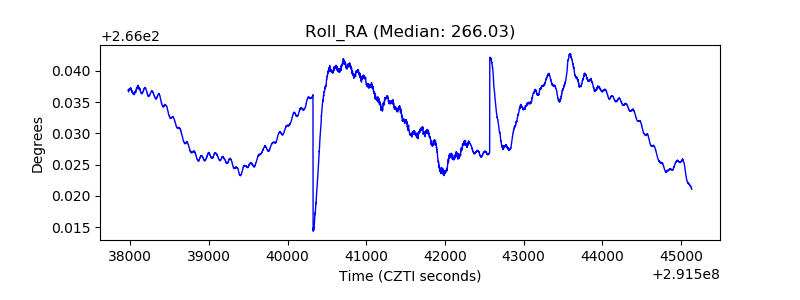 |
| Veto Counter | 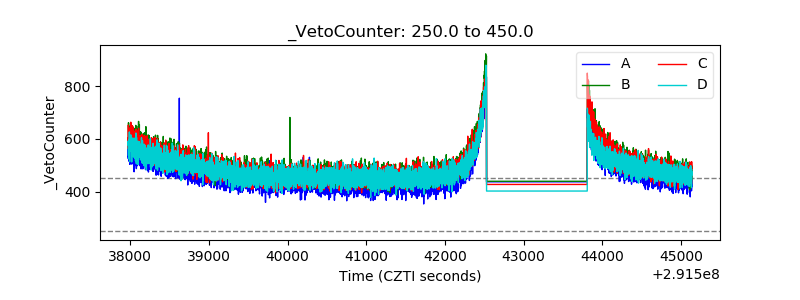 |