| Param | Original file | Final file |
|---|---|---|
| Filename | modeM0/AS1A05_163T01_9000002820_18920cztM0_level2.evt | modeM0/AS1A05_163T01_9000002820_18920cztM0_level2_quad_clean.evt |
| Size (bytes) | 590,307,840 | 75,415,680 |
| Size | 563.0 MB | 71.9 MB |
| Events in quadrant A | 5,513,092 | 441,281 |
| Events in quadrant B | 4,856,654 | 484,605 |
| Events in quadrant C | 3,278,606 | 478,462 |
| Events in quadrant D | 3,825,825 | 462,998 |
| Mode M0 | |||
|---|---|---|---|
| Quadrant | BADHDUFLAG | Total packets | Discarded packets |
| A | 0 | 20144 | 1 |
| B | 0 | 18121 | 1 |
| C | 0 | 13214 | 1 |
| D | 0 | 15145 | 1 |
| Mode SS | |||
|---|---|---|---|
| Quadrant | BADHDUFLAG | Total packets | Discarded packets |
| A | 0 | 122 | 0 |
| B | 0 | 122 | 0 |
| C | 0 | 122 | 0 |
| D | 0 | 122 | 0 |
| Mode M9 | |||
|---|---|---|---|
| Quadrant | BADHDUFLAG | Total packets | Discarded packets |
| A | 0 | 10 | 0 |
| B | 0 | 10 | 0 |
| C | 0 | 10 | 0 |
| D | 0 | 10 | 0 |
| Quadrant | Total seconds | Saturated seconds | Saturation percentage |
|---|---|---|---|
| A | 5948 | 1096 | 18.426362% |
| B | 5948 | 750 | 12.609280% |
| C | 5948 | 115 | 1.933423% |
| D | 5949 | 276 | 4.639435% |
Noise dominated data is calculated using 1-second bins in cleaned event files. If a bin has >2000 counts, and if more than 50% of those come from <1% of pixels, then it is considered to be noise-dominated and hence unusable.
| Quadrant | # 1 sec bins | Bins with >0 counts | Bins with >2000 counts | High rate bins dominated by noise | Noise dominated (total time) | Noise dominated (detector-on time) | Marked lightcurve |
|---|---|---|---|---|---|---|---|
| A | 6988 | 5949 | 698 | 698 | 9.99% | 11.73% | 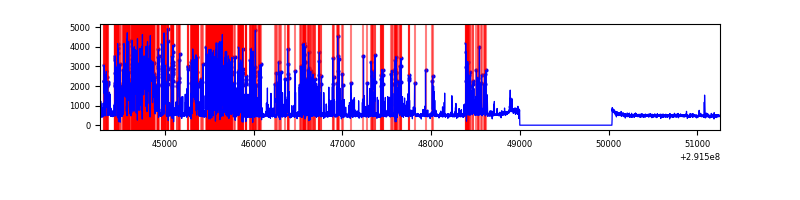 |
| B | 6988 | 5949 | 537 | 537 | 7.68% | 9.03% | 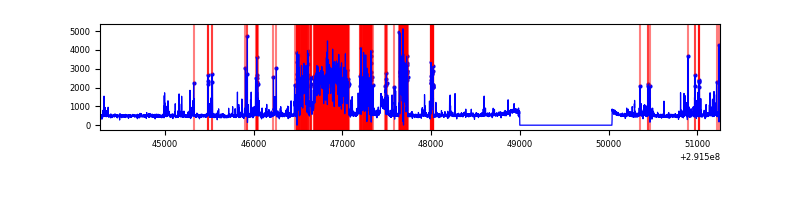 |
| C | 6988 | 5949 | 0 | 0 | 0.00% | 0.00% | 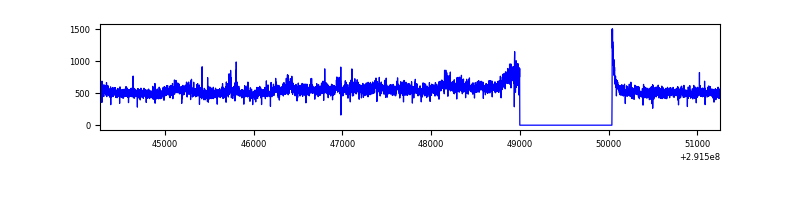 |
| D | 6989 | 5950 | 181 | 181 | 2.59% | 3.04% | 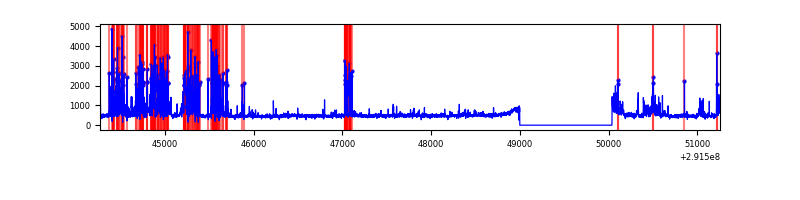 |
Top three noisy pixels from each quadrant. If the there are fewer than three noisy pixels in the level2.evt file, extra rows are filled as -1
| Pixel properties | Quadrant properties | ||||||
|---|---|---|---|---|---|---|---|
| Quadrant | DetID | PixID | Counts | Sigma | Mean | Median | Sigma |
| A | 14 | 235 | 2841001 | 20363.84 | 693 | 680 | 139.5 |
| A | 13 | 254 | 7798 | 51.03 | 693 | 680 | 139.5 |
| A | 0 | 226 | 6079 | 38.71 | 693 | 680 | 139.5 |
| B | 3 | 112 | 1884505 | 13651.83 | 711 | 693 | 138.0 |
| B | 4 | 216 | 49215 | 351.63 | 711 | 693 | 138.0 |
| B | 7 | 220 | 39033 | 277.85 | 711 | 693 | 138.0 |
| C | 3 | 233 | 359329 | 2145.1 | 717 | 721 | 167.2 |
| C | 14 | 238 | 114385 | 679.91 | 717 | 721 | 167.2 |
| C | 5 | 112 | 8577 | 46.99 | 717 | 721 | 167.2 |
| D | 12 | 218 | 732316 | 4154.38 | 725 | 704 | 176.1 |
| D | 9 | 1 | 171576 | 970.28 | 725 | 704 | 176.1 |
| D | 7 | 96 | 40723 | 227.24 | 725 | 704 | 176.1 |
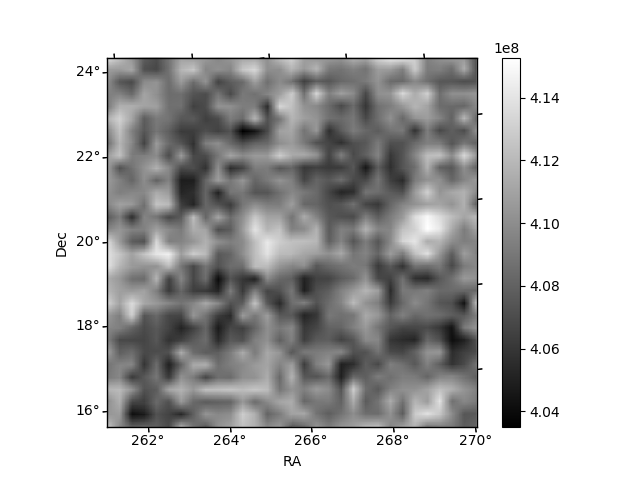
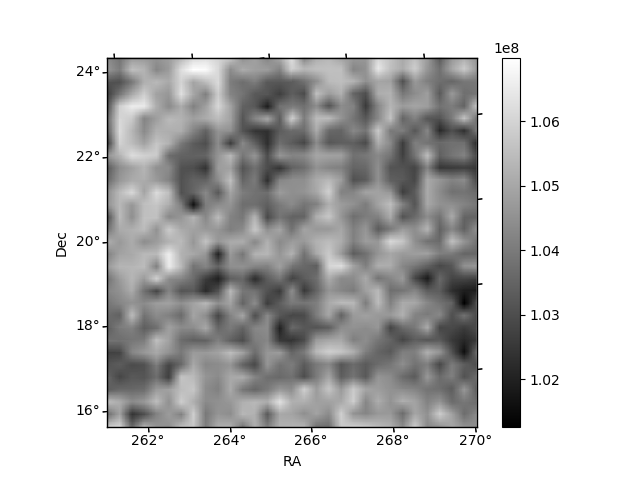
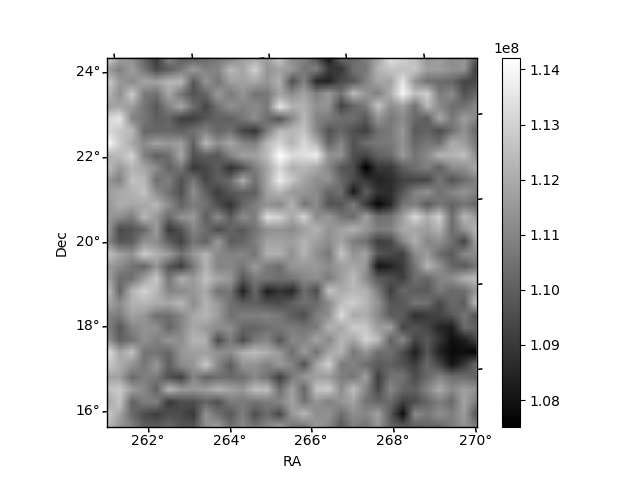
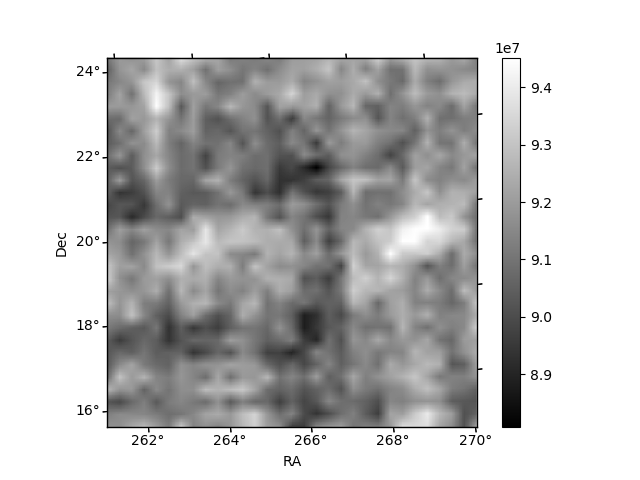
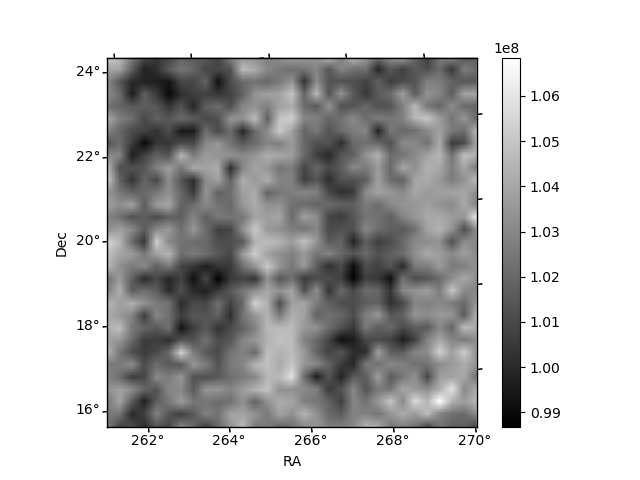
Histogram calculated using DETX and DETY for each event in the final _common_clean file
| Quadrant A | 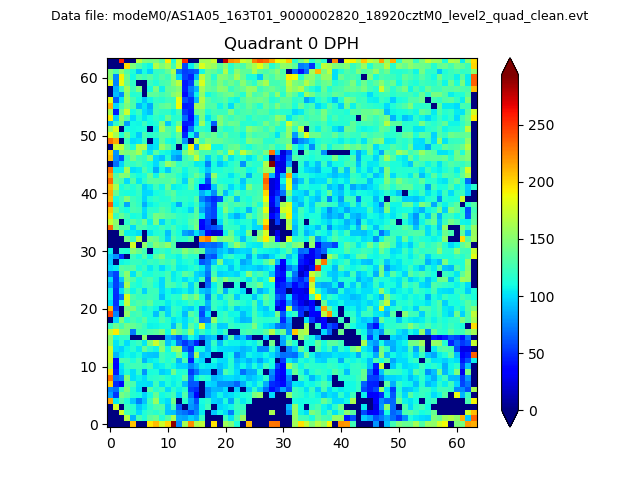 |
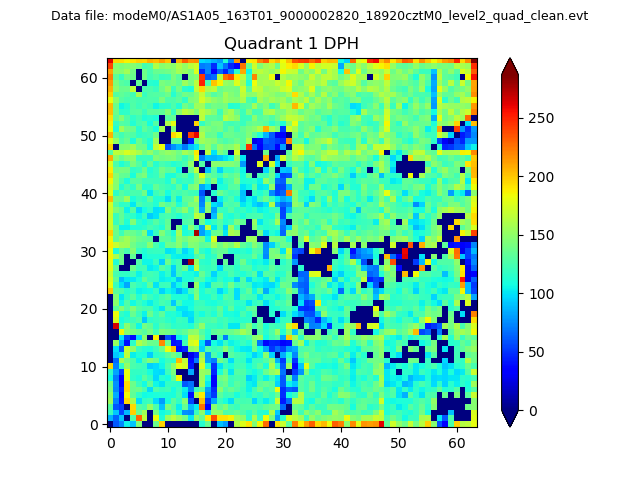 |
Quadrant B |
|---|---|---|---|
| Quadrant D | 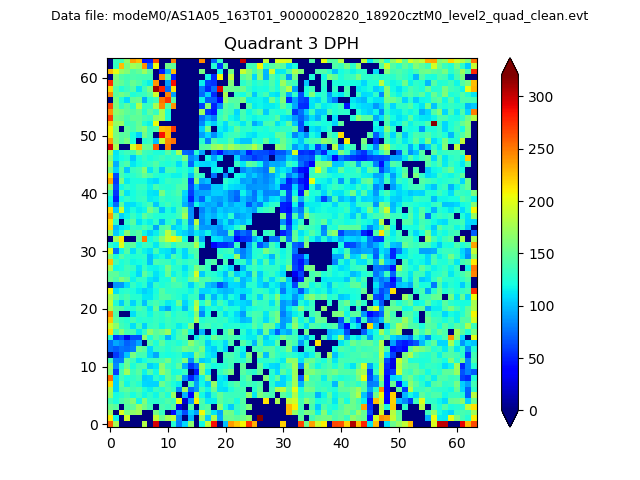 |
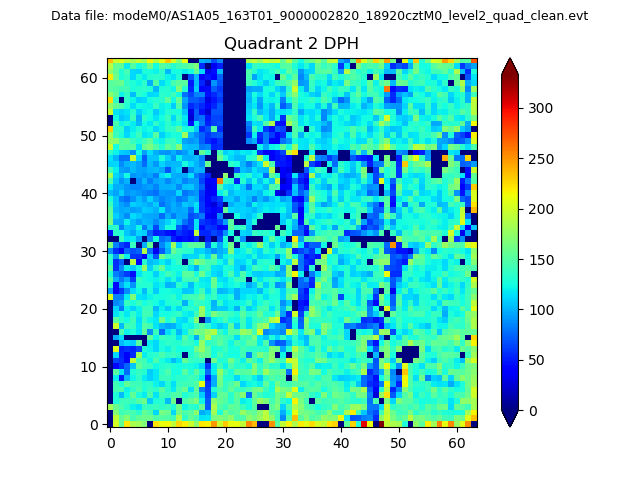 |
Quadrant C |
| Plot type | Count rate plots | Images |
|---|---|---|
| Comparison with Poisson distribution Blue bars denote a histogram of data divided into 1 sec bins. Red curve is a Poisson curve with rate = median count rate of data. |
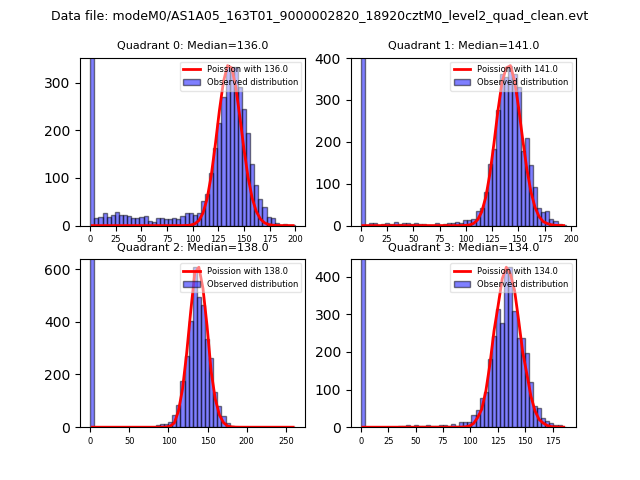 |
 |
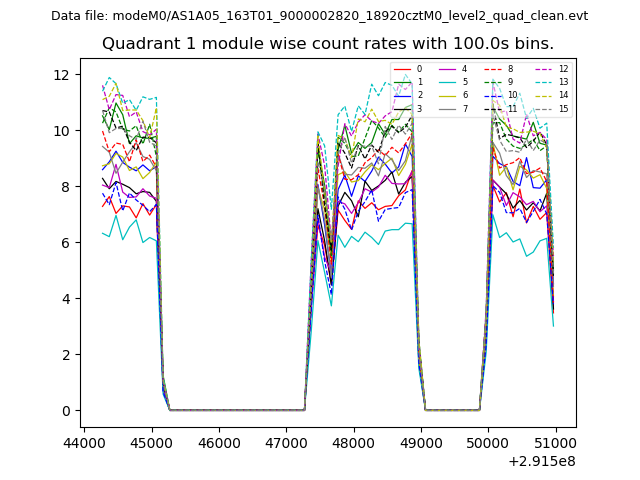
| Quadrant-wise count rates Data is divided into 100 sec bins |
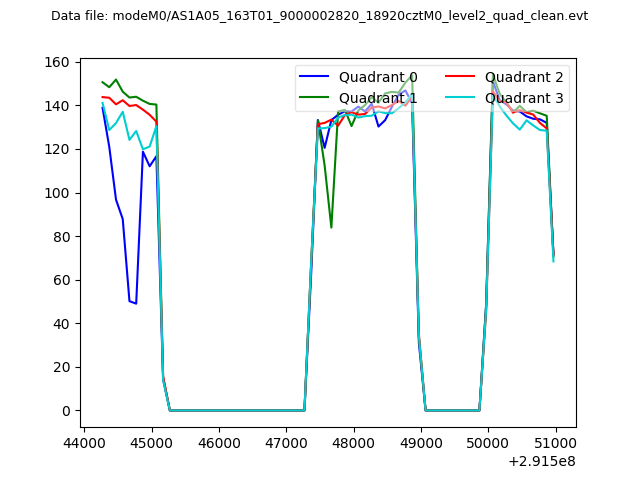 |
|
| Module-wise count rates for Quadrant A Data is divided into 100 sec bins |
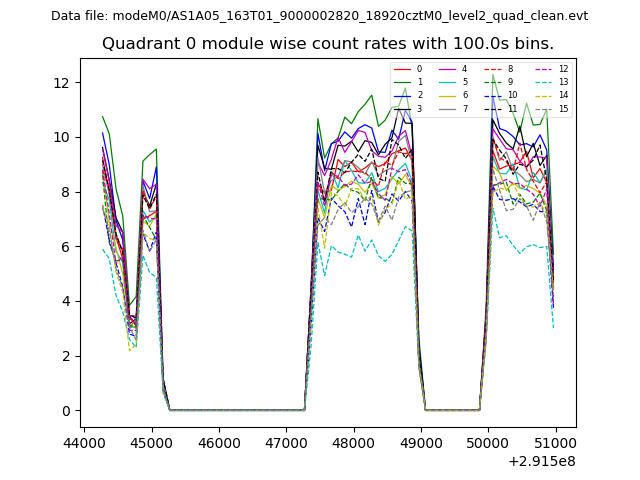 |
 |
| Module-wise count rates for Quadrant B Data is divided into 100 sec bins |
 |
 |
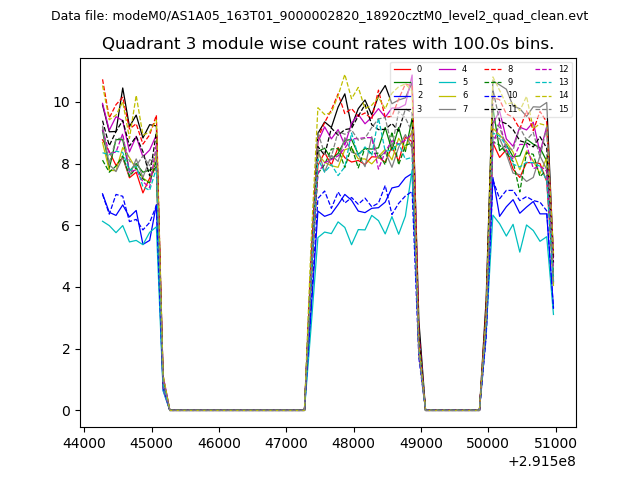
| Module-wise count rates for Quadrant C Data is divided into 100 sec bins |
 |
 |
| Module-wise count rates for Quadrant D Data is divided into 100 sec bins |
 |
 |
| Parameter | Plot |
|---|---|
| CZT HV Monitor |  |
| D_VDD | 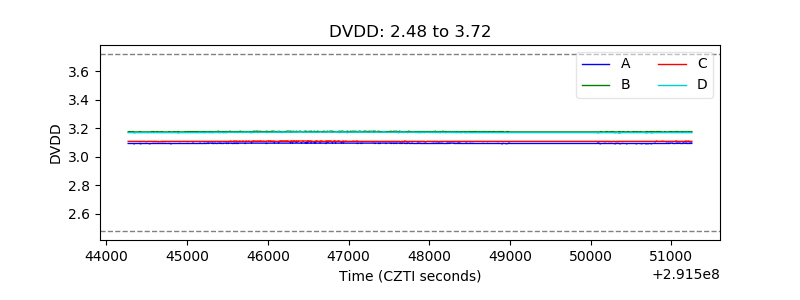 |
| Temperature 1 | 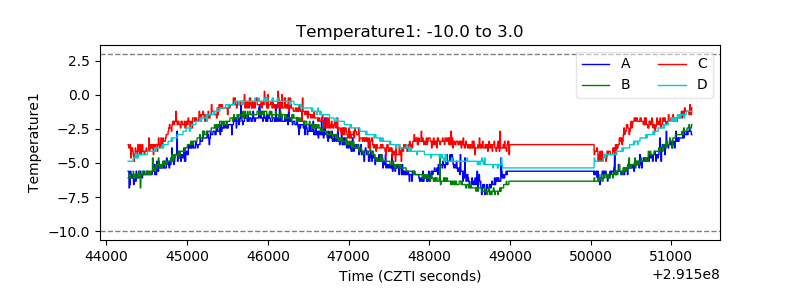 |
| Veto HV Monitor | 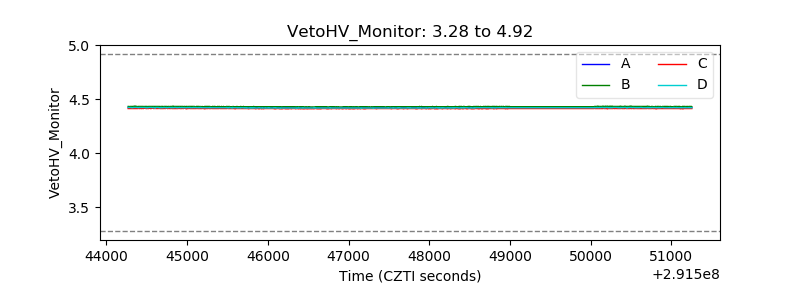 |
| Veto LLD | 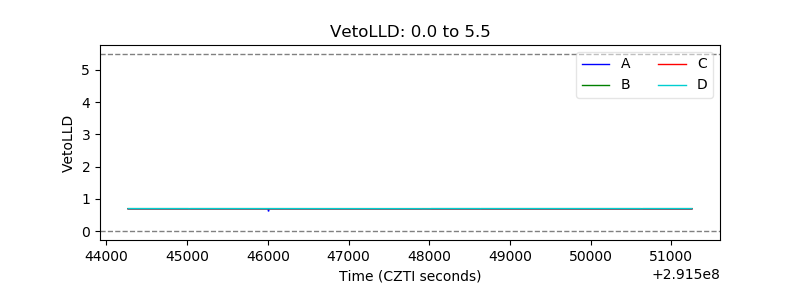 |
| Alpha Counter | 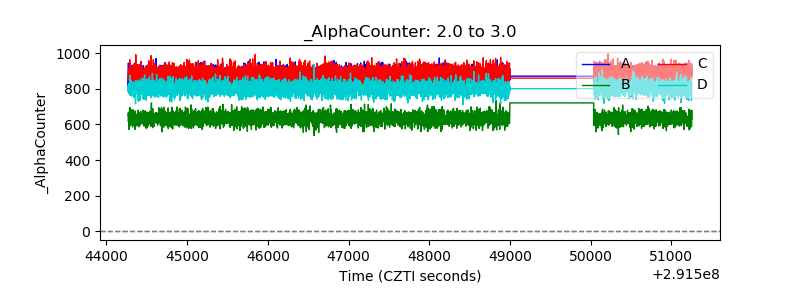 |
| _CPM_Rate | 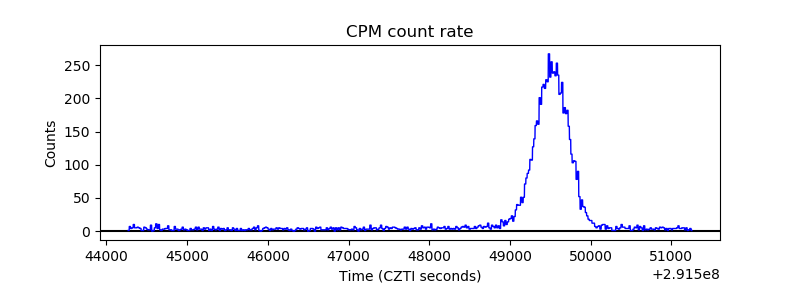 |
| CZT Counter | 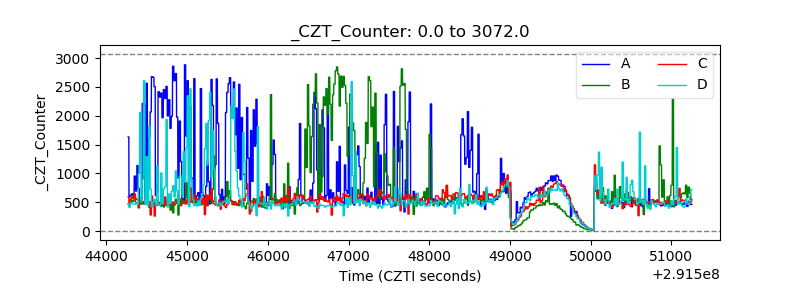 |
| +2.5 Volts monitor | 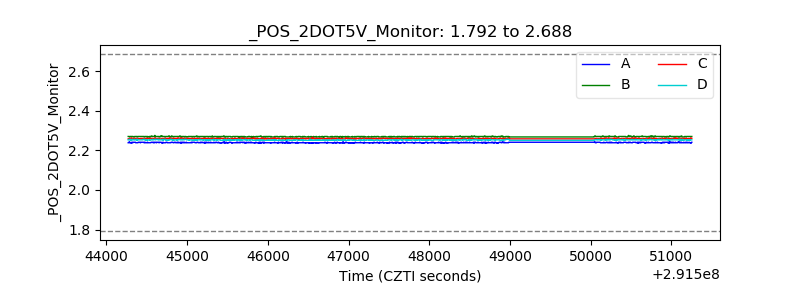 |
| +5 Volts monitor |  |
| _ROLL_ROT | 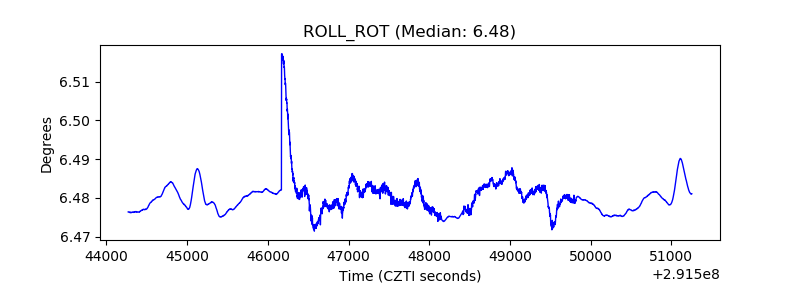 |
| _Roll_DEC | 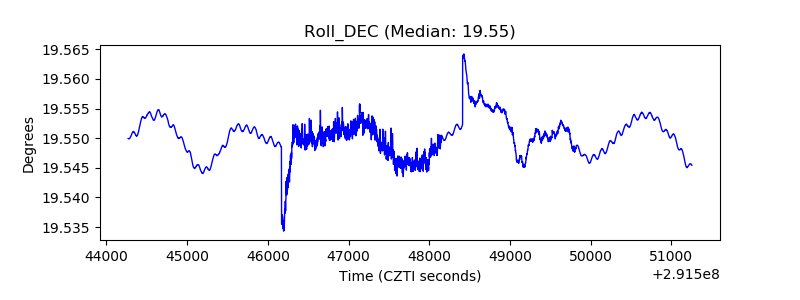 |
| _Roll_RA | 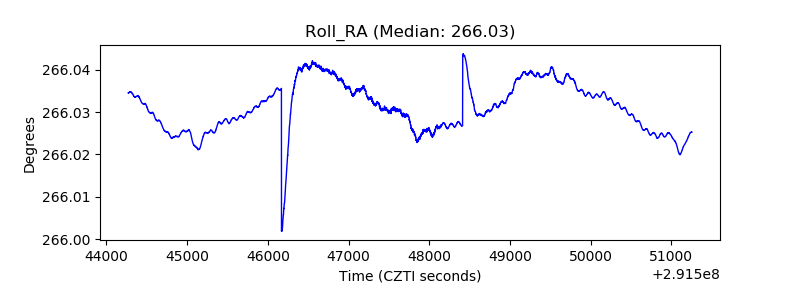 |
| Veto Counter | 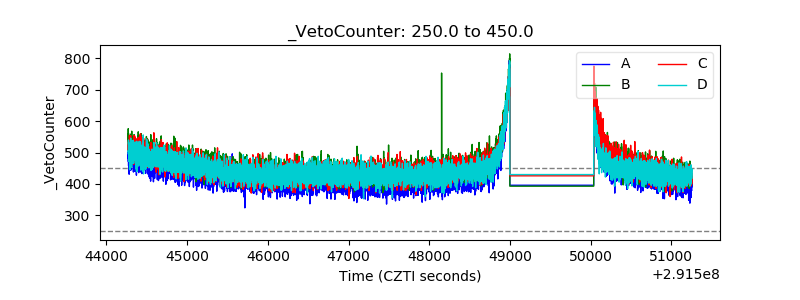 |