| Param | Original file | Final file |
|---|---|---|
| Filename | modeM0/AS1A05_163T01_9000002820_18921cztM0_level2.evt | modeM0/AS1A05_163T01_9000002820_18921cztM0_level2_quad_clean.evt |
| Size (bytes) | 557,752,320 | 84,386,880 |
| Size | 531.9 MB | 80.5 MB |
| Events in quadrant A | 3,494,268 | 527,391 |
| Events in quadrant B | 4,128,522 | 538,043 |
| Events in quadrant C | 3,910,017 | 524,031 |
| Events in quadrant D | 4,878,671 | 472,528 |
| Mode M0 | |||
|---|---|---|---|
| Quadrant | BADHDUFLAG | Total packets | Discarded packets |
| A | 0 | 14807 | 2 |
| B | 0 | 16614 | 2 |
| C | 0 | 15868 | 2 |
| D | 0 | 19217 | 2 |
| Mode SS | |||
|---|---|---|---|
| Quadrant | BADHDUFLAG | Total packets | Discarded packets |
| A | 0 | 144 | 0 |
| B | 0 | 144 | 0 |
| C | 0 | 144 | 0 |
| D | 0 | 144 | 0 |
| Mode M9 | |||
|---|---|---|---|
| Quadrant | BADHDUFLAG | Total packets | Discarded packets |
| A | 0 | 7 | 0 |
| B | 0 | 7 | 0 |
| C | 0 | 7 | 0 |
| D | 0 | 7 | 0 |
| Quadrant | Total seconds | Saturated seconds | Saturation percentage |
|---|---|---|---|
| A | 7082 | 158 | 2.231008% |
| B | 7083 | 214 | 3.021319% |
| C | 7083 | 166 | 2.343640% |
| D | 7083 | 632 | 8.922773% |
Noise dominated data is calculated using 1-second bins in cleaned event files. If a bin has >2000 counts, and if more than 50% of those come from <1% of pixels, then it is considered to be noise-dominated and hence unusable.
| Quadrant | # 1 sec bins | Bins with >0 counts | Bins with >2000 counts | High rate bins dominated by noise | Noise dominated (total time) | Noise dominated (detector-on time) | Marked lightcurve |
|---|---|---|---|---|---|---|---|
| A | 7667 | 7084 | 13 | 13 | 0.17% | 0.18% | 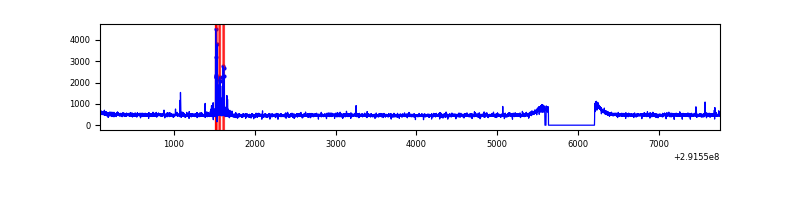 |
| B | 7668 | 7085 | 36 | 36 | 0.47% | 0.51% | 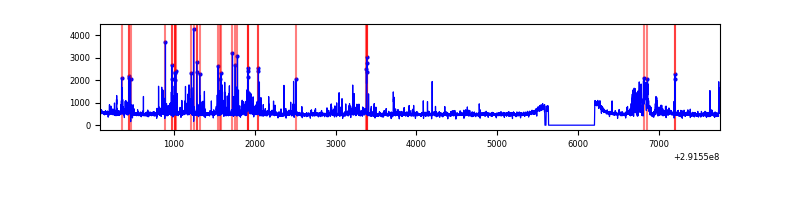 |
| C | 7668 | 7085 | 0 | 0 | 0.00% | 0.00% | 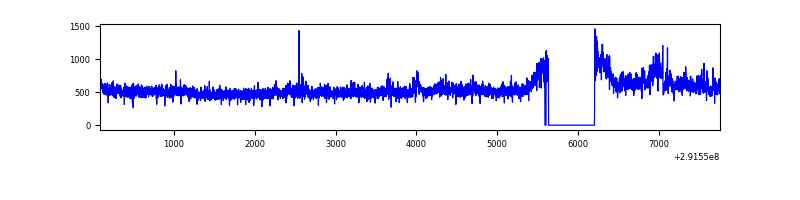 |
| D | 7668 | 7085 | 429 | 429 | 5.59% | 6.06% | 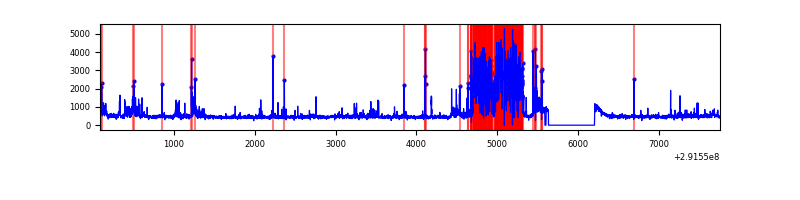 |
Top three noisy pixels from each quadrant. If the there are fewer than three noisy pixels in the level2.evt file, extra rows are filled as -1
| Pixel properties | Quadrant properties | ||||||
|---|---|---|---|---|---|---|---|
| Quadrant | DetID | PixID | Counts | Sigma | Mean | Median | Sigma |
| A | 14 | 235 | 86381 | 477.12 | 883 | 865 | 179.2 |
| A | 13 | 254 | 9549 | 48.45 | 883 | 865 | 179.2 |
| A | 9 | 143 | 9524 | 48.31 | 883 | 865 | 179.2 |
| B | 3 | 112 | 335013 | 1969.77 | 875 | 853 | 169.6 |
| B | 10 | 247 | 162079 | 950.38 | 875 | 853 | 169.6 |
| B | 7 | 220 | 83629 | 487.94 | 875 | 853 | 169.6 |
| C | 3 | 233 | 484757 | 2454.81 | 842 | 847 | 197.1 |
| C | 14 | 238 | 131277 | 661.65 | 842 | 847 | 197.1 |
| C | 0 | 207 | 6643 | 29.4 | 842 | 847 | 197.1 |
| D | 7 | 238 | 1448827 | 7194.3 | 826 | 802 | 201.3 |
| D | 9 | 1 | 135939 | 671.41 | 826 | 802 | 201.3 |
| D | 14 | 34 | 49233 | 240.62 | 826 | 802 | 201.3 |
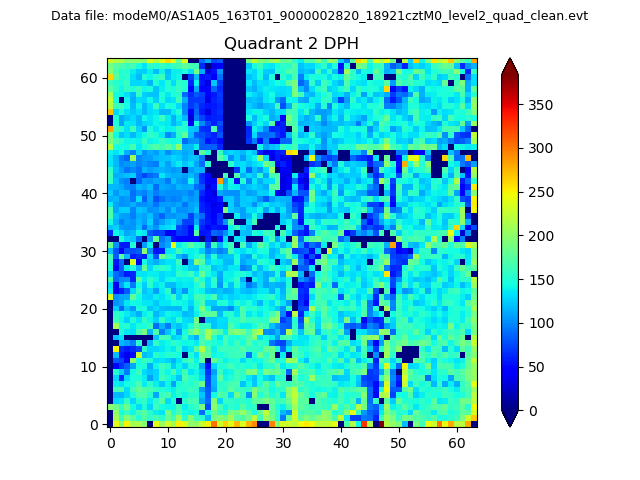
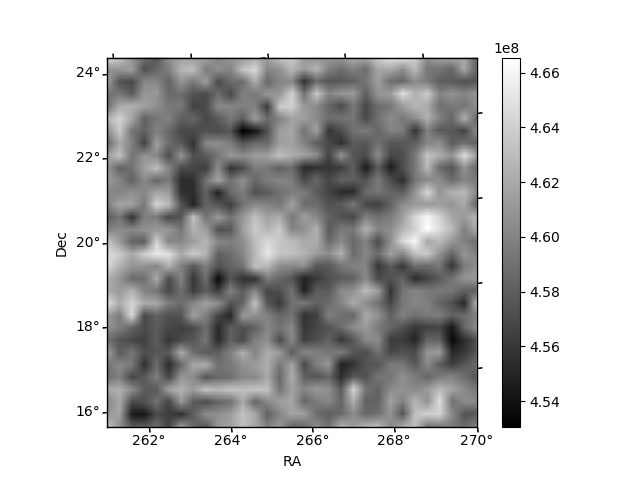
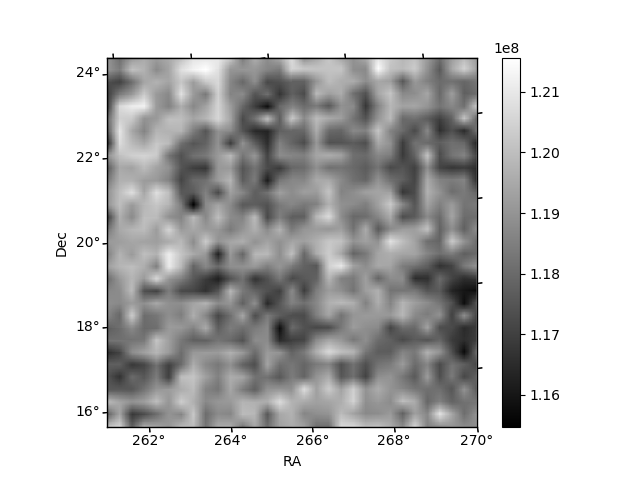
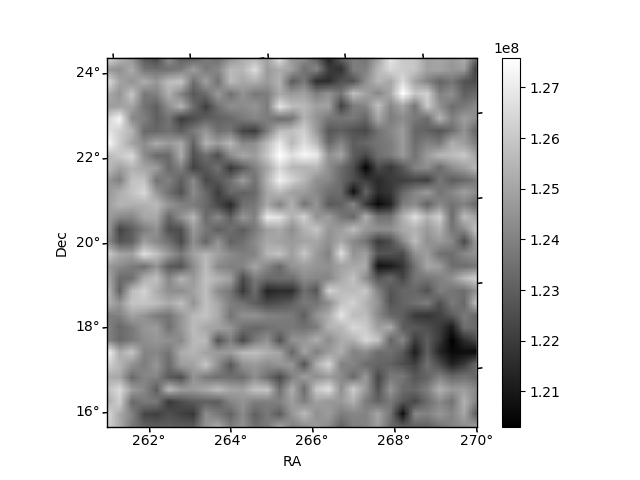
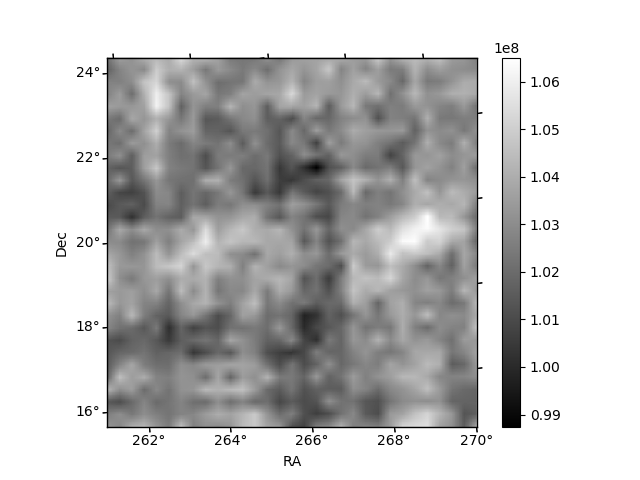
Histogram calculated using DETX and DETY for each event in the final _common_clean file
| Quadrant A | 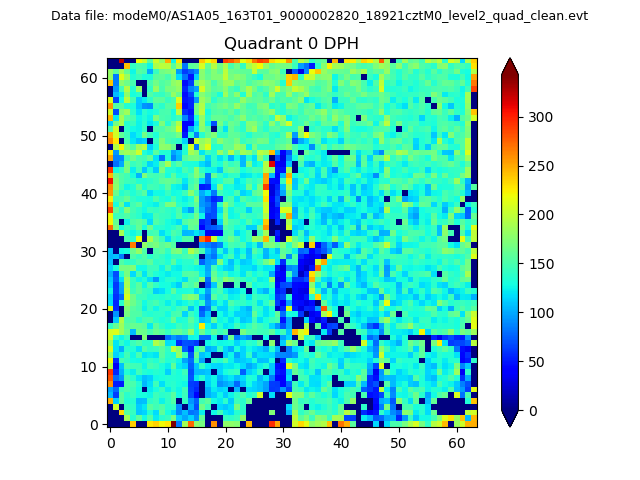 |
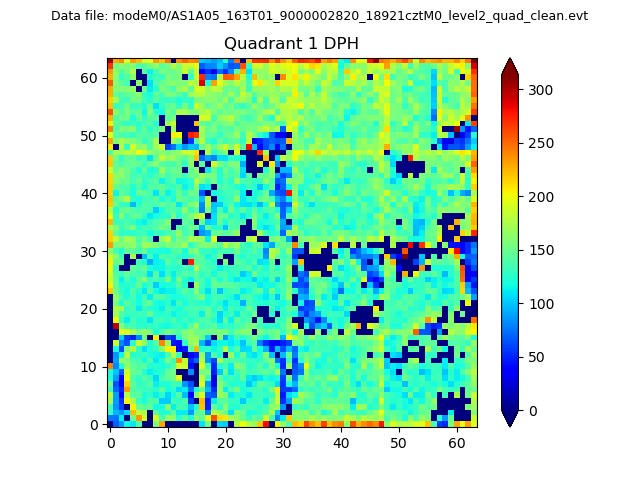 |
Quadrant B |
|---|---|---|---|
| Quadrant D | 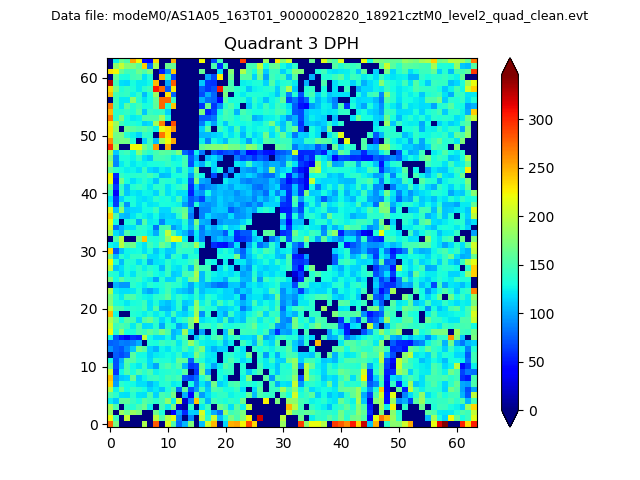 |
 |
Quadrant C |
| Plot type | Count rate plots | Images |
|---|---|---|
| Comparison with Poisson distribution Blue bars denote a histogram of data divided into 1 sec bins. Red curve is a Poisson curve with rate = median count rate of data. |
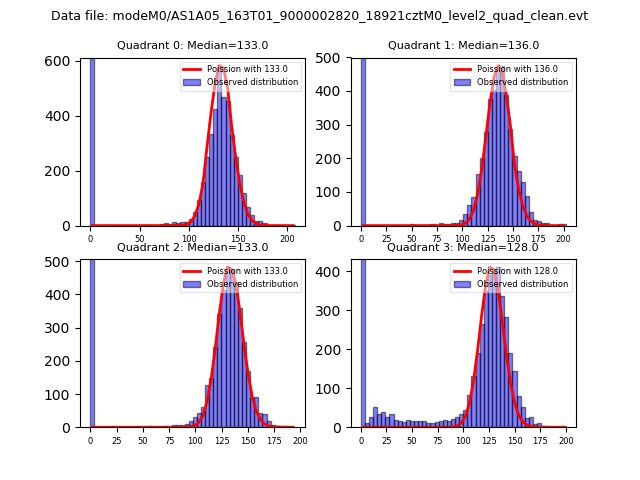 |
 |
| Quadrant-wise count rates Data is divided into 100 sec bins |
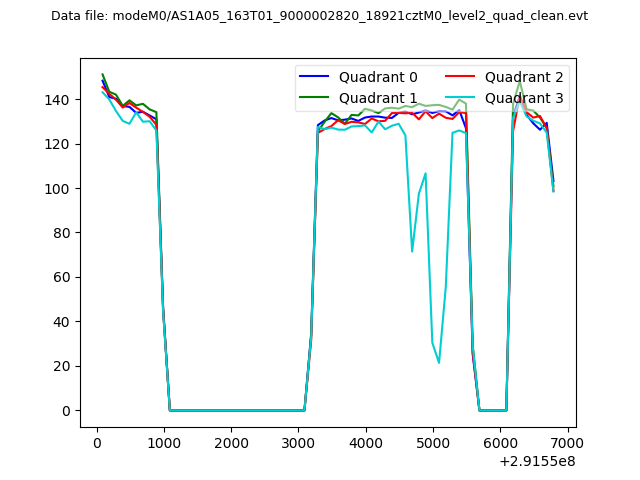 |
|
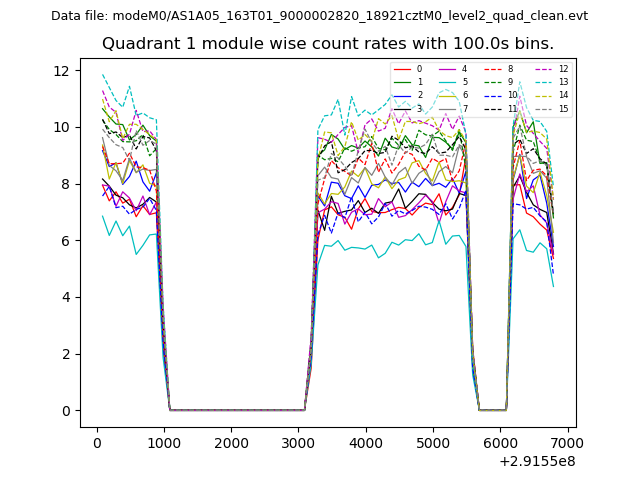
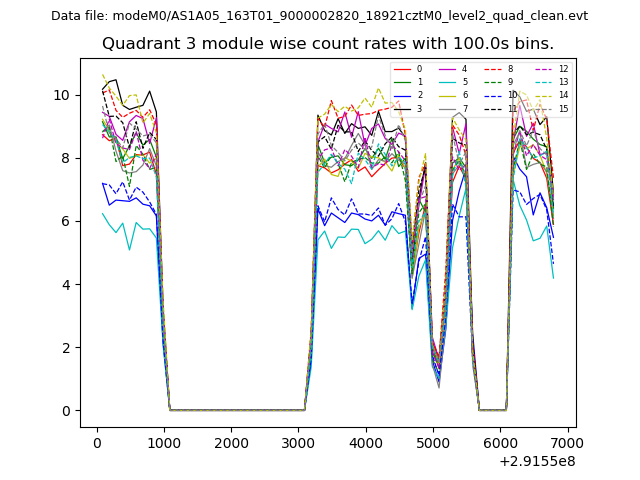
| Module-wise count rates for Quadrant A Data is divided into 100 sec bins |
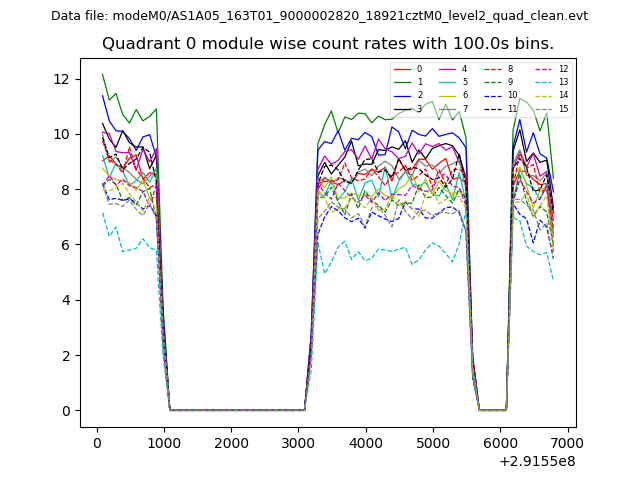 |
 |
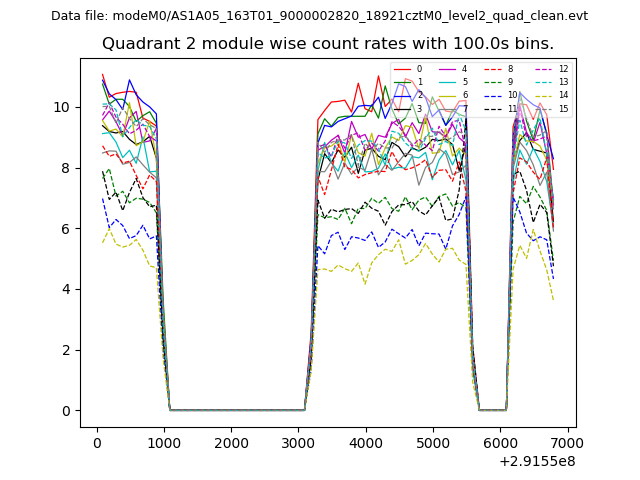
| Module-wise count rates for Quadrant B Data is divided into 100 sec bins |
 |
 |
| Module-wise count rates for Quadrant C Data is divided into 100 sec bins |
 |
 |
| Module-wise count rates for Quadrant D Data is divided into 100 sec bins |
 |
 |
| Parameter | Plot |
|---|---|
| CZT HV Monitor | 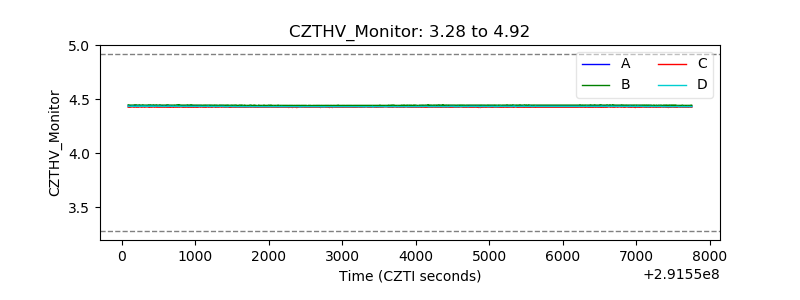 |
| D_VDD | 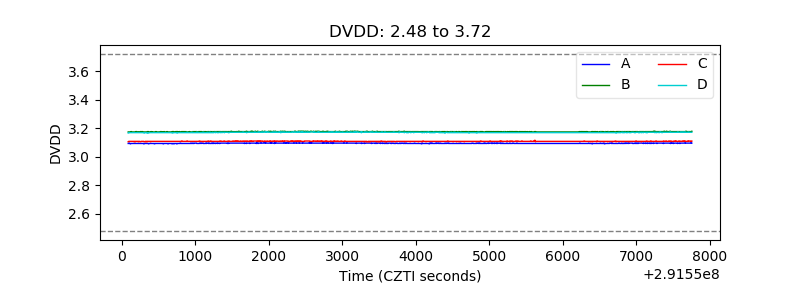 |
| Temperature 1 | 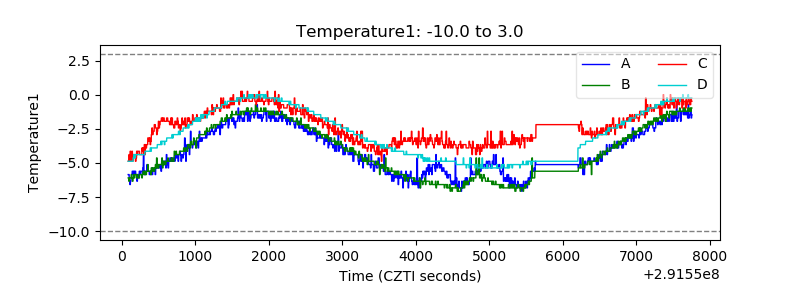 |
| Veto HV Monitor | 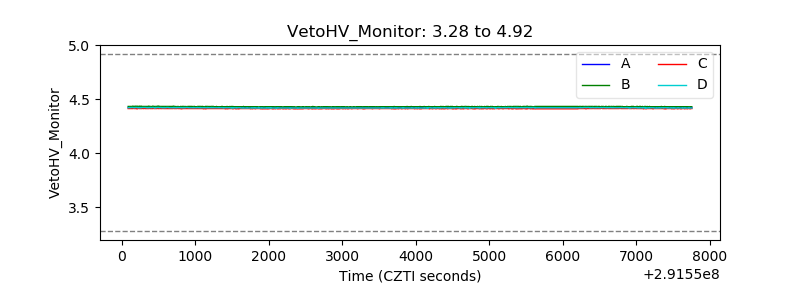 |
| Veto LLD | 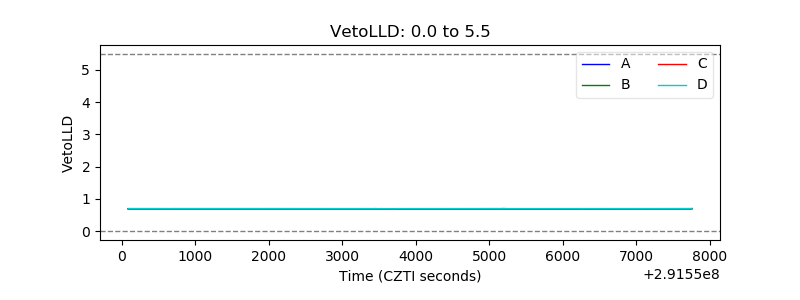 |
| Alpha Counter | 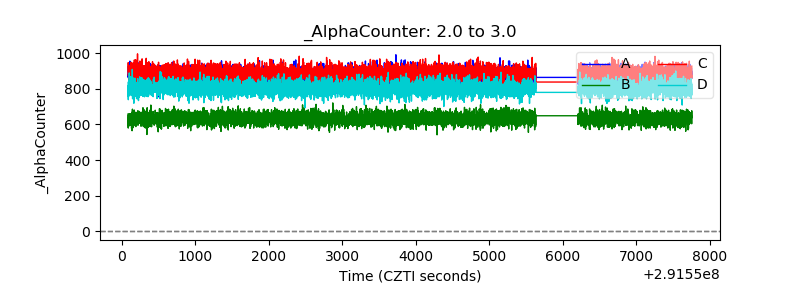 |
| _CPM_Rate | 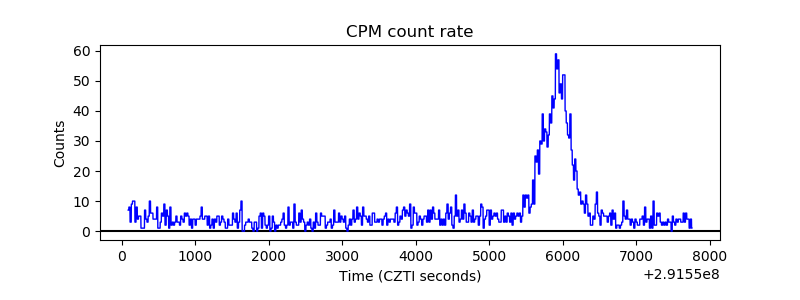 |
| CZT Counter | 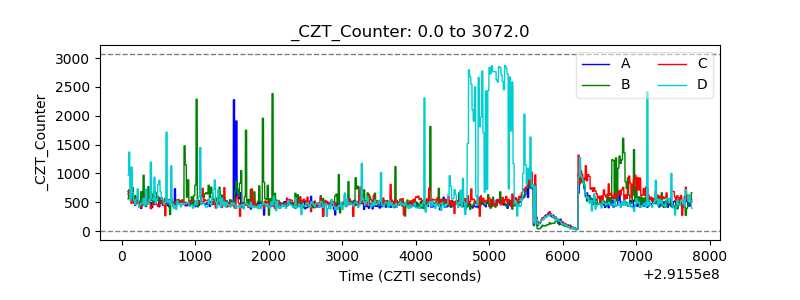 |
| +2.5 Volts monitor |  |
| +5 Volts monitor |  |
| _ROLL_ROT | 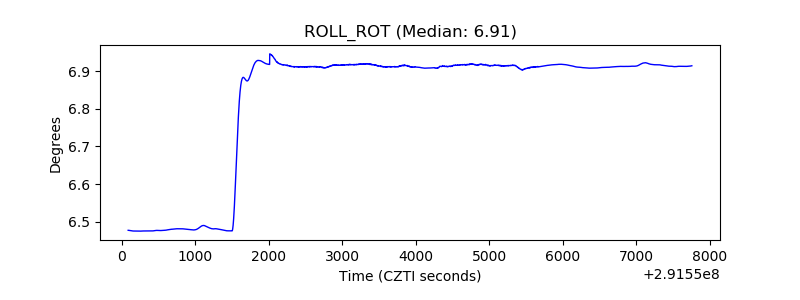 |
| _Roll_DEC | 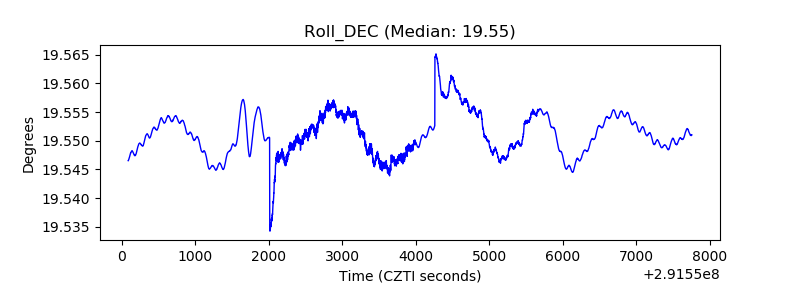 |
| _Roll_RA | 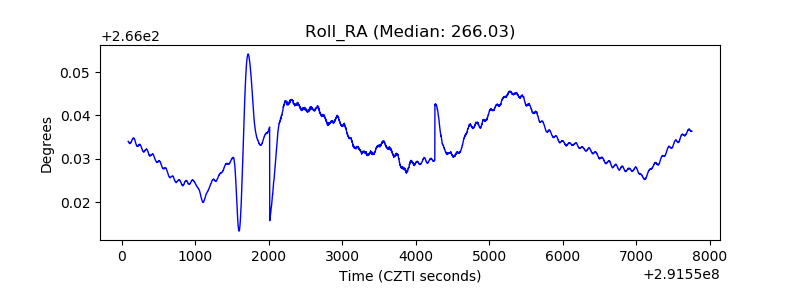 |
| Veto Counter | 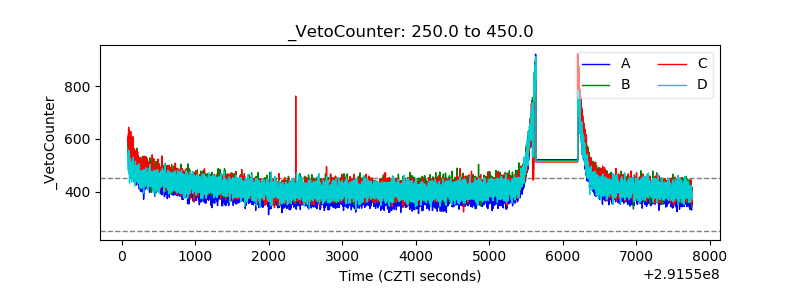 |