| Param | Original file | Final file |
|---|---|---|
| Filename | modeM0/AS1A05_163T01_9000002820_18923cztM0_level2.evt | modeM0/AS1A05_163T01_9000002820_18923cztM0_level2_quad_clean.evt |
| Size (bytes) | 807,341,760 | 72,313,920 |
| Size | 769.9 MB | 69.0 MB |
| Events in quadrant A | 3,566,241 | 452,562 |
| Events in quadrant B | 6,322,982 | 423,955 |
| Events in quadrant C | 3,756,068 | 447,586 |
| Events in quadrant D | 10,307,848 | 352,590 |
| Mode M0 | |||
|---|---|---|---|
| Quadrant | BADHDUFLAG | Total packets | Discarded packets |
| A | 0 | 15268 | 1 |
| B | 0 | 23582 | 1 |
| C | 0 | 15718 | 1 |
| D | 0 | 35779 | 1 |
| Mode SS | |||
|---|---|---|---|
| Quadrant | BADHDUFLAG | Total packets | Discarded packets |
| A | 0 | 150 | 0 |
| B | 0 | 150 | 0 |
| C | 0 | 150 | 0 |
| D | 0 | 150 | 0 |
| Mode M9 | |||
|---|---|---|---|
| Quadrant | BADHDUFLAG | Total packets | Discarded packets |
| A | 0 | 2 | 0 |
| B | 0 | 2 | 0 |
| C | 0 | 2 | 0 |
| D | 0 | 2 | 0 |
| Quadrant | Total seconds | Saturated seconds | Saturation percentage |
|---|---|---|---|
| A | 7352 | 91 | 1.237758% |
| B | 7352 | 986 | 13.411317% |
| C | 7353 | 139 | 1.890385% |
| D | 7353 | 2654 | 36.094111% |
Noise dominated data is calculated using 1-second bins in cleaned event files. If a bin has >2000 counts, and if more than 50% of those come from <1% of pixels, then it is considered to be noise-dominated and hence unusable.
| Quadrant | # 1 sec bins | Bins with >0 counts | Bins with >2000 counts | High rate bins dominated by noise | Noise dominated (total time) | Noise dominated (detector-on time) | Marked lightcurve |
|---|---|---|---|---|---|---|---|
| A | 7578 | 7355 | 0 | 0 | 0.00% | 0.00% | 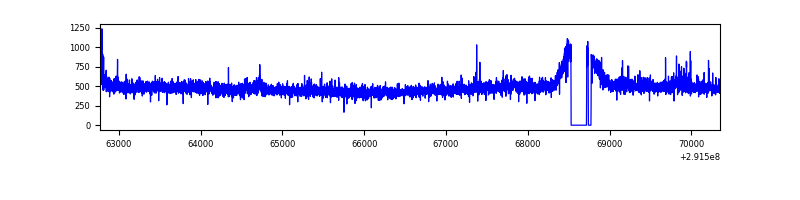 |
| B | 7577 | 7354 | 606 | 606 | 8.00% | 8.24% | 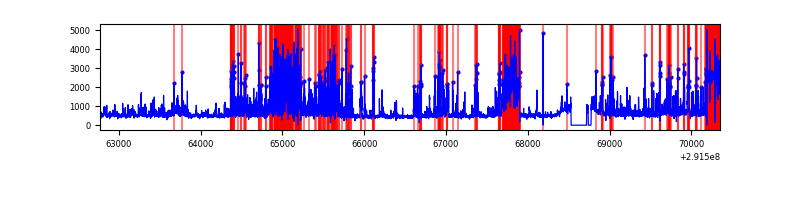 |
| C | 7579 | 7356 | 1 | 1 | 0.01% | 0.01% | 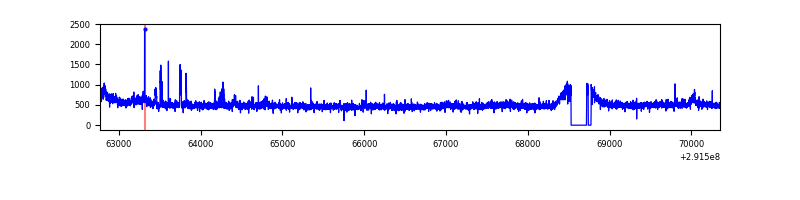 |
| D | 7578 | 7354 | 1780 | 1780 | 23.49% | 24.20% | 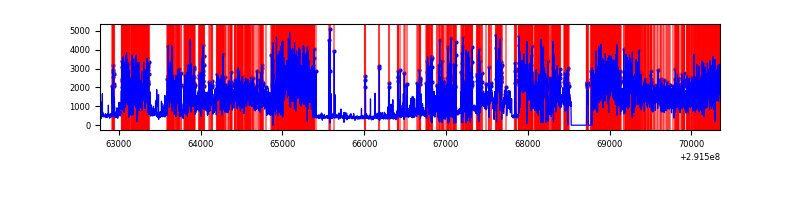 |
Top three noisy pixels from each quadrant. If the there are fewer than three noisy pixels in the level2.evt file, extra rows are filled as -1
| Pixel properties | Quadrant properties | ||||||
|---|---|---|---|---|---|---|---|
| Quadrant | DetID | PixID | Counts | Sigma | Mean | Median | Sigma |
| A | 3 | 1 | 43271 | 229.14 | 901 | 882 | 185.0 |
| A | 14 | 235 | 32624 | 171.59 | 901 | 882 | 185.0 |
| A | 8 | 205 | 10469 | 51.82 | 901 | 882 | 185.0 |
| B | 3 | 112 | 2738121 | 16723.49 | 843 | 820 | 163.7 |
| B | 7 | 220 | 111243 | 674.62 | 843 | 820 | 163.7 |
| B | 0 | 189 | 32809 | 195.43 | 843 | 820 | 163.7 |
| C | 3 | 233 | 257169 | 1264.03 | 860 | 864 | 202.8 |
| C | 14 | 238 | 132531 | 649.35 | 860 | 864 | 202.8 |
| C | 5 | 112 | 7226 | 31.38 | 860 | 864 | 202.8 |
| D | 7 | 238 | 7084712 | 39641.03 | 723 | 702 | 178.7 |
| D | 1 | 52 | 159508 | 888.65 | 723 | 702 | 178.7 |
| D | 12 | 218 | 126579 | 704.39 | 723 | 702 | 178.7 |
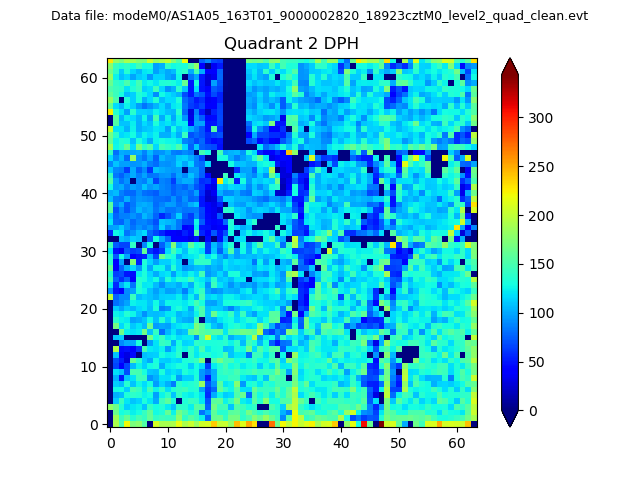
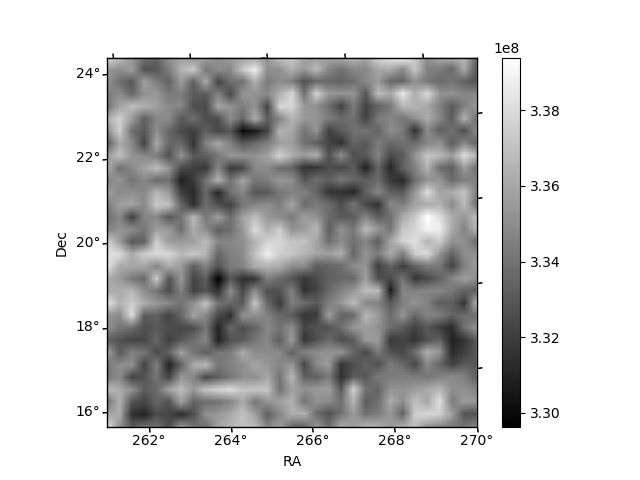
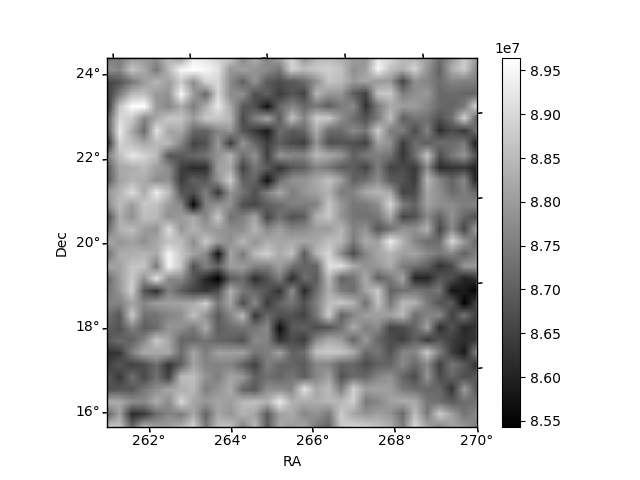
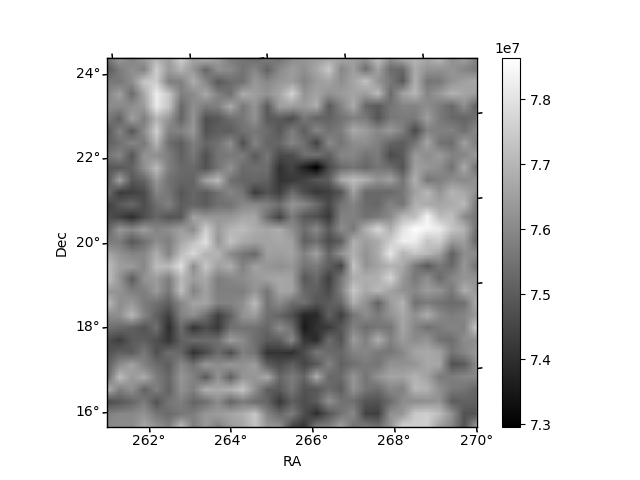
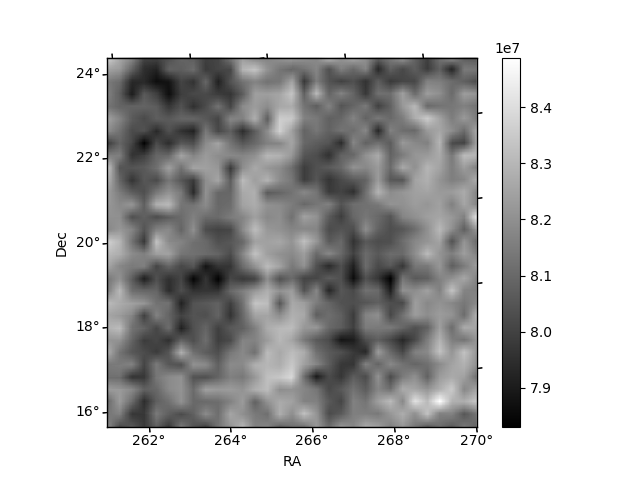
Histogram calculated using DETX and DETY for each event in the final _common_clean file
| Quadrant A | 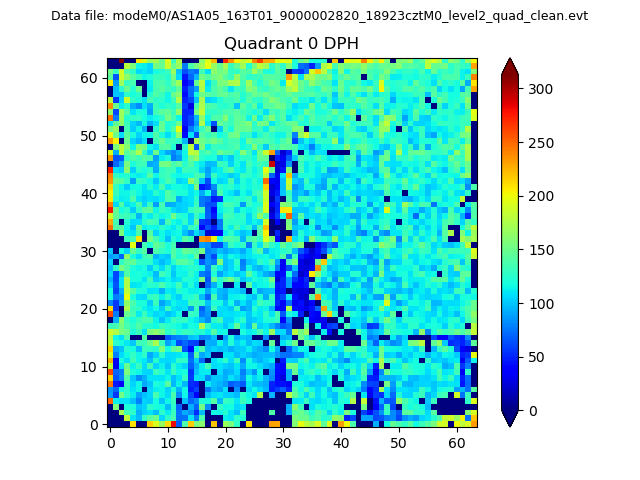 |
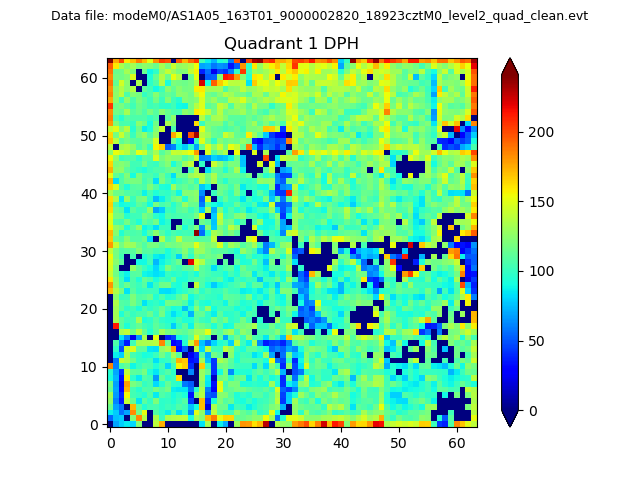 |
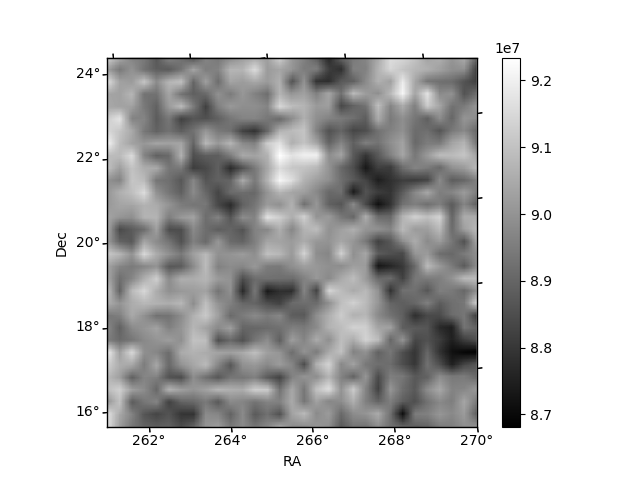
Quadrant B |
|---|---|---|---|
| Quadrant D | 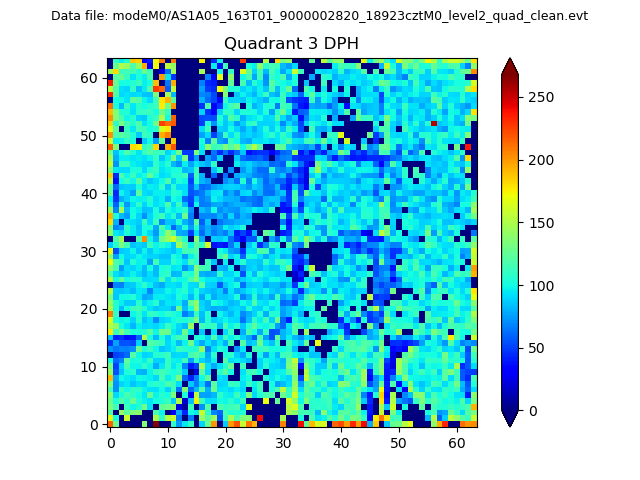 |
 |
Quadrant C |
| Plot type | Count rate plots | Images |
|---|---|---|
| Comparison with Poisson distribution Blue bars denote a histogram of data divided into 1 sec bins. Red curve is a Poisson curve with rate = median count rate of data. |
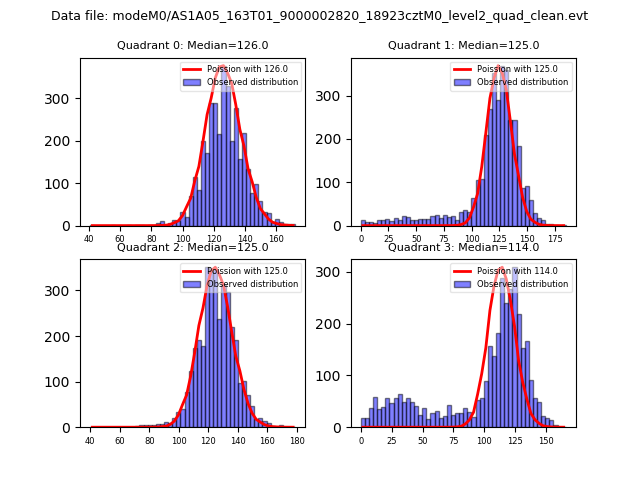 |
 |
| Quadrant-wise count rates Data is divided into 100 sec bins |
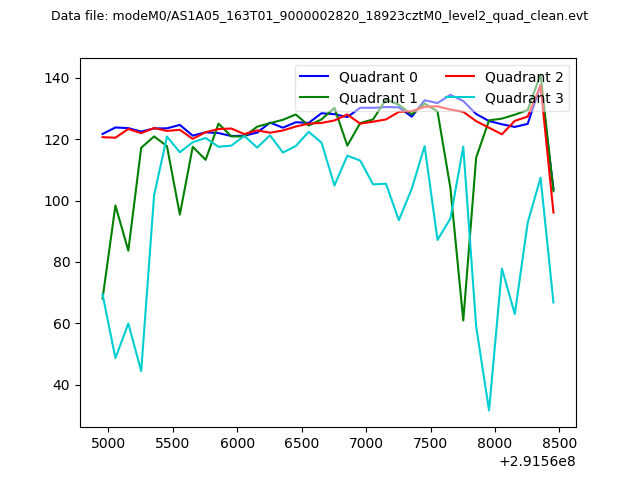 |
|
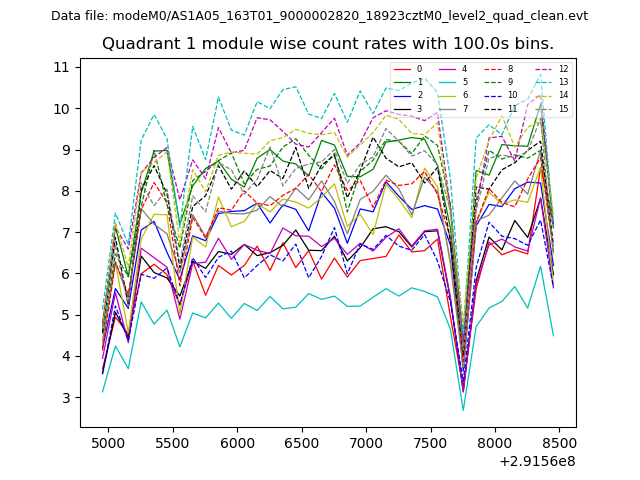
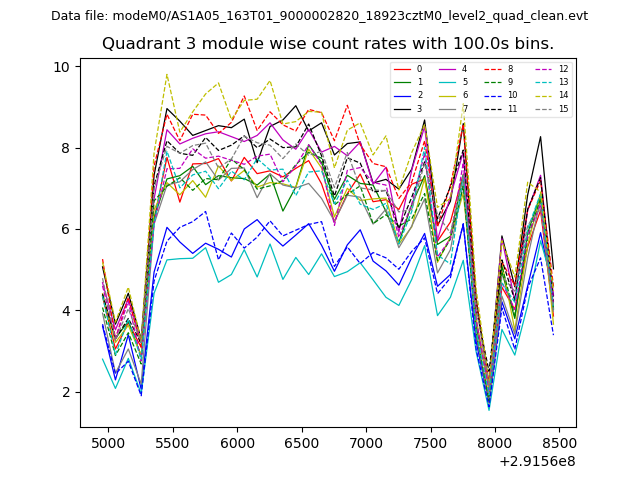
| Module-wise count rates for Quadrant A Data is divided into 100 sec bins |
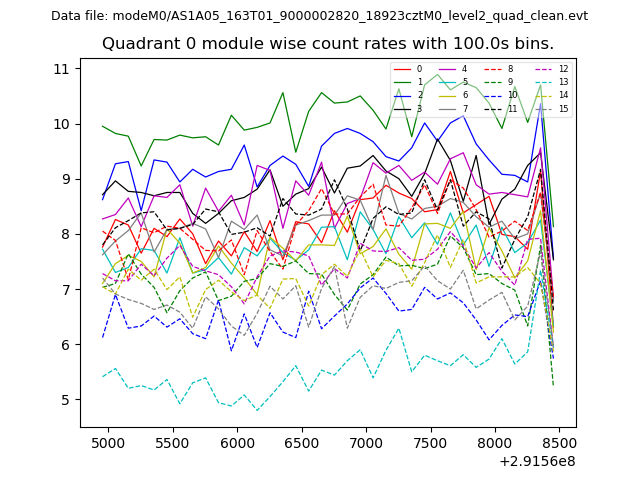 |
 |
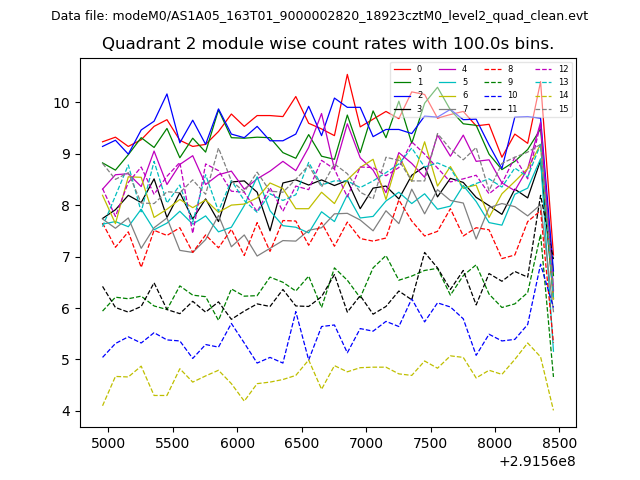
| Module-wise count rates for Quadrant B Data is divided into 100 sec bins |
 |
 |
| Module-wise count rates for Quadrant C Data is divided into 100 sec bins |
 |
 |
| Module-wise count rates for Quadrant D Data is divided into 100 sec bins |
 |
 |
| Parameter | Plot |
|---|---|
| CZT HV Monitor | 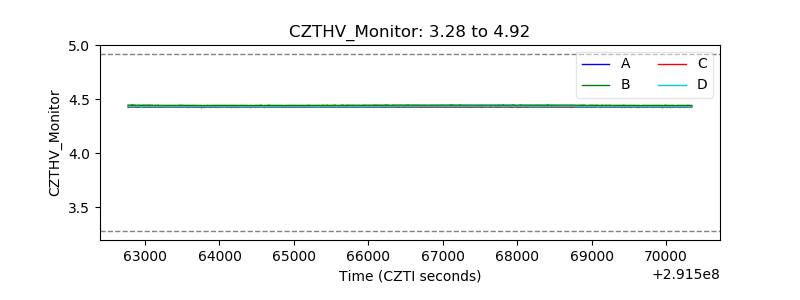 |
| D_VDD | 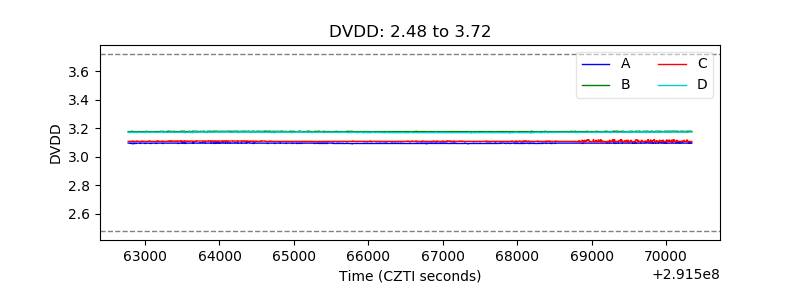 |
| Temperature 1 |  |
| Veto HV Monitor | 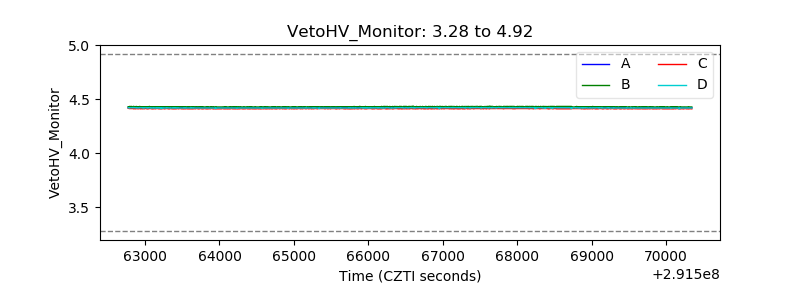 |
| Veto LLD | 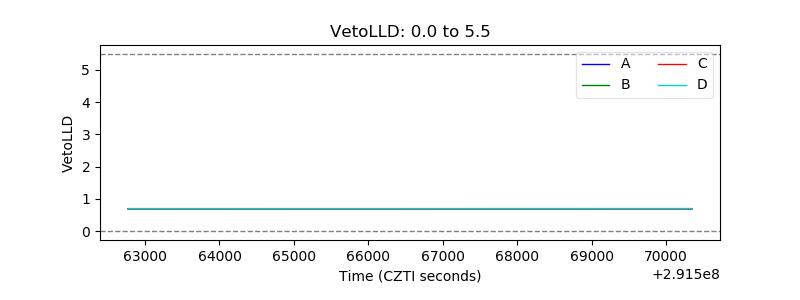 |
| Alpha Counter | 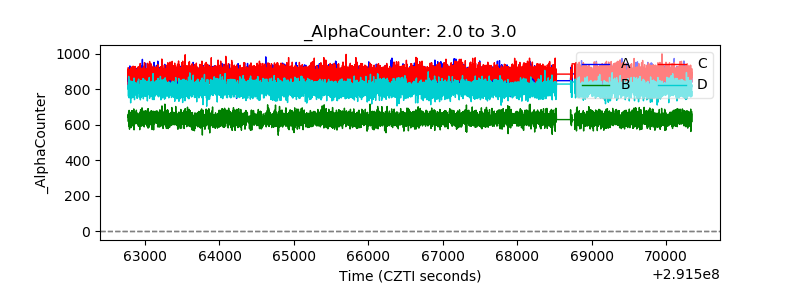 |
| _CPM_Rate | 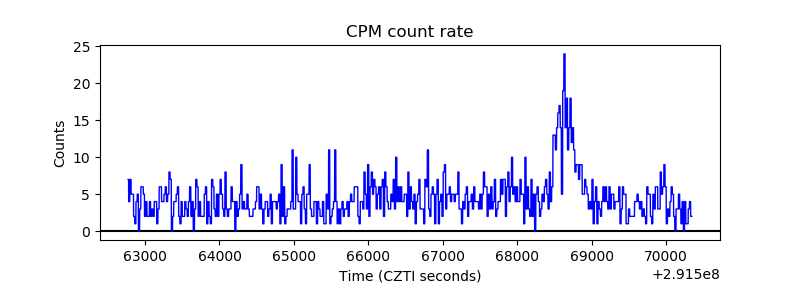 |
| CZT Counter | 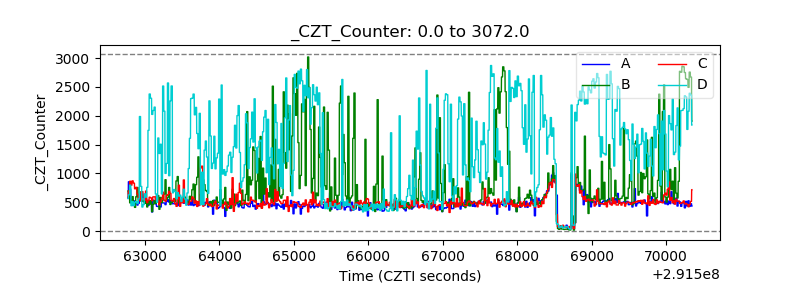 |
| +2.5 Volts monitor |  |
| +5 Volts monitor |  |
| _ROLL_ROT | 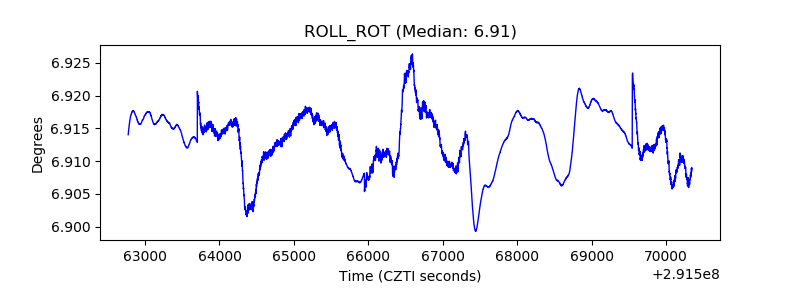 |
| _Roll_DEC | 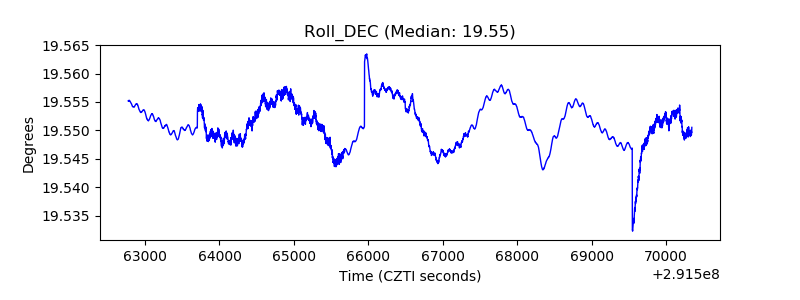 |
| _Roll_RA | 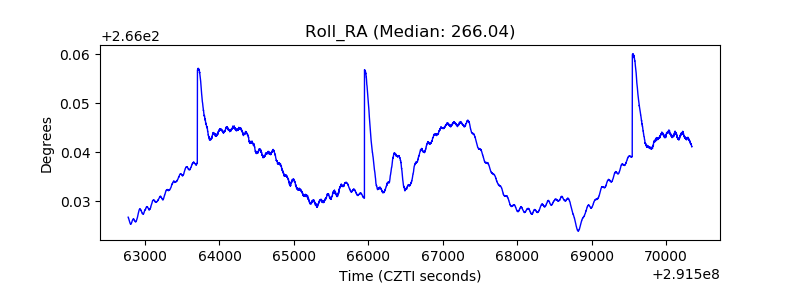 |
| Veto Counter | 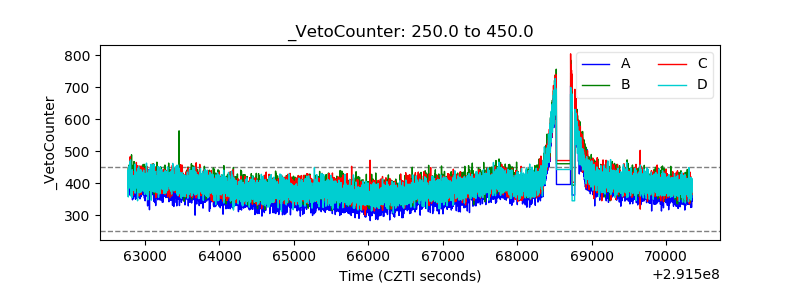 |