| Param | Original file | Final file |
|---|---|---|
| Filename | modeM0/AS1A05_163T01_9000002820_18924cztM0_level2.evt | modeM0/AS1A05_163T01_9000002820_18924cztM0_level2_quad_clean.evt |
| Size (bytes) | 660,562,560 | 74,453,760 |
| Size | 630.0 MB | 71.0 MB |
| Events in quadrant A | 3,193,647 | 454,437 |
| Events in quadrant B | 5,092,443 | 457,462 |
| Events in quadrant C | 3,362,672 | 450,857 |
| Events in quadrant D | 7,895,168 | 416,633 |
| Mode M0 | |||
|---|---|---|---|
| Quadrant | BADHDUFLAG | Total packets | Discarded packets |
| A | 0 | 13887 | 1 |
| B | 0 | 19667 | 2 |
| C | 0 | 14031 | 1 |
| D | 0 | 28170 | 1 |
| Mode SS | |||
|---|---|---|---|
| Quadrant | BADHDUFLAG | Total packets | Discarded packets |
| A | 0 | 140 | 0 |
| B | 0 | 140 | 0 |
| C | 0 | 140 | 0 |
| D | 0 | 140 | 0 |
| Mode M9 | |||
|---|---|---|---|
| Quadrant | BADHDUFLAG | Total packets | Discarded packets |
| A | 0 | 4 | 0 |
| B | 0 | 4 | 0 |
| C | 0 | 4 | 0 |
| D | 0 | 4 | 0 |
| Quadrant | Total seconds | Saturated seconds | Saturation percentage |
|---|---|---|---|
| A | 6807 | 37 | 0.543558% |
| B | 6807 | 524 | 7.697958% |
| C | 6807 | 72 | 1.057735% |
| D | 6807 | 1739 | 25.547231% |
Noise dominated data is calculated using 1-second bins in cleaned event files. If a bin has >2000 counts, and if more than 50% of those come from <1% of pixels, then it is considered to be noise-dominated and hence unusable.
| Quadrant | # 1 sec bins | Bins with >0 counts | Bins with >2000 counts | High rate bins dominated by noise | Noise dominated (total time) | Noise dominated (detector-on time) | Marked lightcurve |
|---|---|---|---|---|---|---|---|
| A | 7252 | 6808 | 0 | 0 | 0.00% | 0.00% |  |
| B | 7252 | 6807 | 350 | 350 | 4.83% | 5.14% | 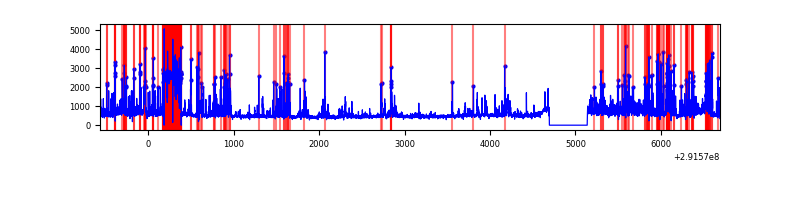 |
| C | 7252 | 6808 | 0 | 0 | 0.00% | 0.00% | 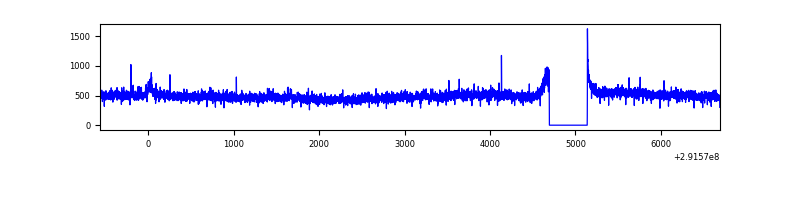 |
| D | 7252 | 6808 | 1136 | 1136 | 15.66% | 16.69% | 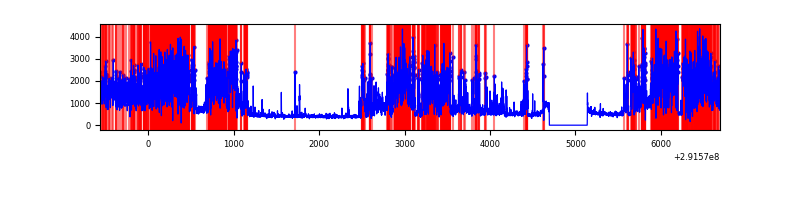 |
Top three noisy pixels from each quadrant. If the there are fewer than three noisy pixels in the level2.evt file, extra rows are filled as -1
| Pixel properties | Quadrant properties | ||||||
|---|---|---|---|---|---|---|---|
| Quadrant | DetID | PixID | Counts | Sigma | Mean | Median | Sigma |
| A | 3 | 1 | 11580 | 63.94 | 822 | 803 | 168.5 |
| A | 9 | 143 | 10942 | 60.16 | 822 | 803 | 168.5 |
| A | 13 | 254 | 9843 | 53.64 | 822 | 803 | 168.5 |
| B | 3 | 112 | 1605905 | 10528.35 | 787 | 767 | 152.5 |
| B | 7 | 220 | 180948 | 1181.83 | 787 | 767 | 152.5 |
| B | 4 | 216 | 56083 | 362.83 | 787 | 767 | 152.5 |
| C | 3 | 233 | 154218 | 823.94 | 788 | 791 | 186.2 |
| C | 14 | 238 | 120935 | 645.2 | 788 | 791 | 186.2 |
| C | 8 | 128 | 7628 | 36.71 | 788 | 791 | 186.2 |
| D | 7 | 238 | 4869209 | 27175.34 | 722 | 698 | 179.2 |
| D | 1 | 52 | 127098 | 705.54 | 722 | 698 | 179.2 |
| D | 7 | 96 | 94039 | 521.01 | 722 | 698 | 179.2 |
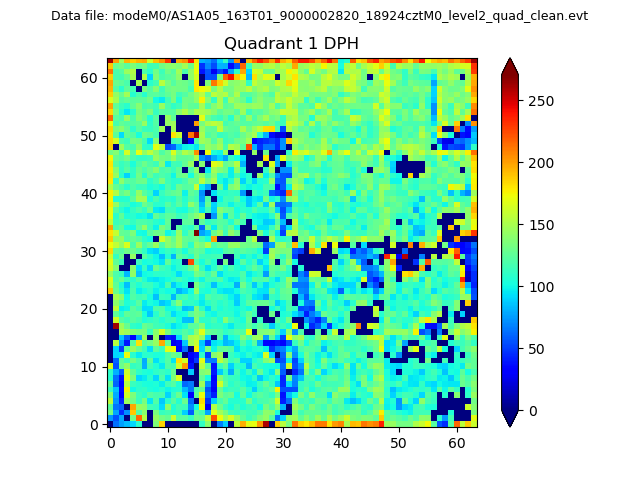
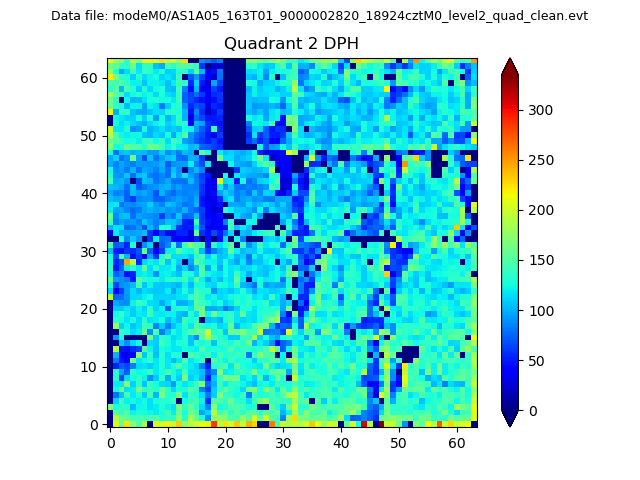
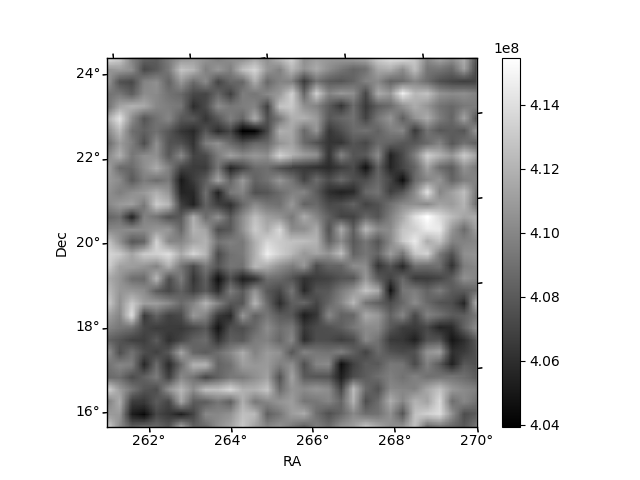
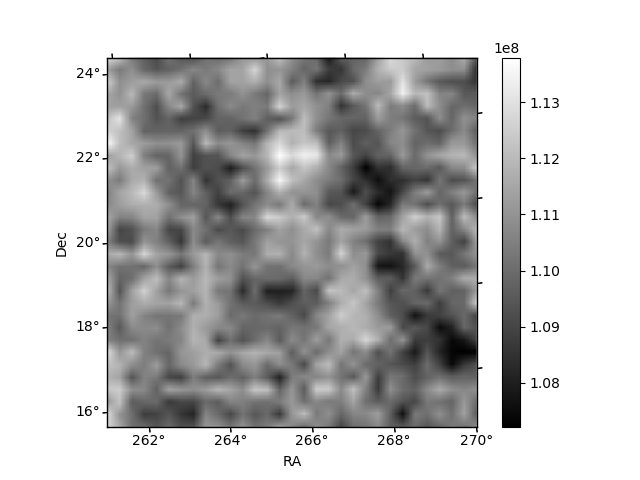
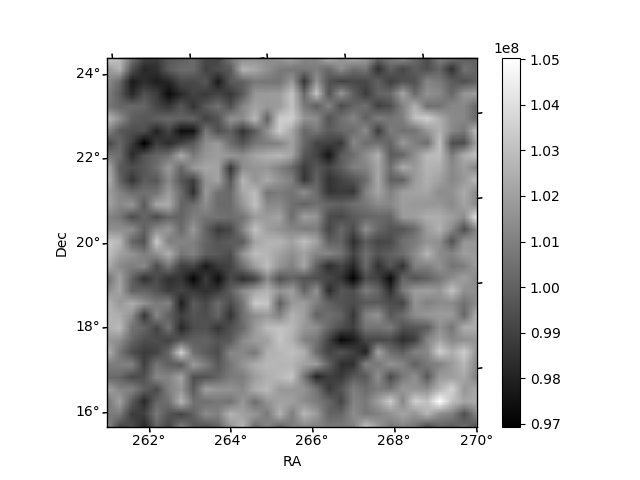
Histogram calculated using DETX and DETY for each event in the final _common_clean file
| Quadrant A | 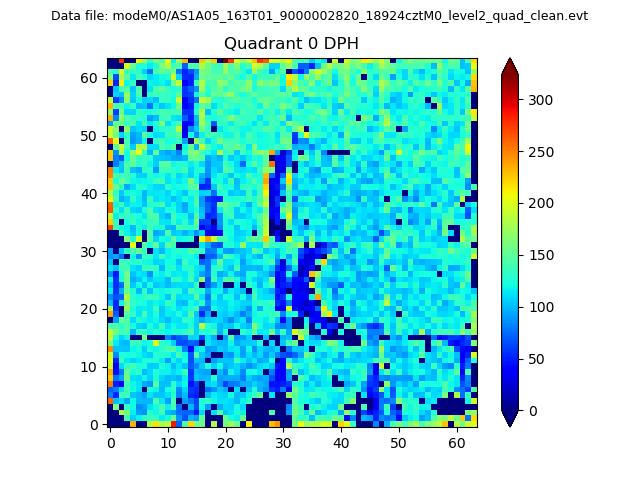 |
 |
Quadrant B |
|---|---|---|---|
| Quadrant D | 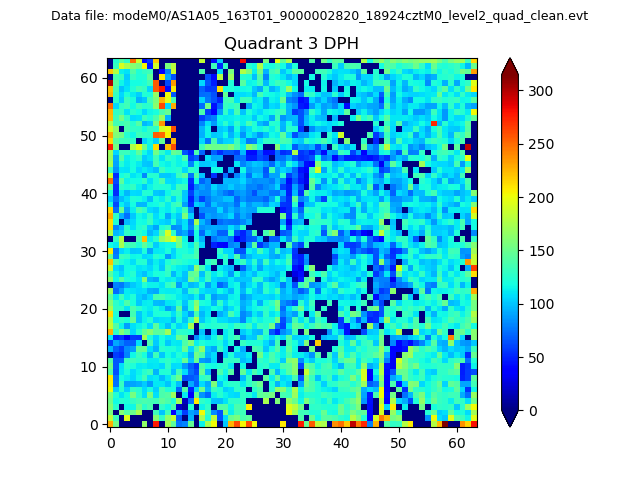 |
 |
Quadrant C |
| Plot type | Count rate plots | Images |
|---|---|---|
| Comparison with Poisson distribution Blue bars denote a histogram of data divided into 1 sec bins. Red curve is a Poisson curve with rate = median count rate of data. |
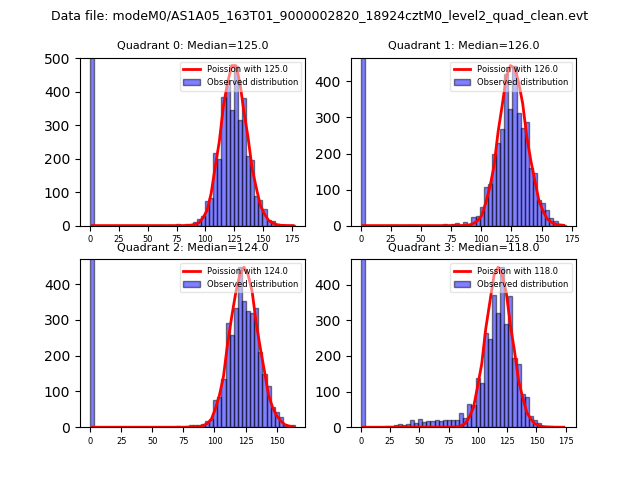 |
 |
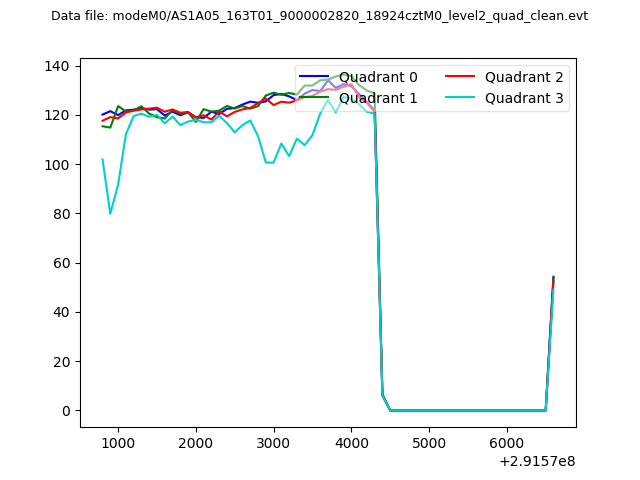
| Quadrant-wise count rates Data is divided into 100 sec bins |
 |
|
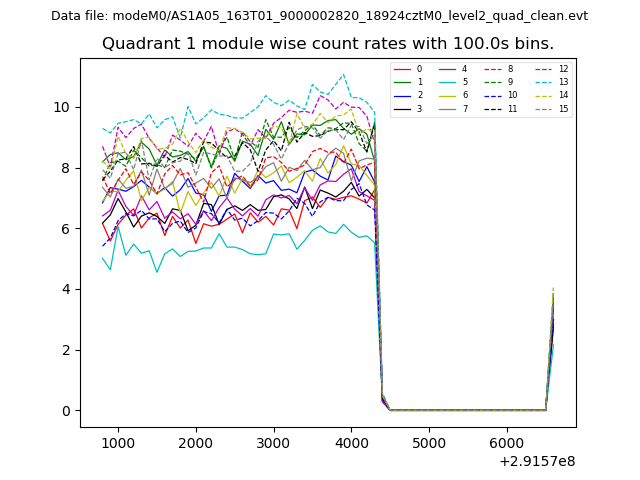
| Module-wise count rates for Quadrant A Data is divided into 100 sec bins |
 |
 |
| Module-wise count rates for Quadrant B Data is divided into 100 sec bins |
 |
 |
| Module-wise count rates for Quadrant C Data is divided into 100 sec bins |
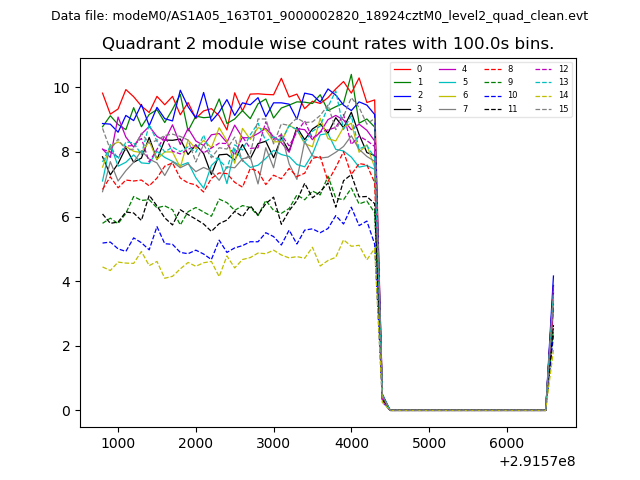 |
 |
| Module-wise count rates for Quadrant D Data is divided into 100 sec bins |
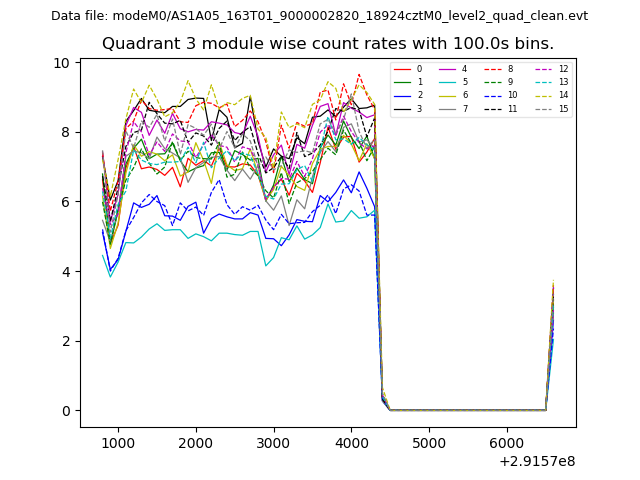 |
 |
| Parameter | Plot |
|---|---|
| CZT HV Monitor | 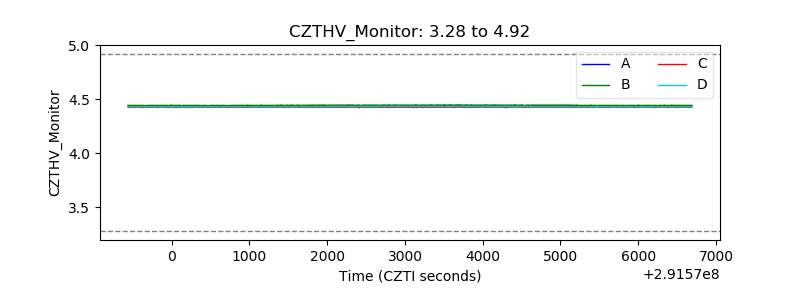 |
| D_VDD | 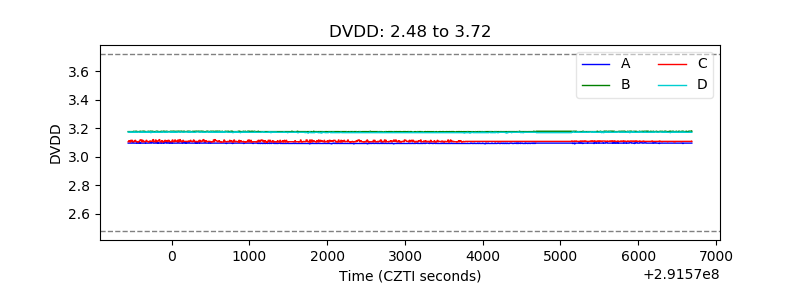 |
| Temperature 1 | 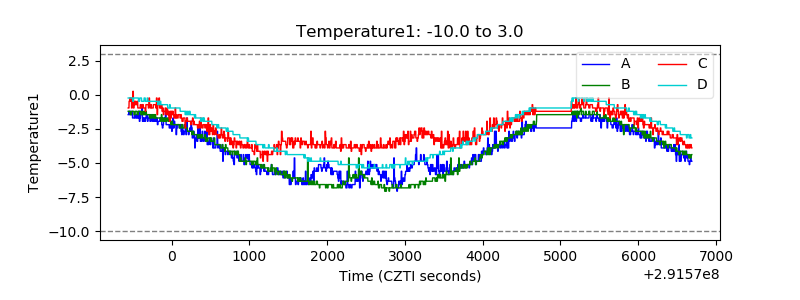 |
| Veto HV Monitor | 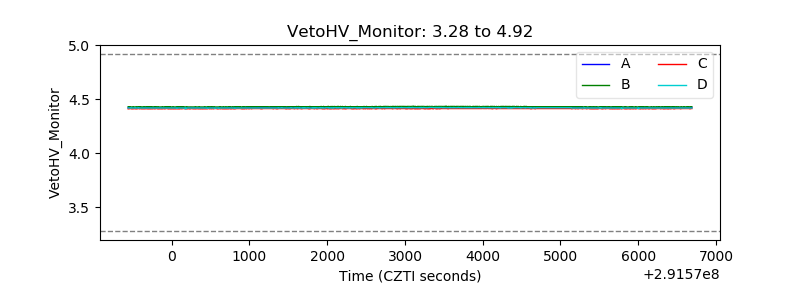 |
| Veto LLD | 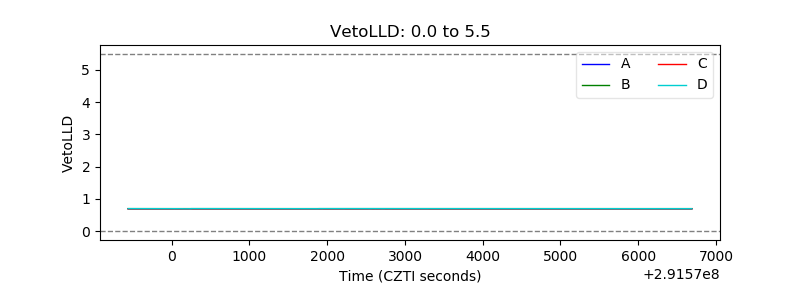 |
| Alpha Counter | 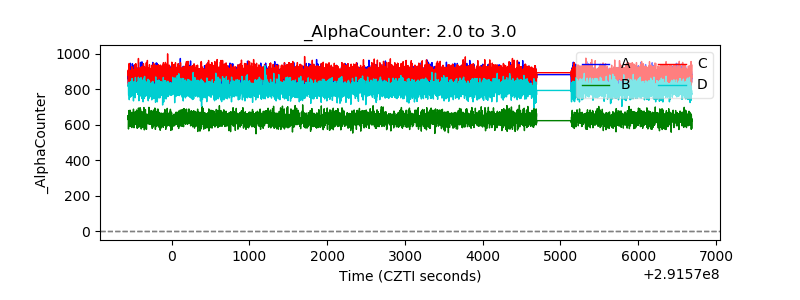 |
| _CPM_Rate | 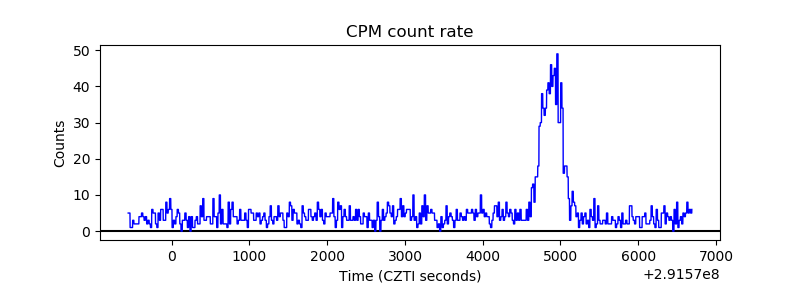 |
| CZT Counter | 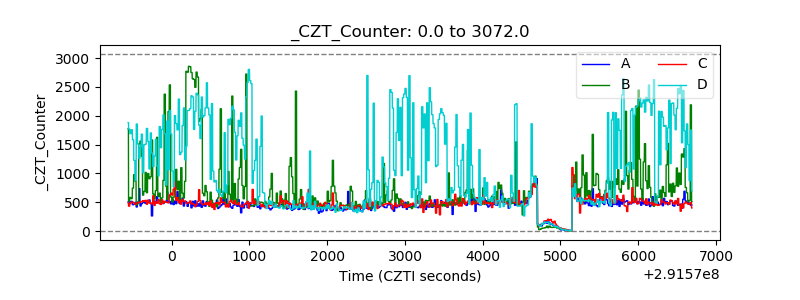 |
| +2.5 Volts monitor |  |
| +5 Volts monitor |  |
| _ROLL_ROT | 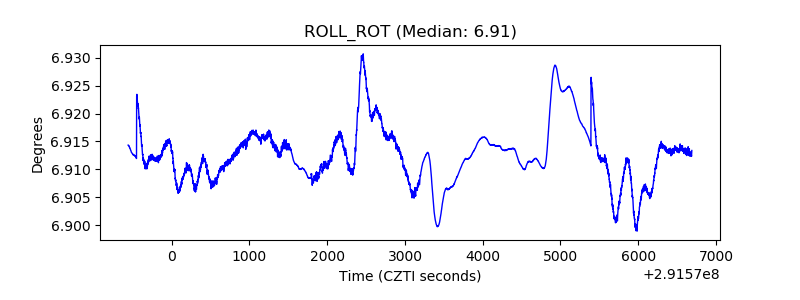 |
| _Roll_DEC |  |
| _Roll_RA | 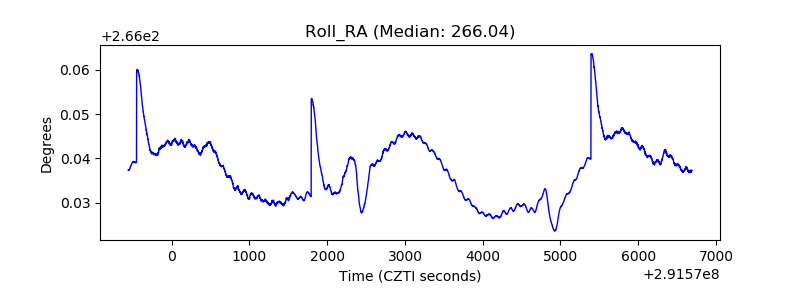 |
| Veto Counter | 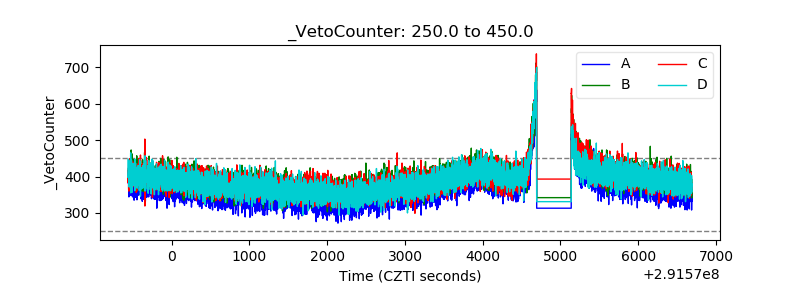 |