| Param | Original file | Final file |
|---|---|---|
| Filename | modeM0/AS1A05_163T01_9000002820_18926cztM0_level2.evt | modeM0/AS1A05_163T01_9000002820_18926cztM0_level2_quad_clean.evt |
| Size (bytes) | 1,207,860,480 | 154,926,720 |
| Size | 1.1 GB | 147.7 MB |
| Events in quadrant A | 5,917,271 | 984,826 |
| Events in quadrant B | 9,320,772 | 963,463 |
| Events in quadrant C | 6,705,882 | 975,738 |
| Events in quadrant D | 13,782,777 | 893,195 |
| Mode M0 | |||
|---|---|---|---|
| Quadrant | BADHDUFLAG | Total packets | Discarded packets |
| A | 0 | 25908 | 3 |
| B | 0 | 36222 | 3 |
| C | 0 | 27855 | 3 |
| D | 0 | 49541 | 3 |
| Mode SS | |||
|---|---|---|---|
| Quadrant | BADHDUFLAG | Total packets | Discarded packets |
| A | 0 | 256 | 0 |
| B | 0 | 256 | 0 |
| C | 0 | 256 | 0 |
| D | 0 | 256 | 0 |
| Mode M9 | |||
|---|---|---|---|
| Quadrant | BADHDUFLAG | Total packets | Discarded packets |
| A | 0 | 14 | 0 |
| B | 0 | 15 | 0 |
| C | 0 | 15 | 0 |
| D | 0 | 15 | 0 |
| Quadrant | Total seconds | Saturated seconds | Saturation percentage |
|---|---|---|---|
| A | 12654 | 76 | 0.600601% |
| B | 12654 | 934 | 7.381065% |
| C | 12653 | 225 | 1.778234% |
| D | 12653 | 2680 | 21.180748% |
Noise dominated data is calculated using 1-second bins in cleaned event files. If a bin has >2000 counts, and if more than 50% of those come from <1% of pixels, then it is considered to be noise-dominated and hence unusable.
| Quadrant | # 1 sec bins | Bins with >0 counts | Bins with >2000 counts | High rate bins dominated by noise | Noise dominated (total time) | Noise dominated (detector-on time) | Marked lightcurve |
|---|---|---|---|---|---|---|---|
| A | 14004 | 12656 | 3 | 3 | 0.02% | 0.02% | 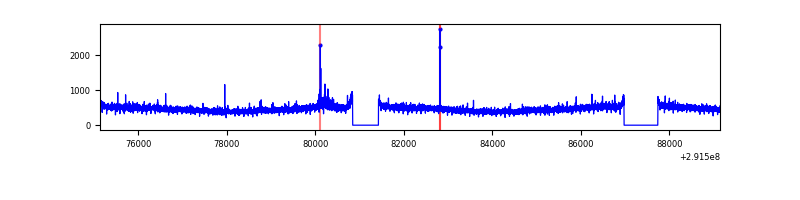 |
| B | 14004 | 12656 | 506 | 506 | 3.61% | 4.00% | 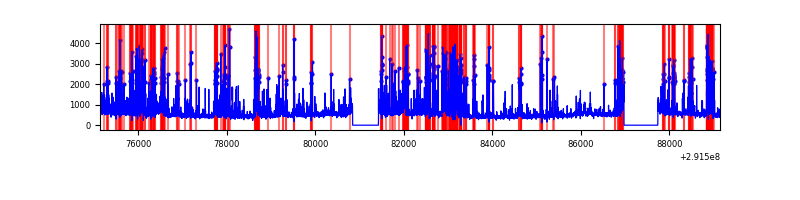 |
| C | 14003 | 12655 | 2 | 2 | 0.01% | 0.02% | 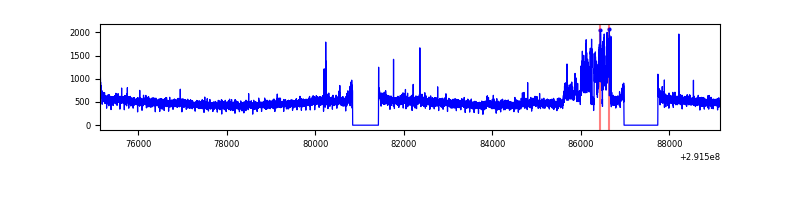 |
| D | 14003 | 12655 | 1861 | 1861 | 13.29% | 14.71% | 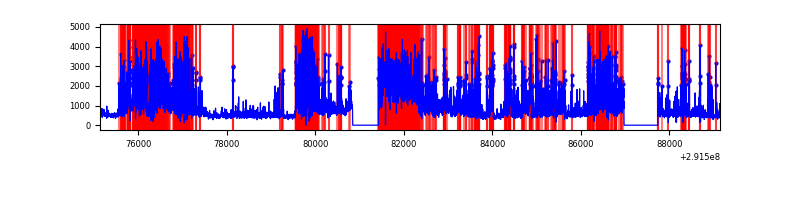 |
Top three noisy pixels from each quadrant. If the there are fewer than three noisy pixels in the level2.evt file, extra rows are filled as -1
| Pixel properties | Quadrant properties | ||||||
|---|---|---|---|---|---|---|---|
| Quadrant | DetID | PixID | Counts | Sigma | Mean | Median | Sigma |
| A | 14 | 235 | 41020 | 127.96 | 1523 | 1488 | 308.9 |
| A | 13 | 254 | 19141 | 57.14 | 1523 | 1488 | 308.9 |
| A | 0 | 226 | 13280 | 38.17 | 1523 | 1488 | 308.9 |
| B | 3 | 112 | 2869772 | 10174.11 | 1480 | 1444 | 281.9 |
| B | 7 | 220 | 179591 | 631.89 | 1480 | 1444 | 281.9 |
| B | 10 | 247 | 176606 | 621.31 | 1480 | 1444 | 281.9 |
| C | 3 | 233 | 716150 | 2088.42 | 1463 | 1472 | 342.2 |
| C | 14 | 238 | 228325 | 662.91 | 1463 | 1472 | 342.2 |
| C | 9 | 221 | 22866 | 62.52 | 1463 | 1472 | 342.2 |
| D | 7 | 238 | 7457213 | 22743.6 | 1345 | 1307 | 327.8 |
| D | 1 | 52 | 839511 | 2556.87 | 1345 | 1307 | 327.8 |
| D | 12 | 218 | 192065 | 581.89 | 1345 | 1307 | 327.8 |
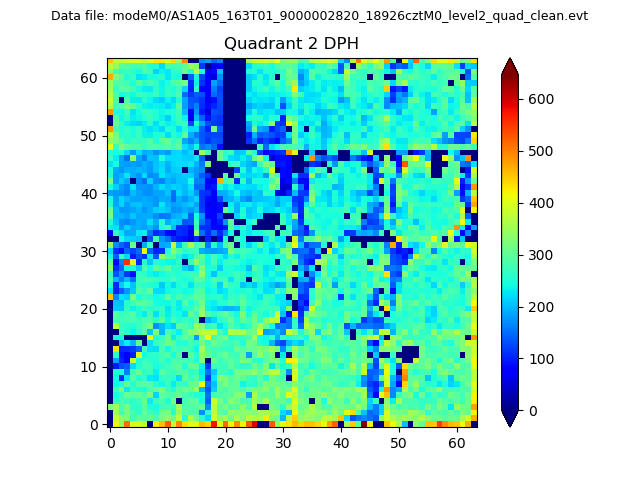
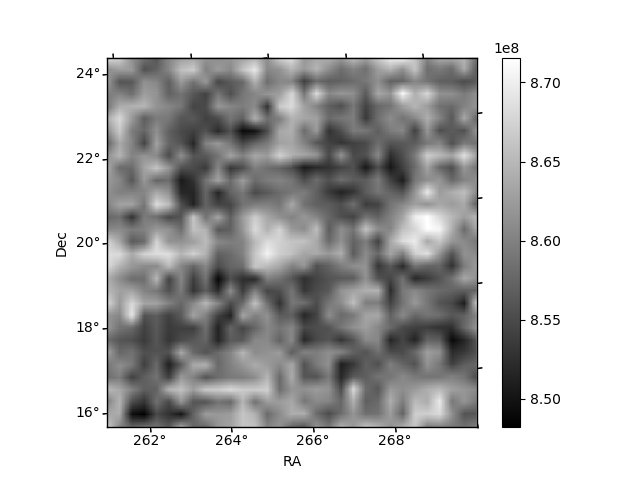
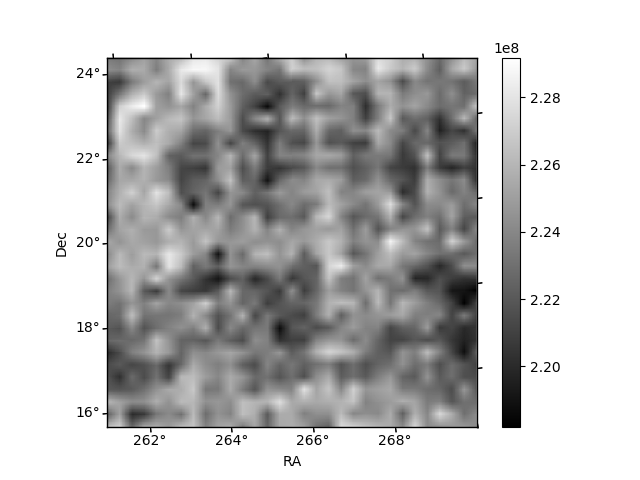
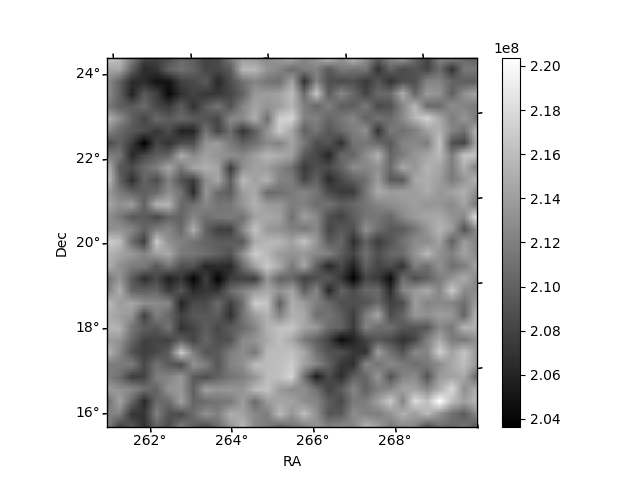
Histogram calculated using DETX and DETY for each event in the final _common_clean file
| Quadrant A | 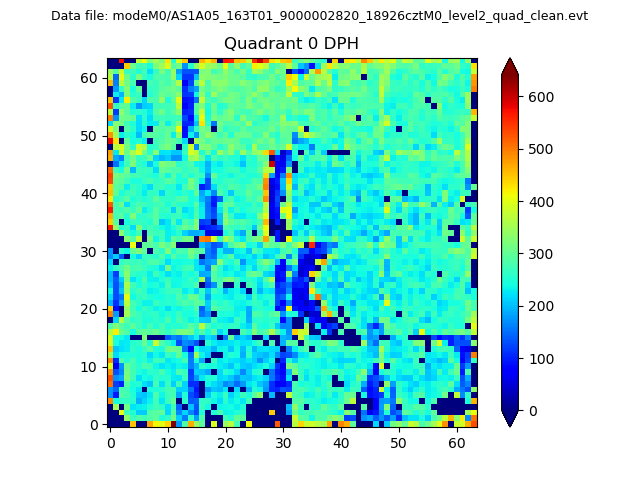 |
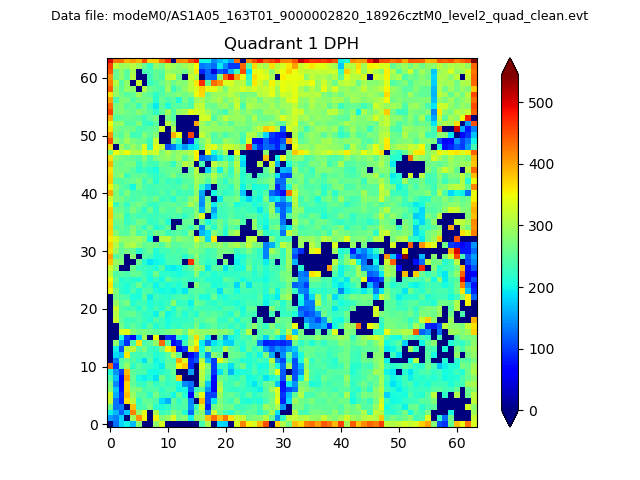 |
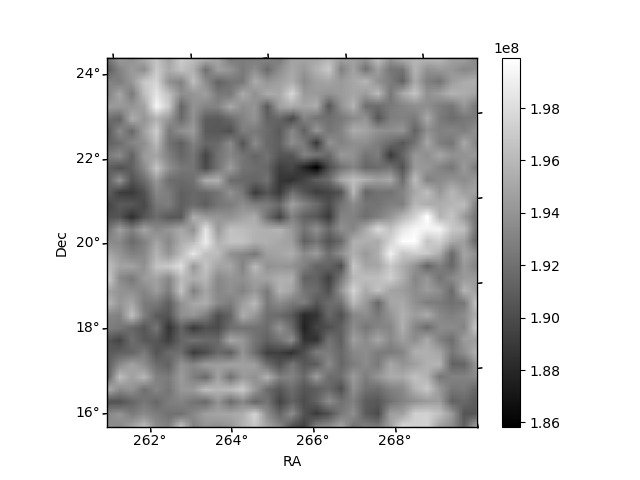
Quadrant B |
|---|---|---|---|
| Quadrant D | 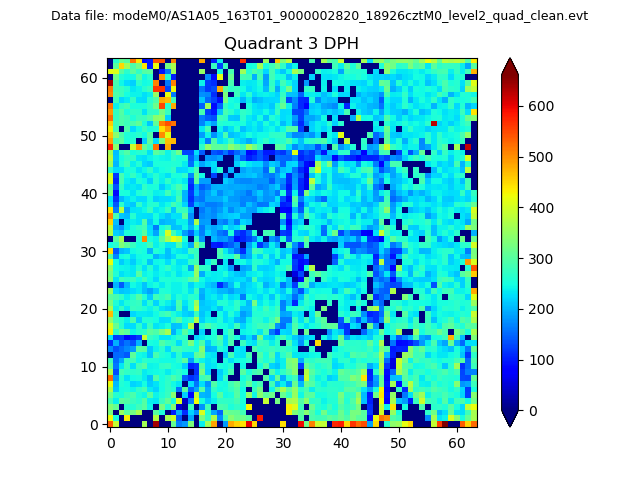 |
 |
Quadrant C |
| Plot type | Count rate plots | Images |
|---|---|---|
| Comparison with Poisson distribution Blue bars denote a histogram of data divided into 1 sec bins. Red curve is a Poisson curve with rate = median count rate of data. |
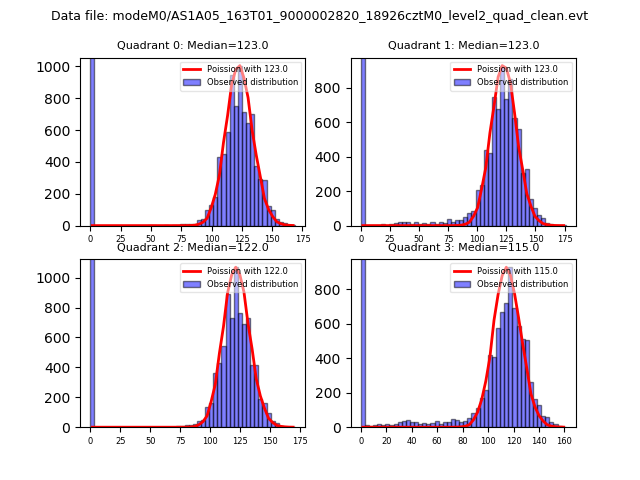 |
 |
| Quadrant-wise count rates Data is divided into 100 sec bins |
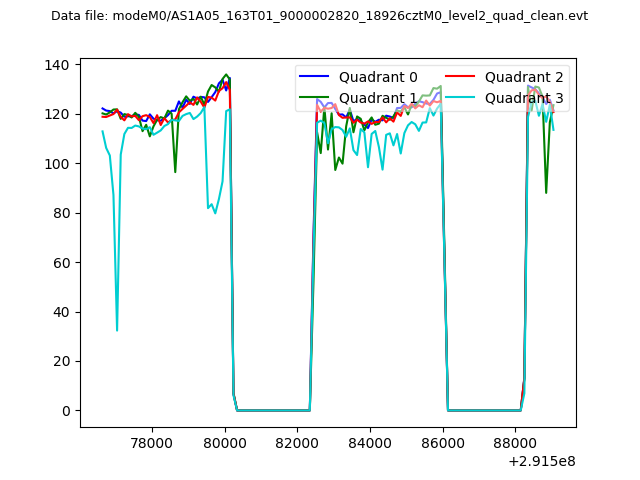 |
|
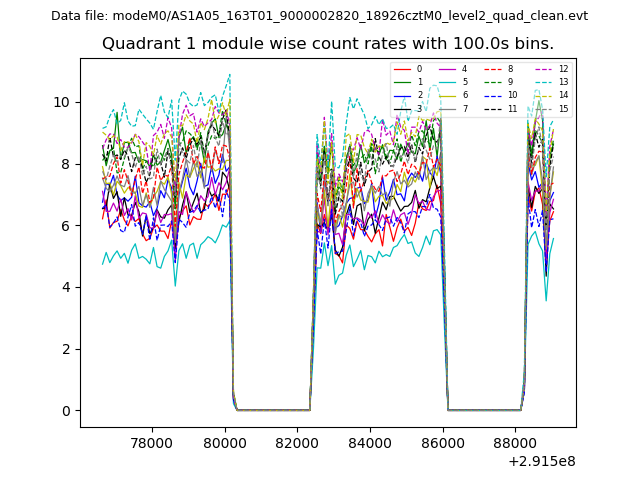
| Module-wise count rates for Quadrant A Data is divided into 100 sec bins |
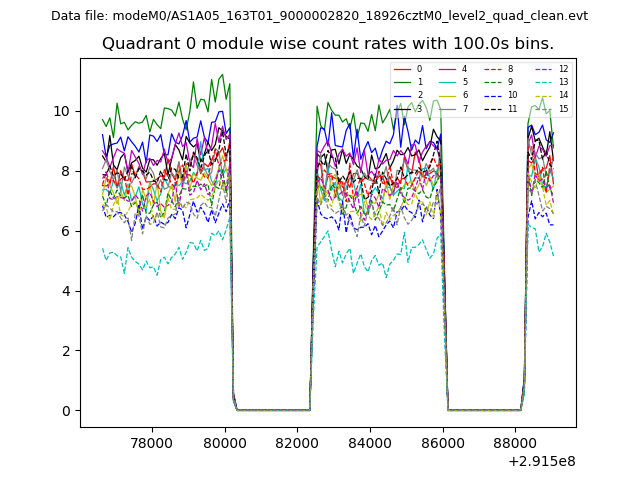 |
 |
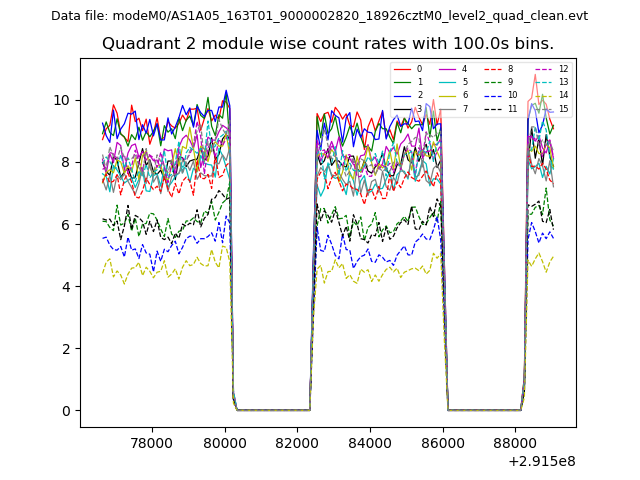
| Module-wise count rates for Quadrant B Data is divided into 100 sec bins |
 |
 |
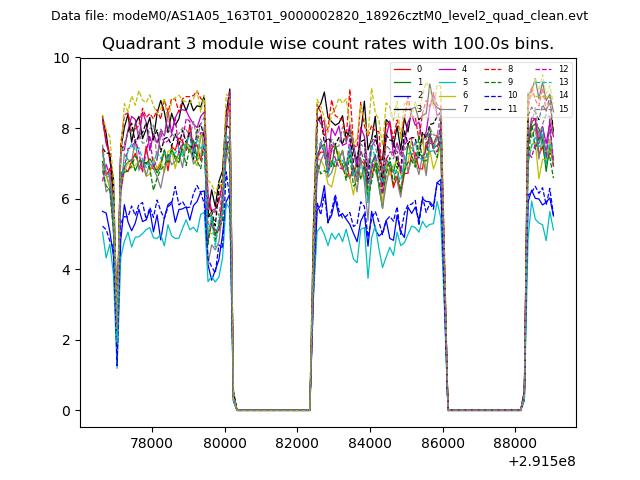
| Module-wise count rates for Quadrant C Data is divided into 100 sec bins |
 |
 |
| Module-wise count rates for Quadrant D Data is divided into 100 sec bins |
 |
 |
| Parameter | Plot |
|---|---|
| CZT HV Monitor | 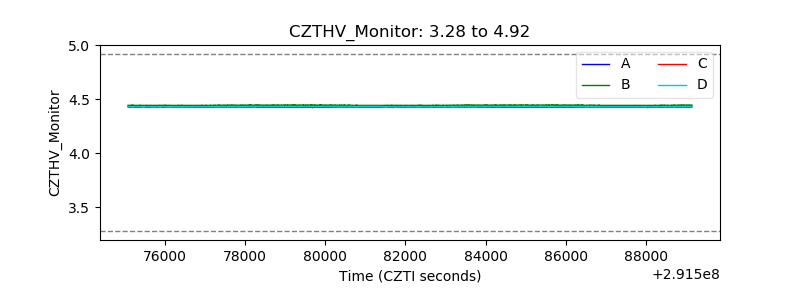 |
| D_VDD | 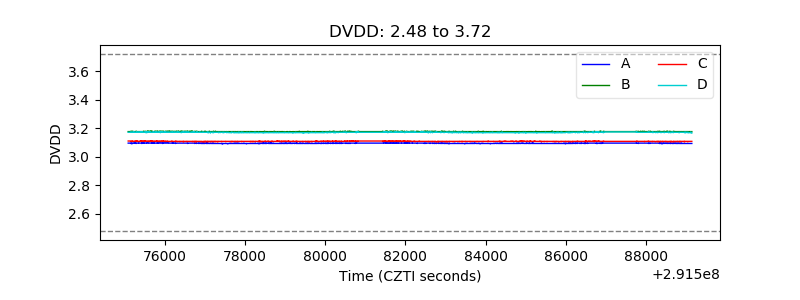 |
| Temperature 1 | 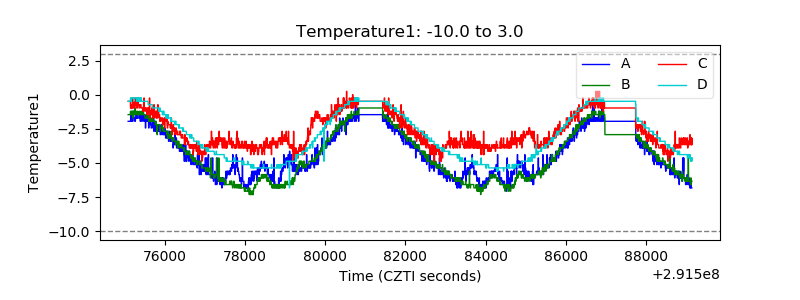 |
| Veto HV Monitor | 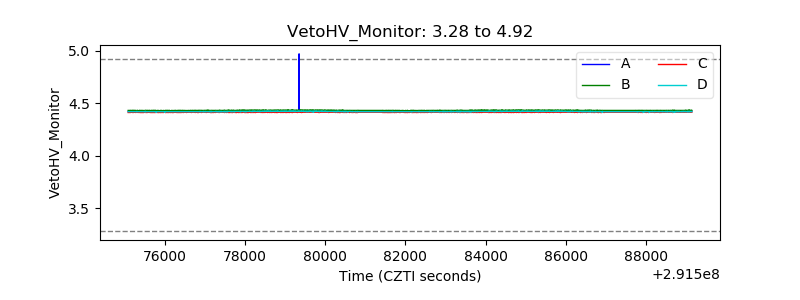 |
| Veto LLD | 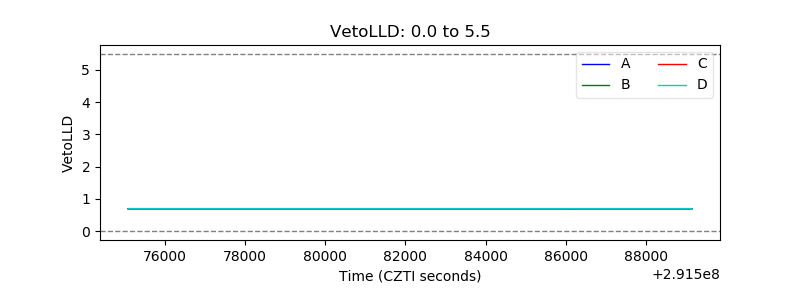 |
| Alpha Counter | 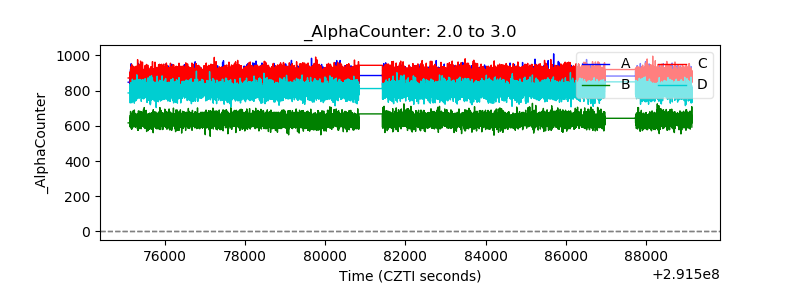 |
| _CPM_Rate | 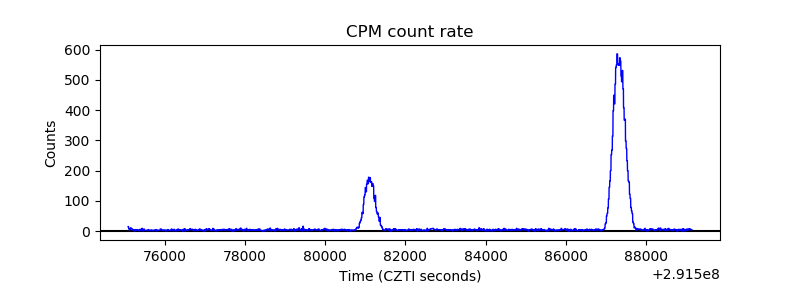 |
| CZT Counter | 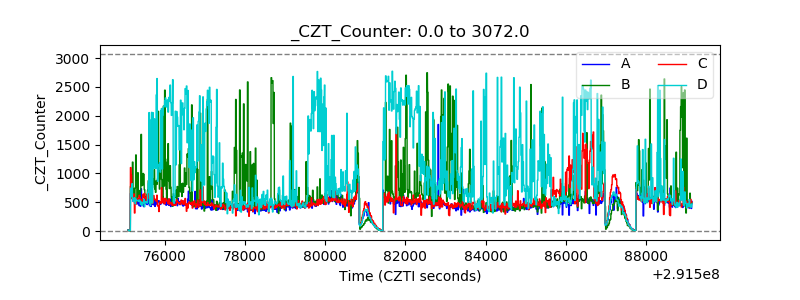 |
| +2.5 Volts monitor |  |
| +5 Volts monitor |  |
| _ROLL_ROT | 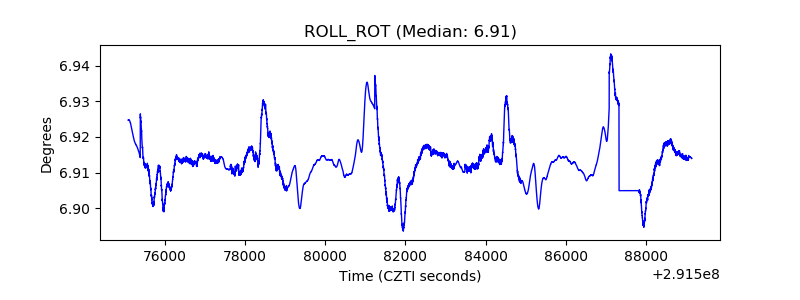 |
| _Roll_DEC | 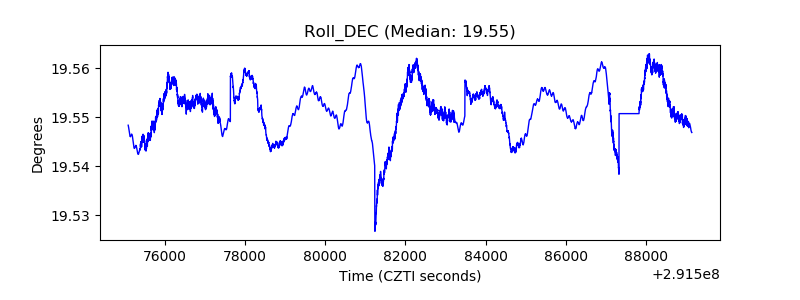 |
| _Roll_RA | 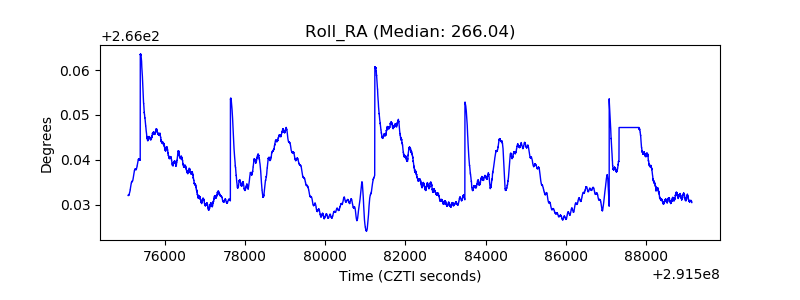 |
| Veto Counter | 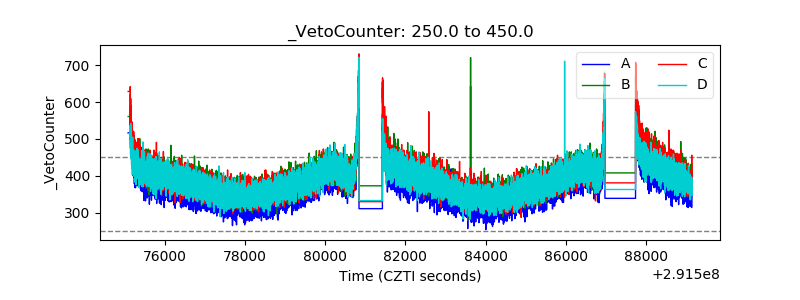 |