| Param | Original file | Final file |
|---|---|---|
| Filename | modeM0/AS1A05_163T01_9000002820_18927cztM0_level2.evt | modeM0/AS1A05_163T01_9000002820_18927cztM0_level2_quad_clean.evt |
| Size (bytes) | 517,697,280 | 94,052,160 |
| Size | 493.7 MB | 89.7 MB |
| Events in quadrant A | 3,556,535 | 601,780 |
| Events in quadrant B | 4,517,794 | 594,563 |
| Events in quadrant C | 3,281,523 | 602,712 |
| Events in quadrant D | 3,866,670 | 580,653 |
| Mode M0 | |||
|---|---|---|---|
| Quadrant | BADHDUFLAG | Total packets | Discarded packets |
| A | 0 | 14812 | 2 |
| B | 0 | 17964 | 2 |
| C | 0 | 13972 | 2 |
| D | 0 | 16140 | 2 |
| Mode SS | |||
|---|---|---|---|
| Quadrant | BADHDUFLAG | Total packets | Discarded packets |
| A | 0 | 138 | 0 |
| B | 0 | 138 | 0 |
| C | 0 | 138 | 0 |
| D | 0 | 138 | 0 |
| Mode M9 | |||
|---|---|---|---|
| Quadrant | BADHDUFLAG | Total packets | Discarded packets |
| A | 0 | 9 | 0 |
| B | 0 | 10 | 0 |
| C | 0 | 10 | 0 |
| D | 0 | 10 | 0 |
| Quadrant | Total seconds | Saturated seconds | Saturation percentage |
|---|---|---|---|
| A | 6714 | 44 | 0.655347% |
| B | 6714 | 475 | 7.074769% |
| C | 6714 | 64 | 0.953232% |
| D | 6714 | 228 | 3.395889% |
Noise dominated data is calculated using 1-second bins in cleaned event files. If a bin has >2000 counts, and if more than 50% of those come from <1% of pixels, then it is considered to be noise-dominated and hence unusable.
| Quadrant | # 1 sec bins | Bins with >0 counts | Bins with >2000 counts | High rate bins dominated by noise | Noise dominated (total time) | Noise dominated (detector-on time) | Marked lightcurve |
|---|---|---|---|---|---|---|---|
| A | 7659 | 6715 | 16 | 16 | 0.21% | 0.24% | 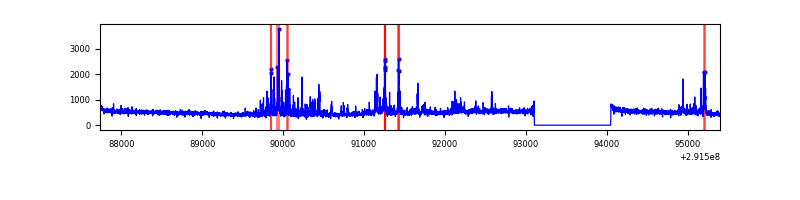 |
| B | 7659 | 6715 | 180 | 180 | 2.35% | 2.68% |  |
| C | 7659 | 6715 | 0 | 0 | 0.00% | 0.00% | 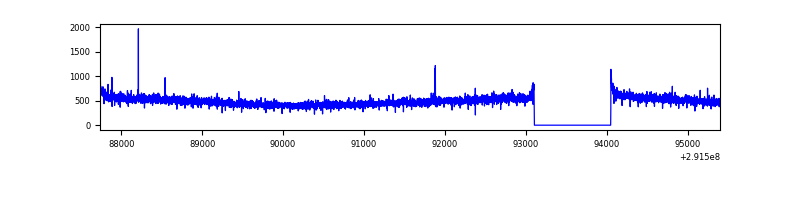 |
| D | 7659 | 6715 | 128 | 128 | 1.67% | 1.91% | 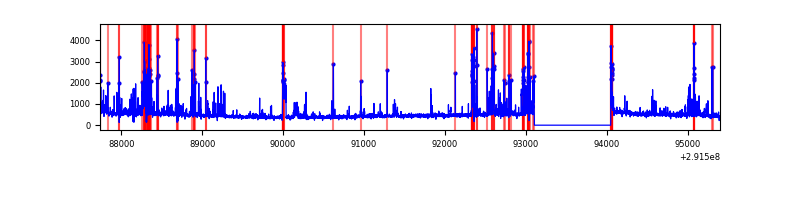 |
Top three noisy pixels from each quadrant. If the there are fewer than three noisy pixels in the level2.evt file, extra rows are filled as -1
| Pixel properties | Quadrant properties | ||||||
|---|---|---|---|---|---|---|---|
| Quadrant | DetID | PixID | Counts | Sigma | Mean | Median | Sigma |
| A | 14 | 235 | 424774 | 2572.63 | 812 | 795 | 164.8 |
| A | 13 | 254 | 9205 | 51.03 | 812 | 795 | 164.8 |
| A | 0 | 226 | 7026 | 37.81 | 812 | 795 | 164.8 |
| B | 3 | 112 | 1234928 | 8067.62 | 794 | 775 | 153.0 |
| B | 0 | 189 | 65910 | 425.79 | 794 | 775 | 153.0 |
| B | 7 | 220 | 42742 | 274.34 | 794 | 775 | 153.0 |
| C | 14 | 238 | 122305 | 659.81 | 787 | 794 | 184.2 |
| C | 3 | 233 | 76221 | 409.57 | 787 | 794 | 184.2 |
| C | 9 | 221 | 8856 | 43.78 | 787 | 794 | 184.2 |
| D | 12 | 218 | 450780 | 2369.59 | 780 | 758 | 189.9 |
| D | 1 | 52 | 237566 | 1246.91 | 780 | 758 | 189.9 |
| D | 7 | 238 | 87425 | 456.34 | 780 | 758 | 189.9 |
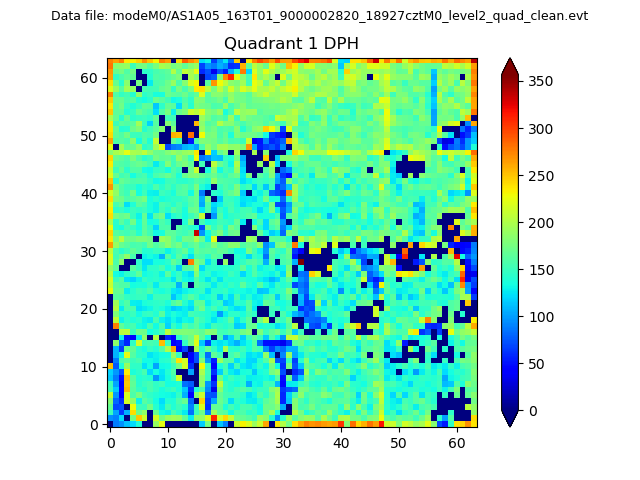
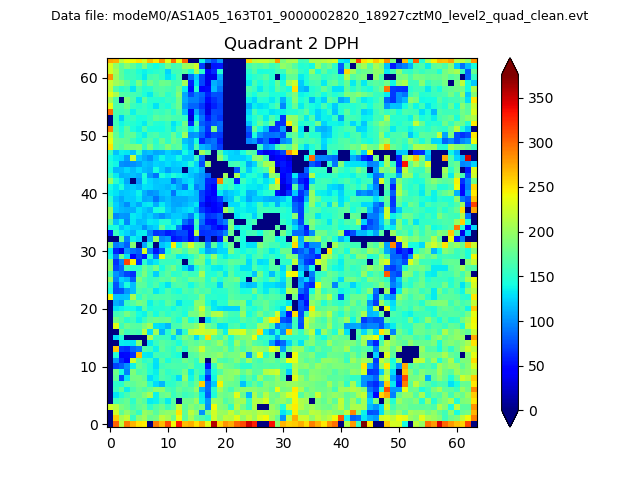
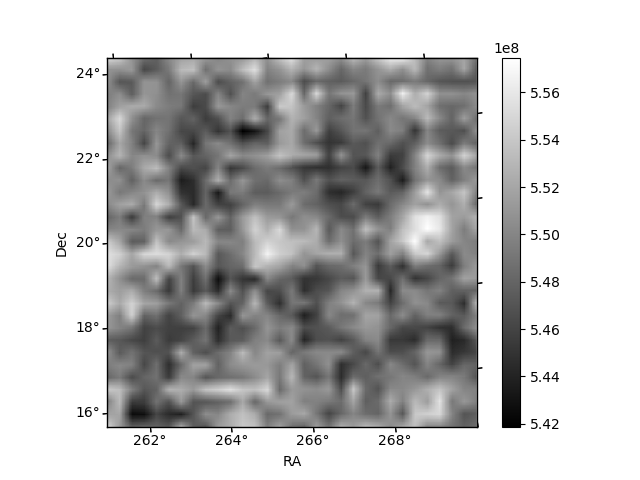
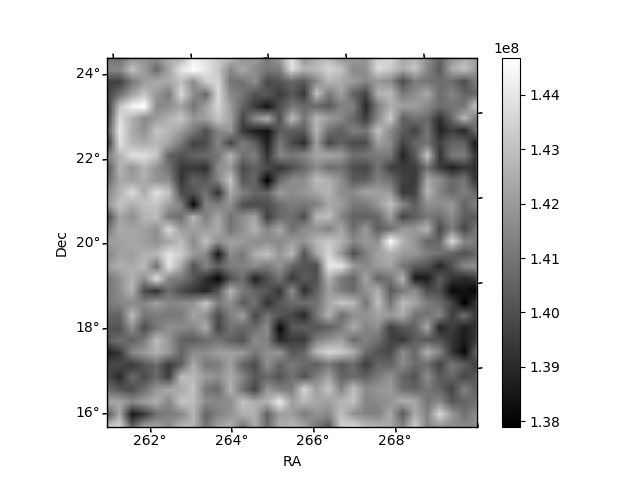
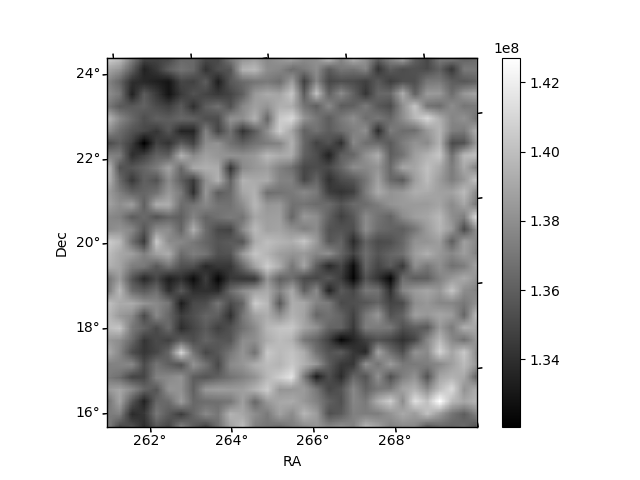
Histogram calculated using DETX and DETY for each event in the final _common_clean file
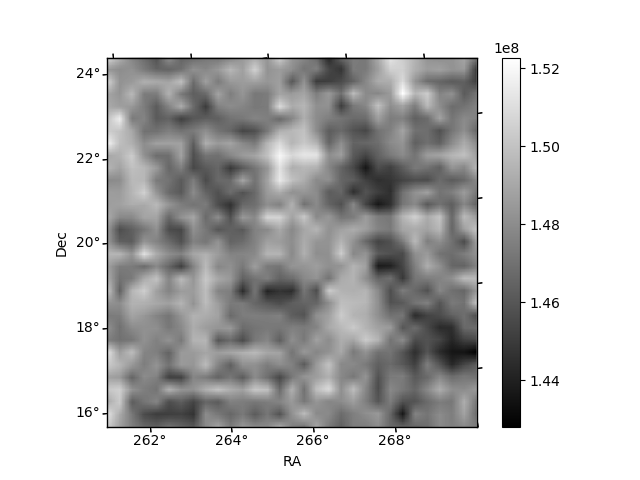
| Quadrant A | 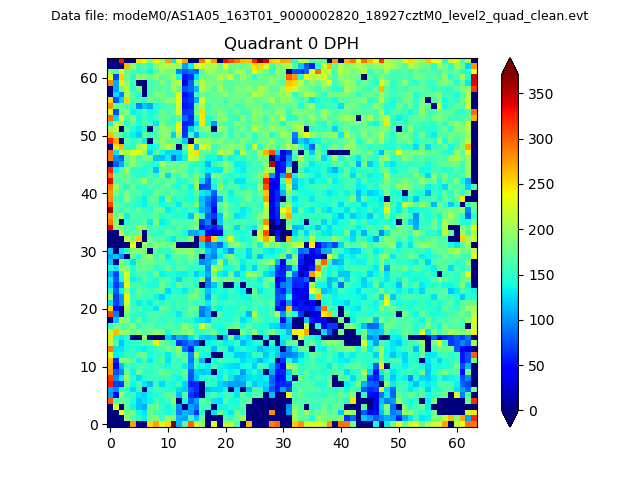 |
 |
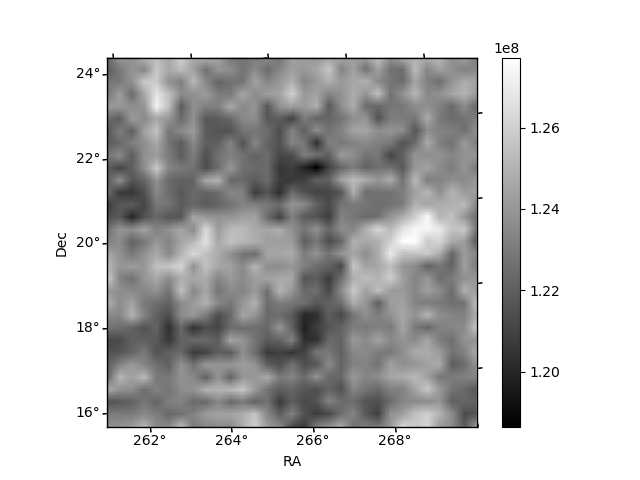
Quadrant B |
|---|---|---|---|
| Quadrant D | 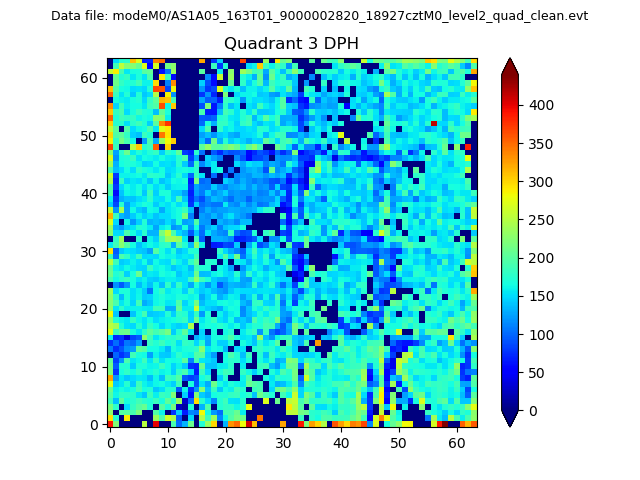 |
 |
Quadrant C |
| Plot type | Count rate plots | Images |
|---|---|---|
| Comparison with Poisson distribution Blue bars denote a histogram of data divided into 1 sec bins. Red curve is a Poisson curve with rate = median count rate of data. |
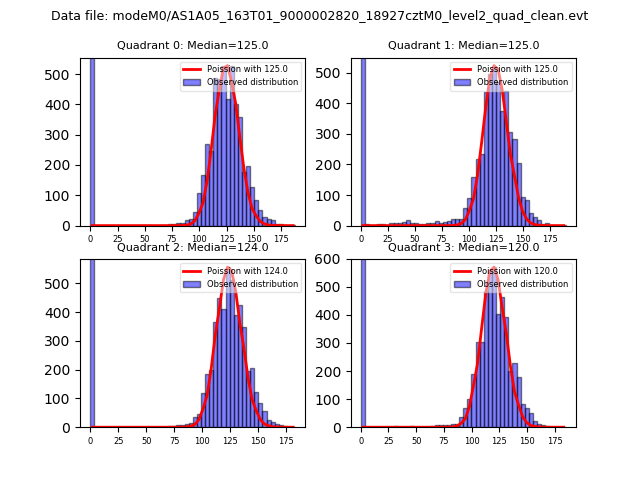 |
 |
| Quadrant-wise count rates Data is divided into 100 sec bins |
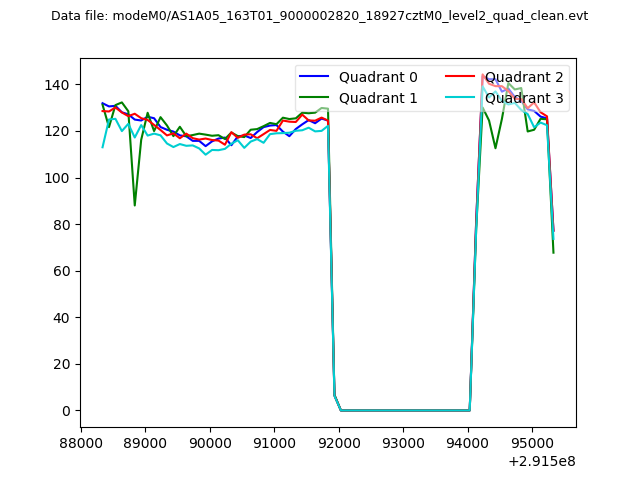 |
|
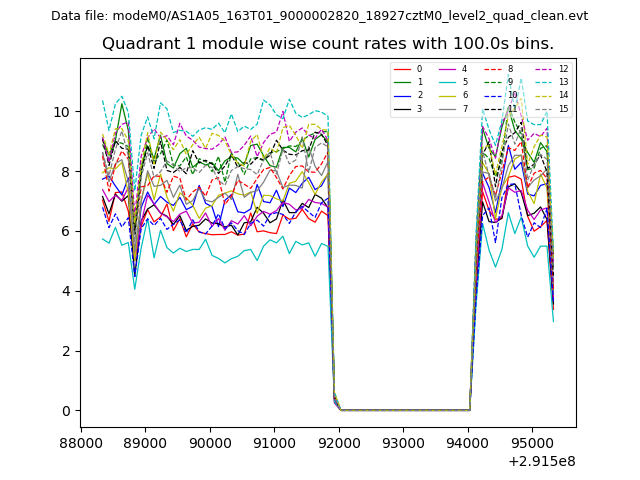
| Module-wise count rates for Quadrant A Data is divided into 100 sec bins |
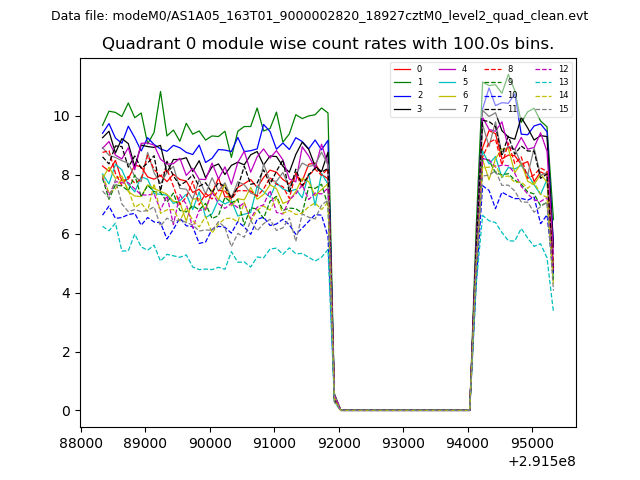 |
 |
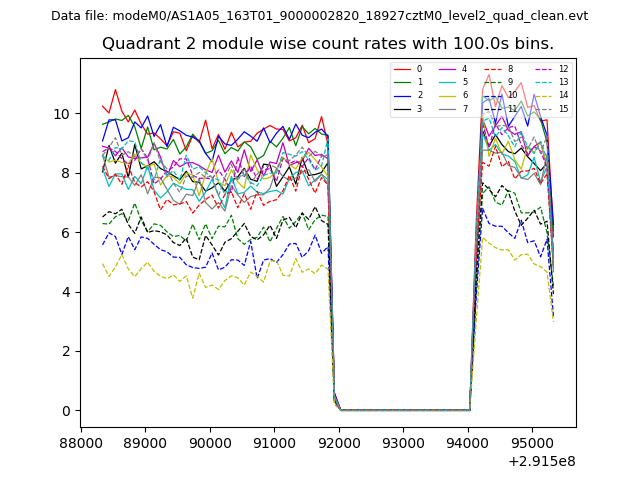
| Module-wise count rates for Quadrant B Data is divided into 100 sec bins |
 |
 |
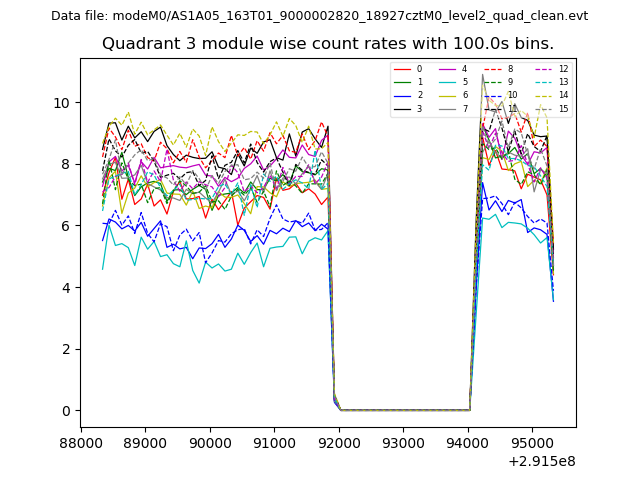
| Module-wise count rates for Quadrant C Data is divided into 100 sec bins |
 |
 |
| Module-wise count rates for Quadrant D Data is divided into 100 sec bins |
 |
 |
| Parameter | Plot |
|---|---|
| CZT HV Monitor | 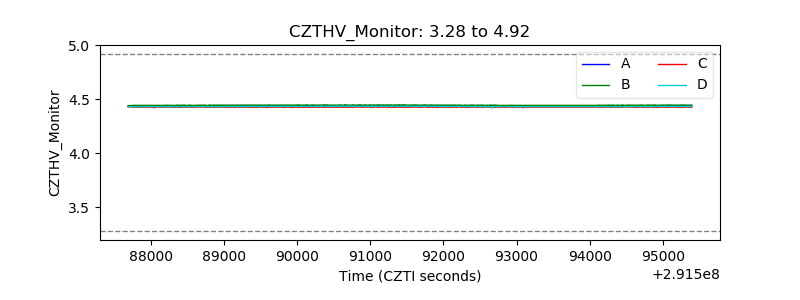 |
| D_VDD | 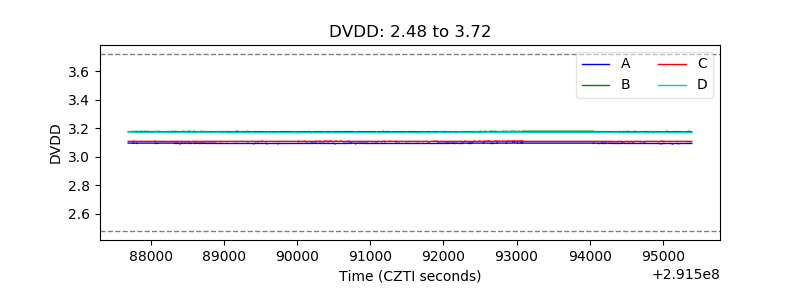 |
| Temperature 1 | 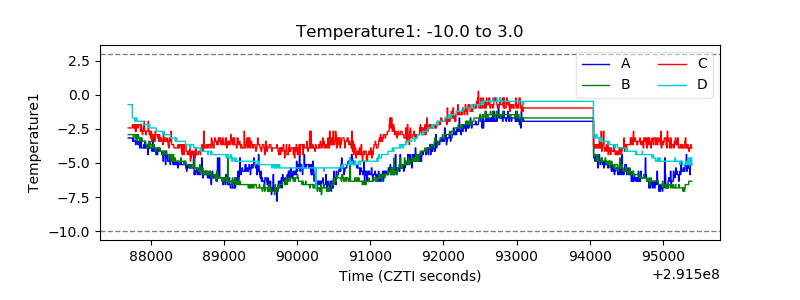 |
| Veto HV Monitor | 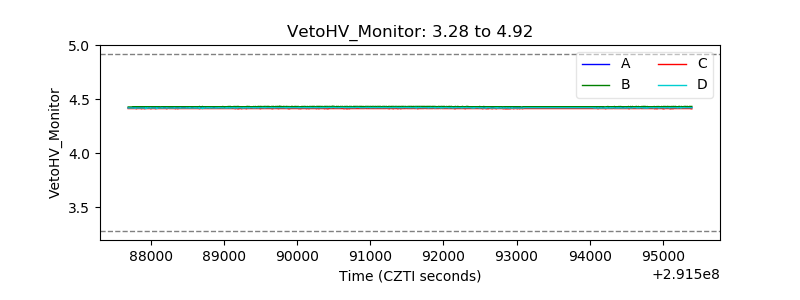 |
| Veto LLD | 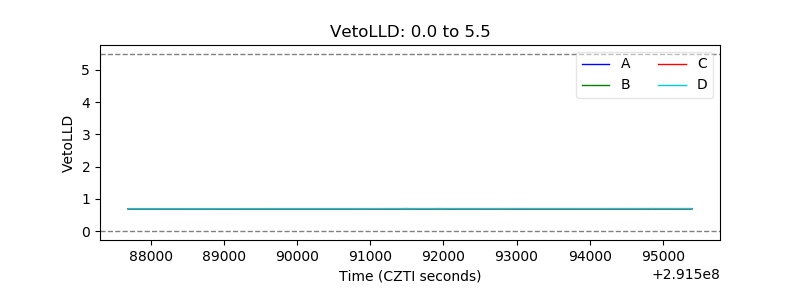 |
| Alpha Counter | 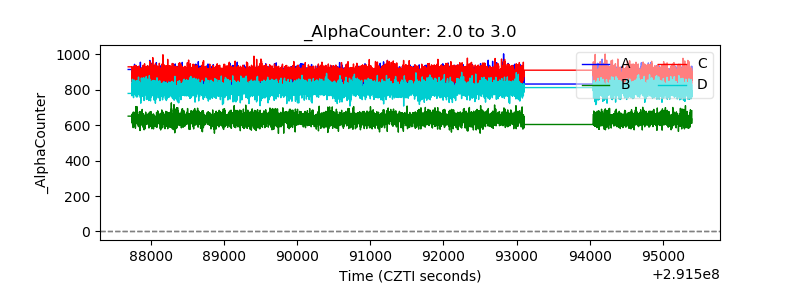 |
| _CPM_Rate | 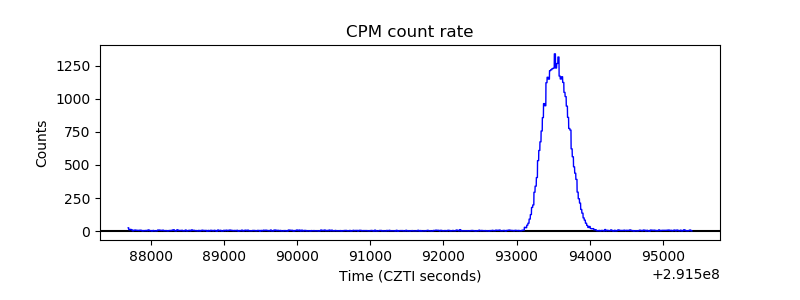 |
| CZT Counter | 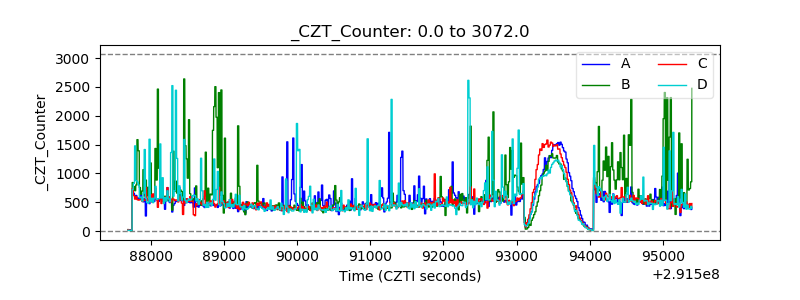 |
| +2.5 Volts monitor |  |
| +5 Volts monitor |  |
| _ROLL_ROT | 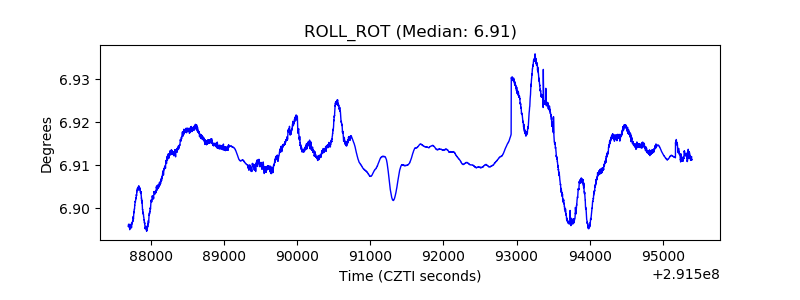 |
| _Roll_DEC | 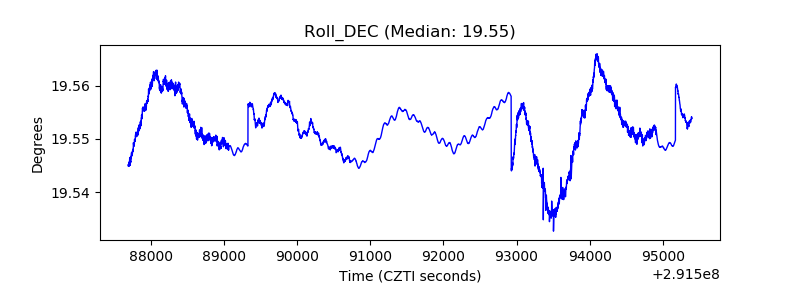 |
| _Roll_RA | 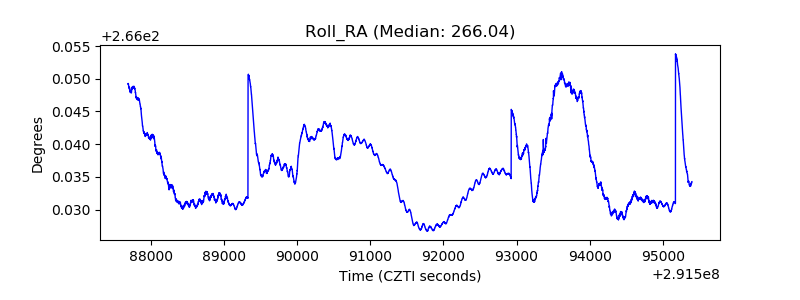 |
| Veto Counter | 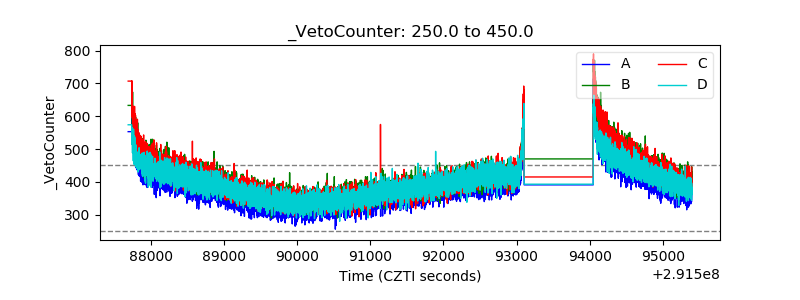 |