| Param | Original file | Final file |
|---|---|---|
| Filename | modeM0/AS1A05_163T01_9000002820_18932cztM0_level2.evt | modeM0/AS1A05_163T01_9000002820_18932cztM0_level2_quad_clean.evt |
| Size (bytes) | 494,997,120 | 87,416,640 |
| Size | 472.1 MB | 83.4 MB |
| Events in quadrant A | 3,269,313 | 572,031 |
| Events in quadrant B | 4,389,366 | 574,123 |
| Events in quadrant C | 3,116,649 | 553,047 |
| Events in quadrant D | 3,811,682 | 531,902 |
| Mode M0 | |||
|---|---|---|---|
| Quadrant | BADHDUFLAG | Total packets | Discarded packets |
| A | 0 | 13191 | 1 |
| B | 0 | 16758 | 1 |
| C | 0 | 12811 | 1 |
| D | 0 | 15182 | 1 |
| Mode SS | |||
|---|---|---|---|
| Quadrant | BADHDUFLAG | Total packets | Discarded packets |
| A | 0 | 122 | 0 |
| B | 0 | 122 | 0 |
| C | 0 | 122 | 0 |
| D | 0 | 122 | 0 |
| Mode M9 | |||
|---|---|---|---|
| Quadrant | BADHDUFLAG | Total packets | Discarded packets |
| A | 0 | 13 | 0 |
| B | 0 | 13 | 0 |
| C | 0 | 13 | 0 |
| D | 0 | 13 | 0 |
| Quadrant | Total seconds | Saturated seconds | Saturation percentage |
|---|---|---|---|
| A | 5954 | 33 | 0.554249% |
| B | 5954 | 501 | 8.414511% |
| C | 5954 | 73 | 1.226067% |
| D | 5954 | 78 | 1.310044% |
Noise dominated data is calculated using 1-second bins in cleaned event files. If a bin has >2000 counts, and if more than 50% of those come from <1% of pixels, then it is considered to be noise-dominated and hence unusable.
| Quadrant | # 1 sec bins | Bins with >0 counts | Bins with >2000 counts | High rate bins dominated by noise | Noise dominated (total time) | Noise dominated (detector-on time) | Marked lightcurve |
|---|---|---|---|---|---|---|---|
| A | 7314 | 5955 | 1 | 1 | 0.01% | 0.02% | 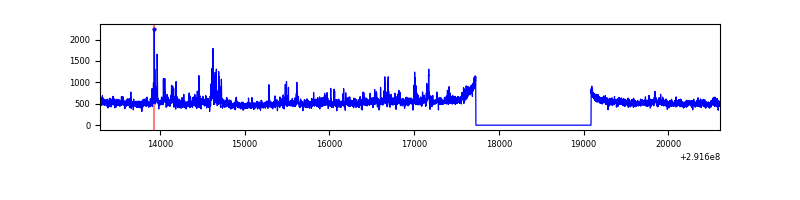 |
| B | 7314 | 5955 | 254 | 254 | 3.47% | 4.27% | 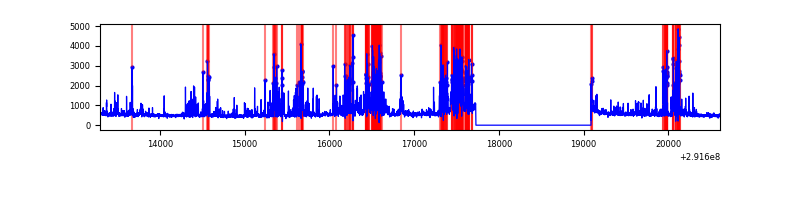 |
| C | 7314 | 5955 | 0 | 0 | 0.00% | 0.00% | 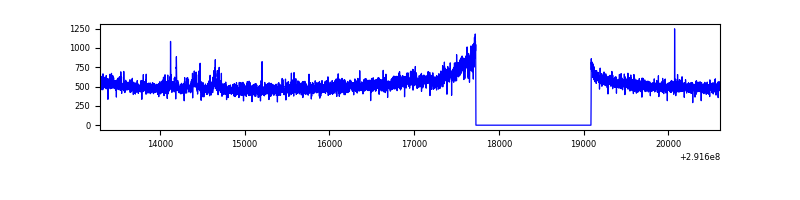 |
| D | 7314 | 5955 | 48 | 48 | 0.66% | 0.81% | 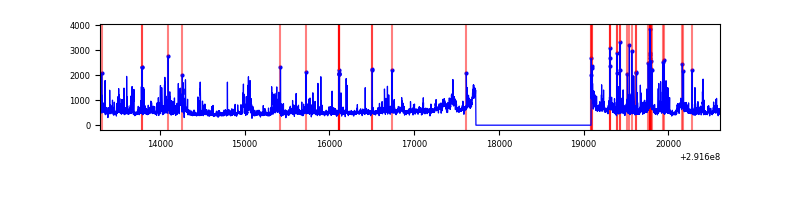 |
Top three noisy pixels from each quadrant. If the there are fewer than three noisy pixels in the level2.evt file, extra rows are filled as -1
| Pixel properties | Quadrant properties | ||||||
|---|---|---|---|---|---|---|---|
| Quadrant | DetID | PixID | Counts | Sigma | Mean | Median | Sigma |
| A | 14 | 235 | 251674 | 1602.29 | 779 | 764 | 156.6 |
| A | 15 | 174 | 12736 | 76.45 | 779 | 764 | 156.6 |
| A | 13 | 254 | 8403 | 48.78 | 779 | 764 | 156.6 |
| B | 3 | 112 | 1346515 | 9661.16 | 746 | 730 | 139.3 |
| B | 7 | 220 | 50116 | 354.53 | 746 | 730 | 139.3 |
| B | 0 | 197 | 21321 | 147.82 | 746 | 730 | 139.3 |
| C | 3 | 233 | 122063 | 710.62 | 737 | 744 | 170.7 |
| C | 14 | 238 | 118091 | 687.36 | 737 | 744 | 170.7 |
| C | 13 | 61 | 5282 | 26.58 | 737 | 744 | 170.7 |
| D | 7 | 238 | 501356 | 2804.84 | 743 | 724 | 178.5 |
| D | 1 | 52 | 247397 | 1382.01 | 743 | 724 | 178.5 |
| D | 12 | 218 | 109553 | 609.72 | 743 | 724 | 178.5 |
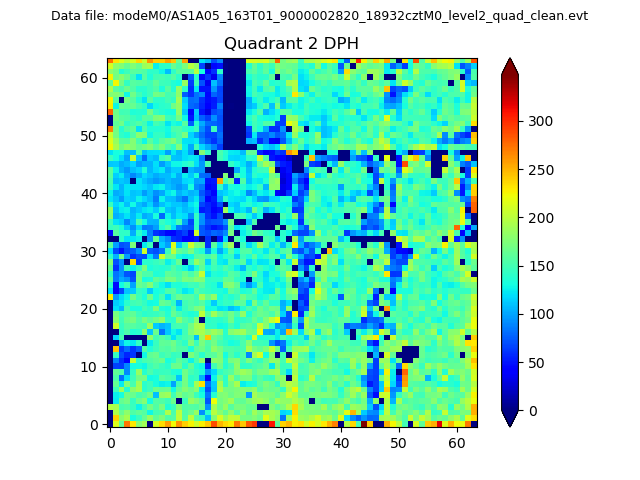
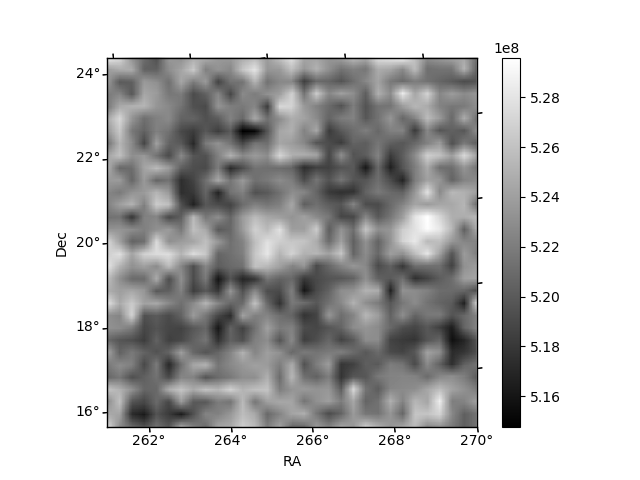
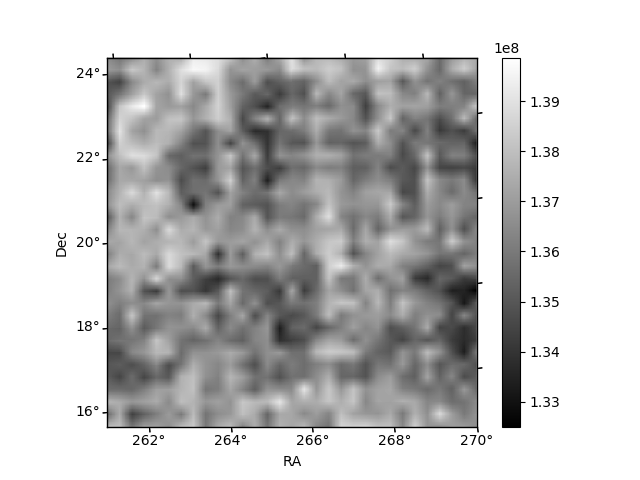
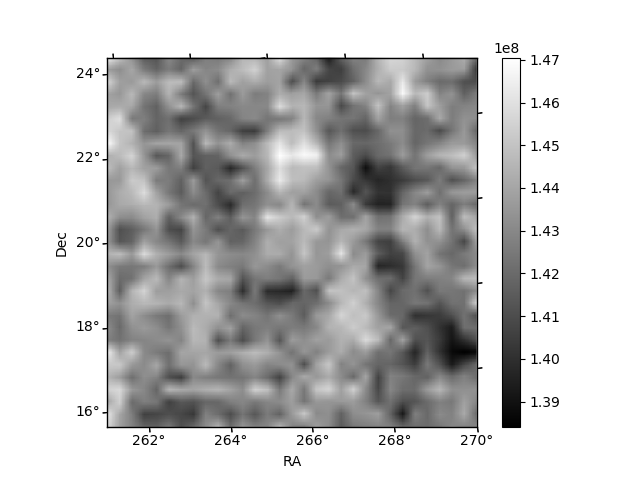
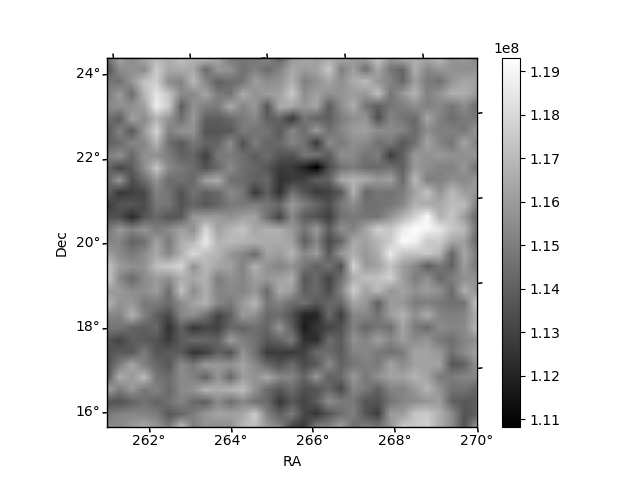
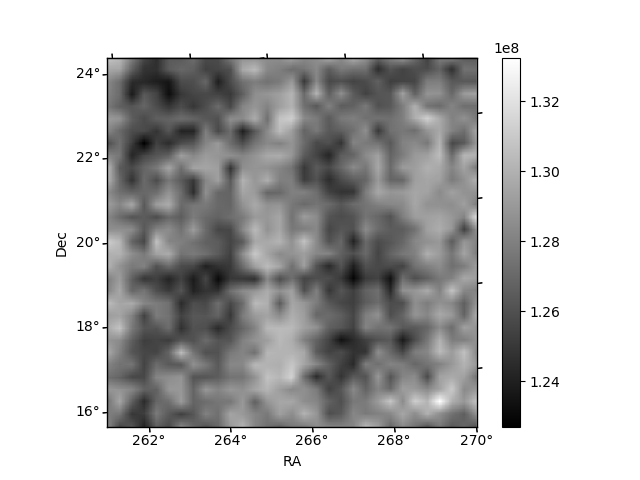
Histogram calculated using DETX and DETY for each event in the final _common_clean file
| Quadrant A | 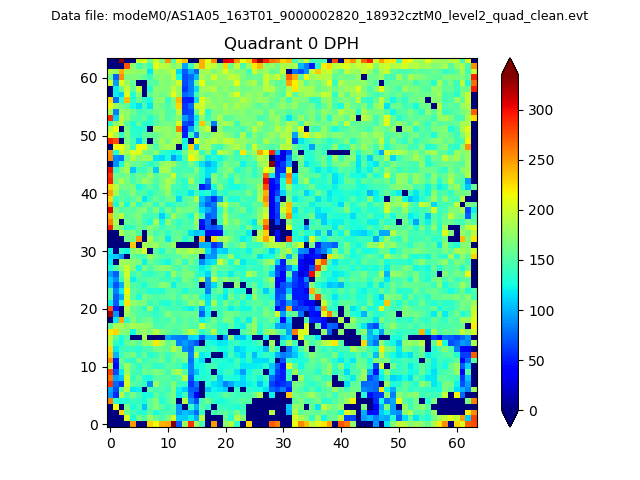 |
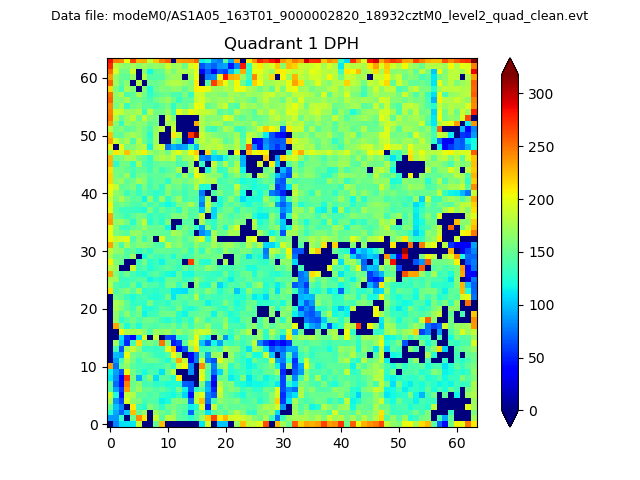 |
Quadrant B |
|---|---|---|---|
| Quadrant D | 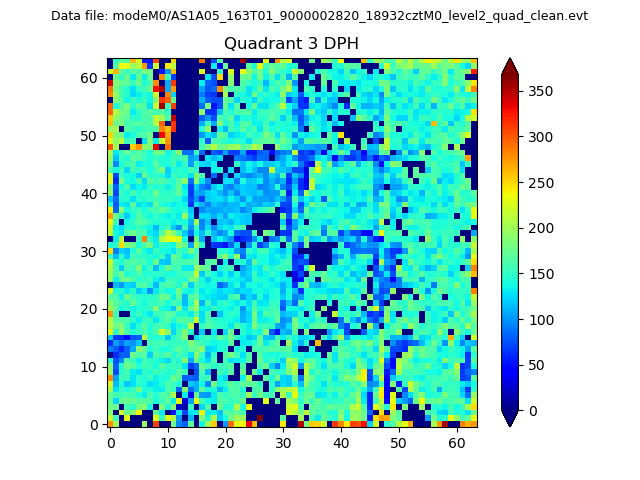 |
 |
Quadrant C |
| Plot type | Count rate plots | Images |
|---|---|---|
| Comparison with Poisson distribution Blue bars denote a histogram of data divided into 1 sec bins. Red curve is a Poisson curve with rate = median count rate of data. |
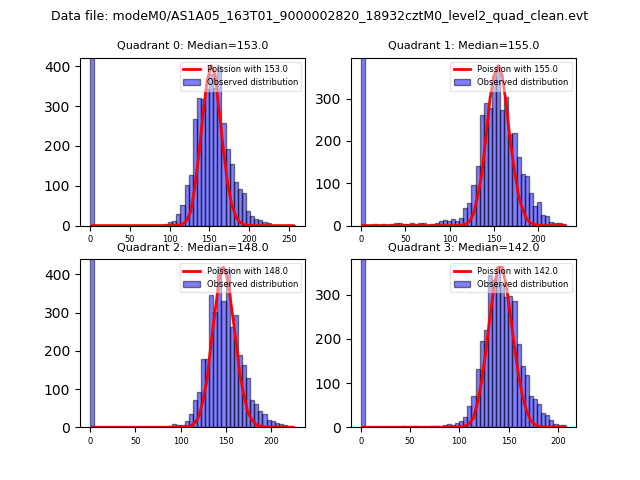 |
 |
| Quadrant-wise count rates Data is divided into 100 sec bins |
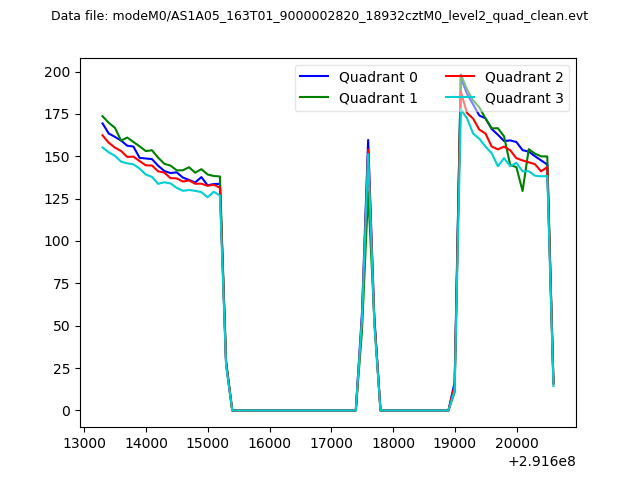 |
|
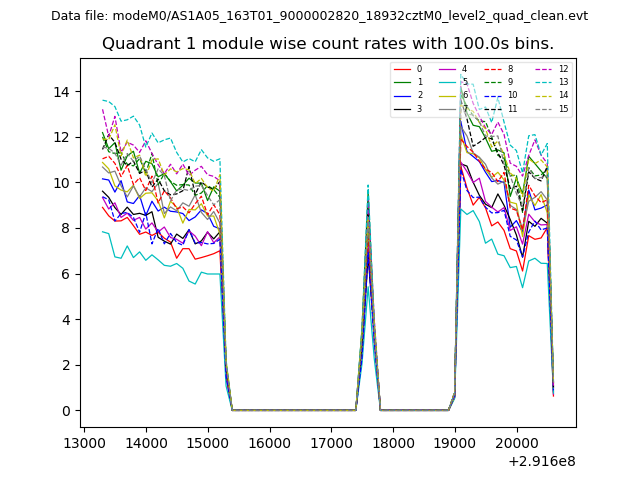
| Module-wise count rates for Quadrant A Data is divided into 100 sec bins |
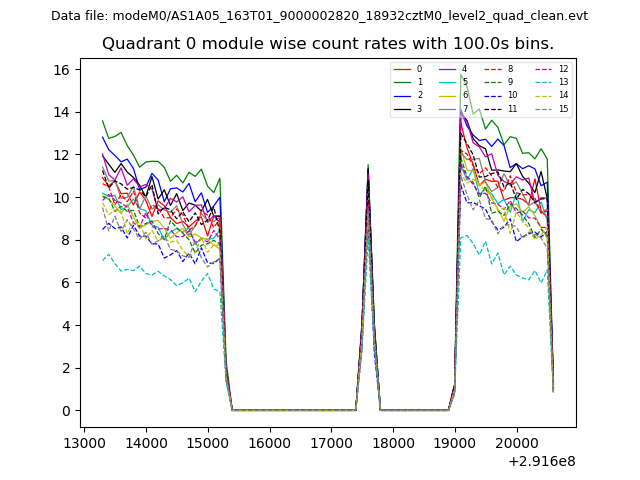 |
 |
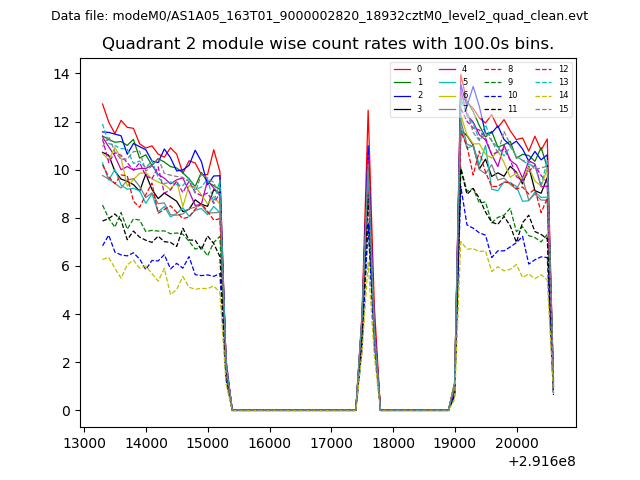
| Module-wise count rates for Quadrant B Data is divided into 100 sec bins |
 |
 |
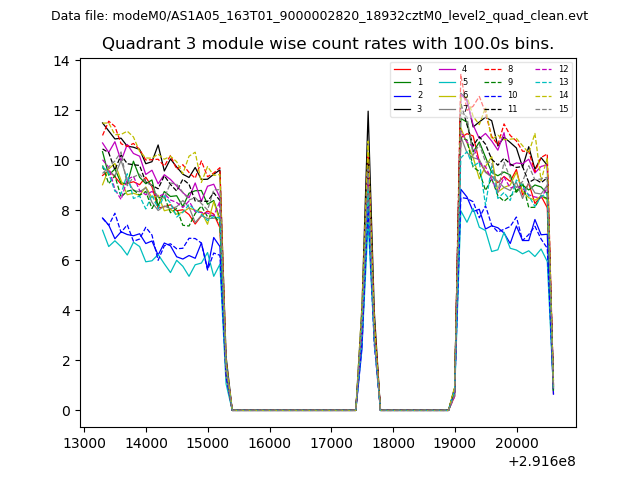
| Module-wise count rates for Quadrant C Data is divided into 100 sec bins |
 |
 |
| Module-wise count rates for Quadrant D Data is divided into 100 sec bins |
 |
 |
| Parameter | Plot |
|---|---|
| CZT HV Monitor | 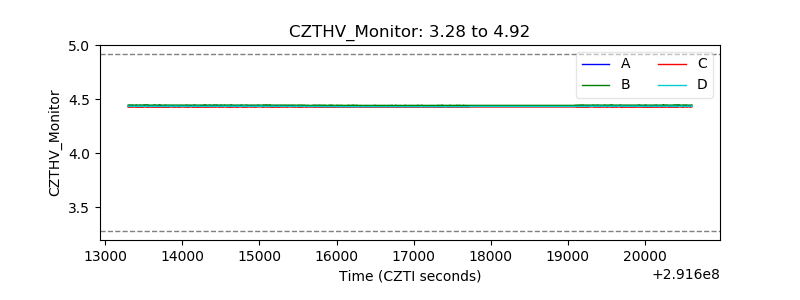 |
| D_VDD | 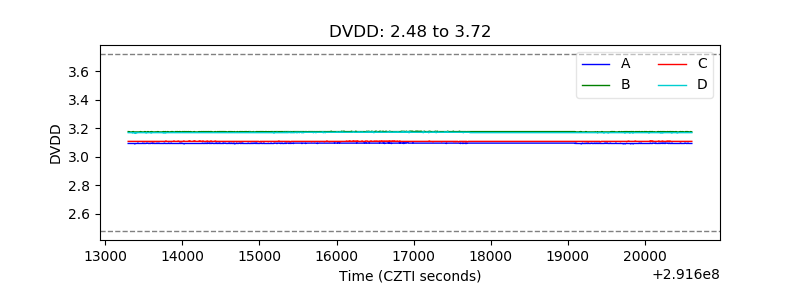 |
| Temperature 1 | 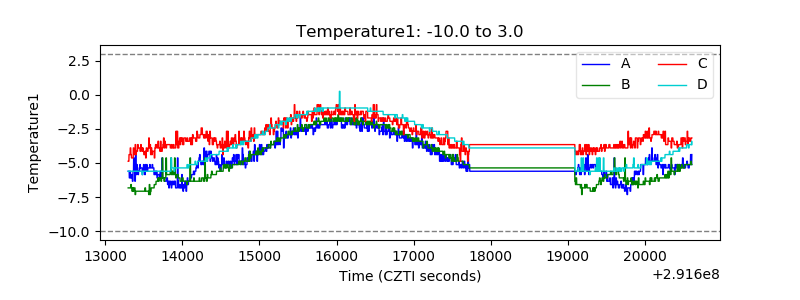 |
| Veto HV Monitor | 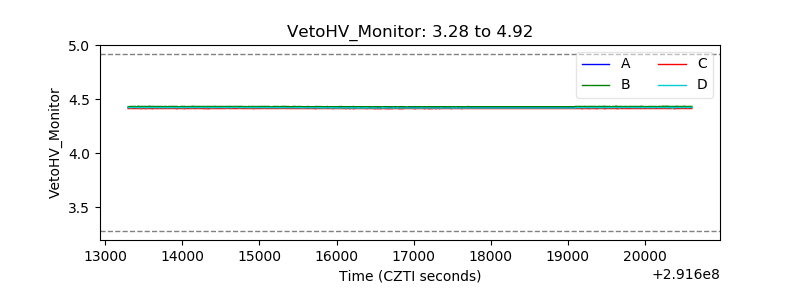 |
| Veto LLD | 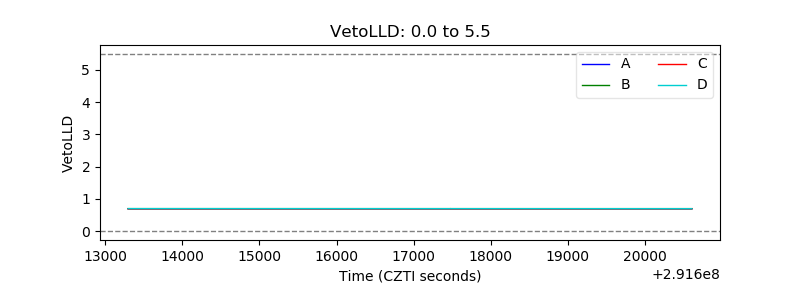 |
| Alpha Counter | 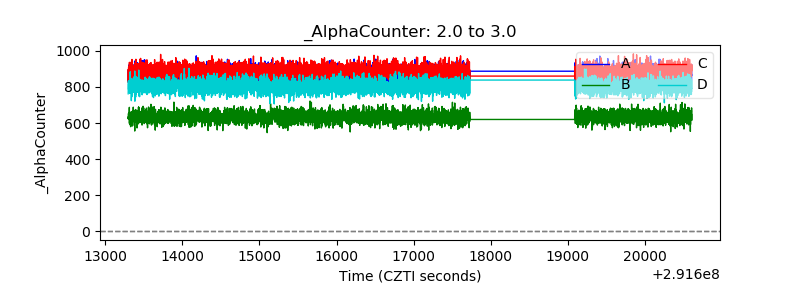 |
| _CPM_Rate | 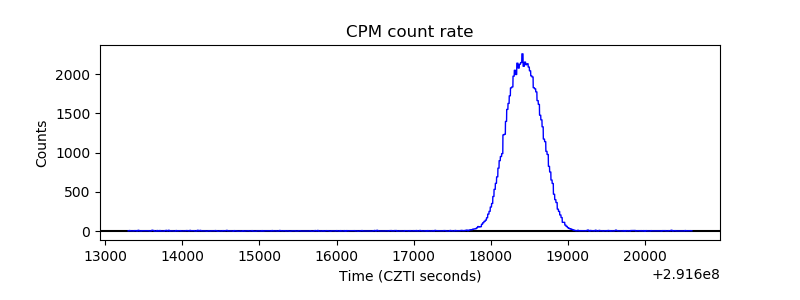 |
| CZT Counter | 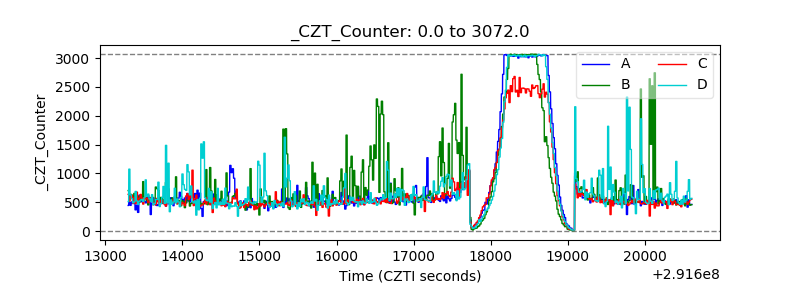 |
| +2.5 Volts monitor | 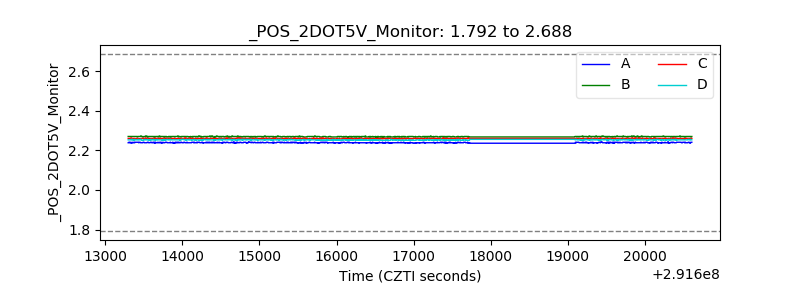 |
| +5 Volts monitor | 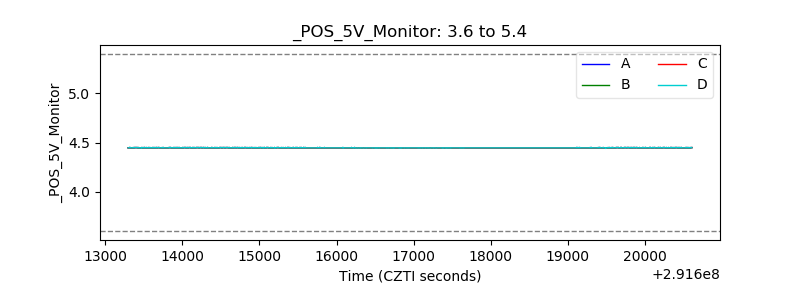 |
| _ROLL_ROT | 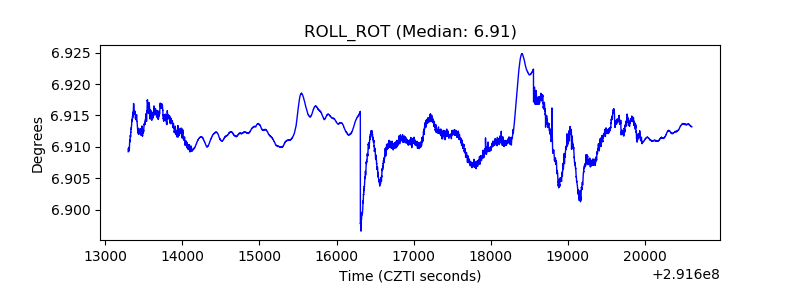 |
| _Roll_DEC | 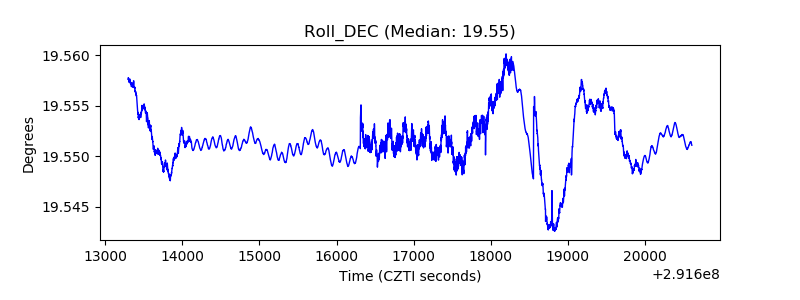 |
| _Roll_RA | 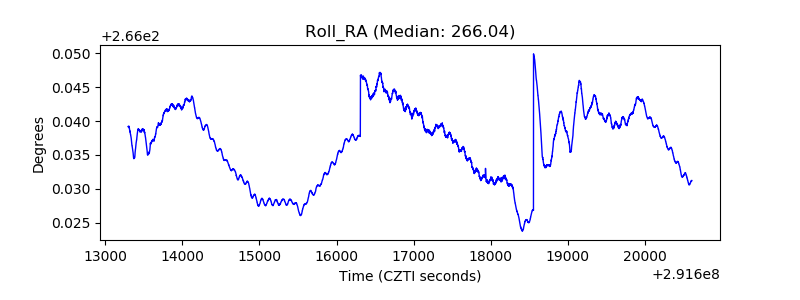 |
| Veto Counter | 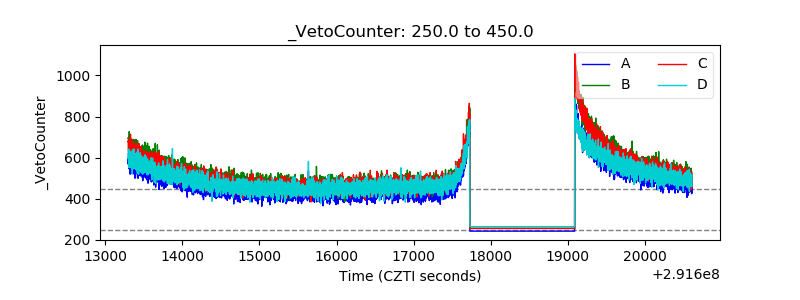 |