| Param | Original file | Final file |
|---|---|---|
| Filename | modeM0/AS1A05_163T01_9000002820_18933cztM0_level2.evt | modeM0/AS1A05_163T01_9000002820_18933cztM0_level2_quad_clean.evt |
| Size (bytes) | 571,334,400 | 99,694,080 |
| Size | 544.9 MB | 95.1 MB |
| Events in quadrant A | 3,641,084 | 660,528 |
| Events in quadrant B | 5,118,545 | 648,339 |
| Events in quadrant C | 3,362,511 | 638,429 |
| Events in quadrant D | 4,740,521 | 618,418 |
| Mode M0 | |||
|---|---|---|---|
| Quadrant | BADHDUFLAG | Total packets | Discarded packets |
| A | 0 | 14641 | 2 |
| B | 0 | 19330 | 2 |
| C | 0 | 13762 | 2 |
| D | 0 | 18276 | 2 |
| Mode SS | |||
|---|---|---|---|
| Quadrant | BADHDUFLAG | Total packets | Discarded packets |
| A | 0 | 134 | 0 |
| B | 0 | 134 | 0 |
| C | 0 | 134 | 0 |
| D | 0 | 134 | 0 |
| Mode M9 | |||
|---|---|---|---|
| Quadrant | BADHDUFLAG | Total packets | Discarded packets |
| A | 0 | 15 | 0 |
| B | 0 | 16 | 0 |
| C | 0 | 16 | 0 |
| D | 0 | 16 | 0 |
| Quadrant | Total seconds | Saturated seconds | Saturation percentage |
|---|---|---|---|
| A | 6493 | 83 | 1.278300% |
| B | 6492 | 569 | 8.764633% |
| C | 6492 | 102 | 1.571165% |
| D | 6492 | 317 | 4.882933% |
Noise dominated data is calculated using 1-second bins in cleaned event files. If a bin has >2000 counts, and if more than 50% of those come from <1% of pixels, then it is considered to be noise-dominated and hence unusable.
| Quadrant | # 1 sec bins | Bins with >0 counts | Bins with >2000 counts | High rate bins dominated by noise | Noise dominated (total time) | Noise dominated (detector-on time) | Marked lightcurve |
|---|---|---|---|---|---|---|---|
| A | 7808 | 6494 | 2 | 2 | 0.03% | 0.03% | 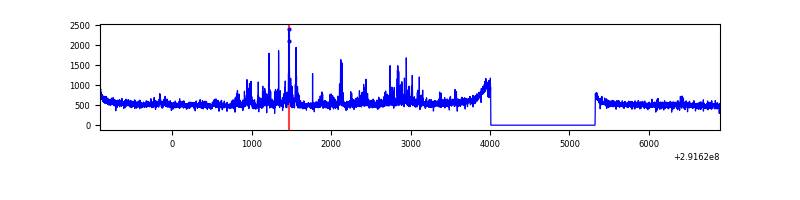 |
| B | 7807 | 6493 | 314 | 314 | 4.02% | 4.84% | 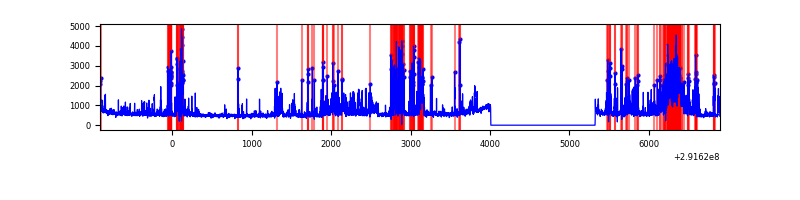 |
| C | 7807 | 6493 | 0 | 0 | 0.00% | 0.00% | 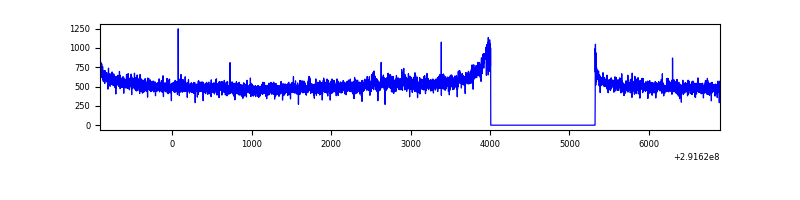 |
| D | 7807 | 6493 | 228 | 228 | 2.92% | 3.51% | 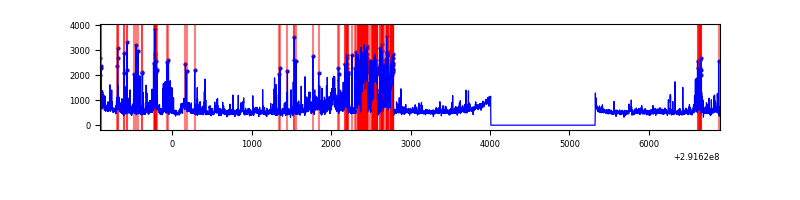 |
Top three noisy pixels from each quadrant. If the there are fewer than three noisy pixels in the level2.evt file, extra rows are filled as -1
| Pixel properties | Quadrant properties | ||||||
|---|---|---|---|---|---|---|---|
| Quadrant | DetID | PixID | Counts | Sigma | Mean | Median | Sigma |
| A | 14 | 235 | 307036 | 1770.38 | 864 | 848 | 173.0 |
| A | 13 | 254 | 9730 | 51.36 | 864 | 848 | 173.0 |
| A | 0 | 226 | 7720 | 39.73 | 864 | 848 | 173.0 |
| B | 3 | 112 | 1616701 | 10327.72 | 834 | 816 | 156.5 |
| B | 7 | 220 | 89566 | 567.23 | 834 | 816 | 156.5 |
| B | 4 | 216 | 54354 | 342.18 | 834 | 816 | 156.5 |
| C | 14 | 238 | 130199 | 686.28 | 815 | 822 | 188.5 |
| C | 3 | 233 | 52040 | 271.69 | 815 | 822 | 188.5 |
| C | 13 | 61 | 5863 | 26.74 | 815 | 822 | 188.5 |
| D | 7 | 238 | 706197 | 3568.48 | 820 | 799 | 197.7 |
| D | 1 | 52 | 680194 | 3436.94 | 820 | 799 | 197.7 |
| D | 14 | 34 | 68439 | 342.18 | 820 | 799 | 197.7 |
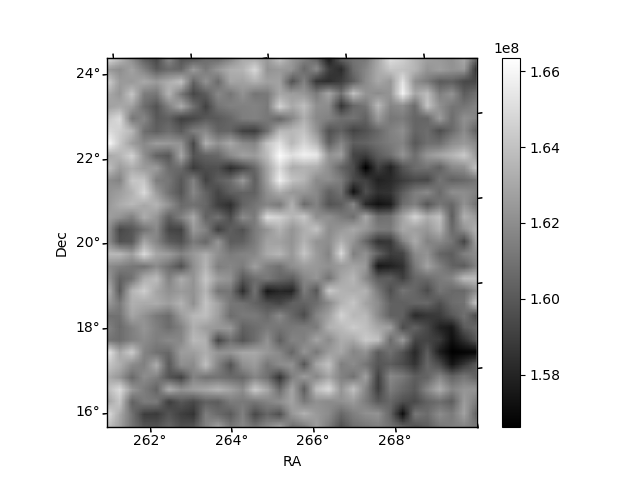
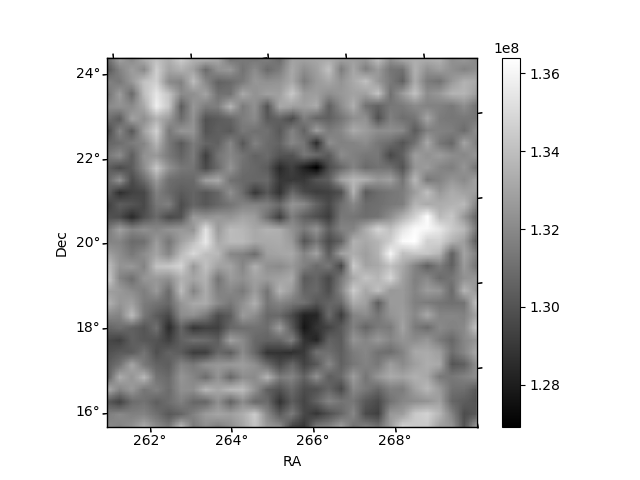
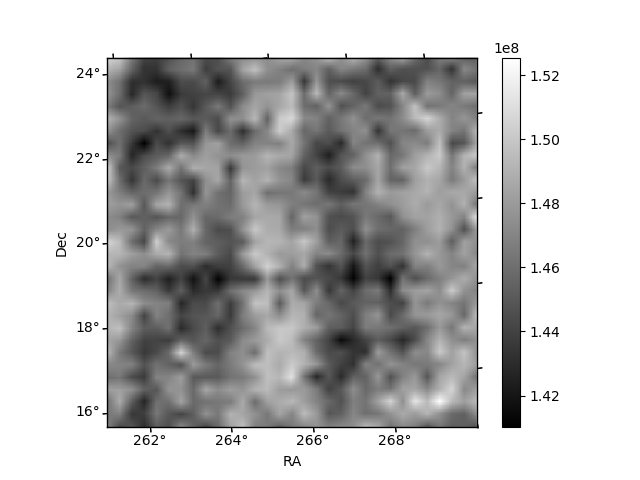
Histogram calculated using DETX and DETY for each event in the final _common_clean file
| Quadrant A |  |
 |
Quadrant B |
|---|---|---|---|
| Quadrant D | 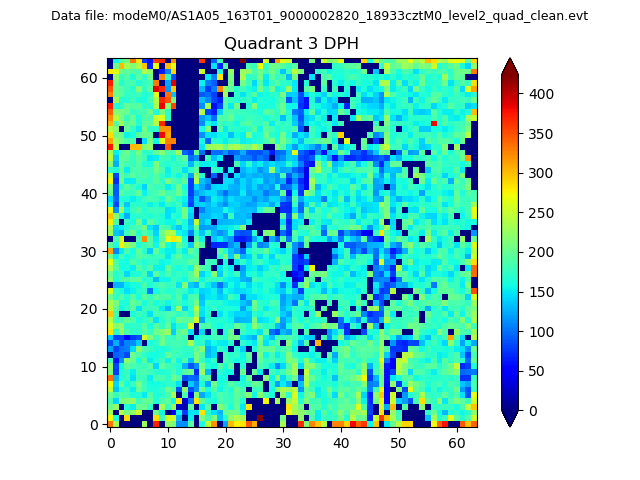 |
 |
Quadrant C |
| Plot type | Count rate plots | Images |
|---|---|---|
| Comparison with Poisson distribution Blue bars denote a histogram of data divided into 1 sec bins. Red curve is a Poisson curve with rate = median count rate of data. |
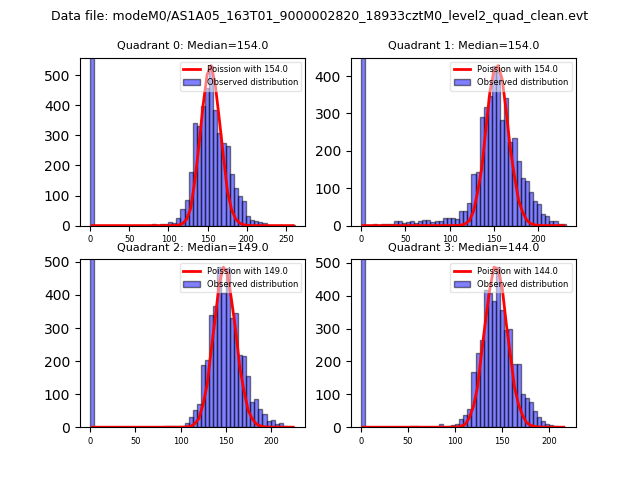 |
 |
| Quadrant-wise count rates Data is divided into 100 sec bins |
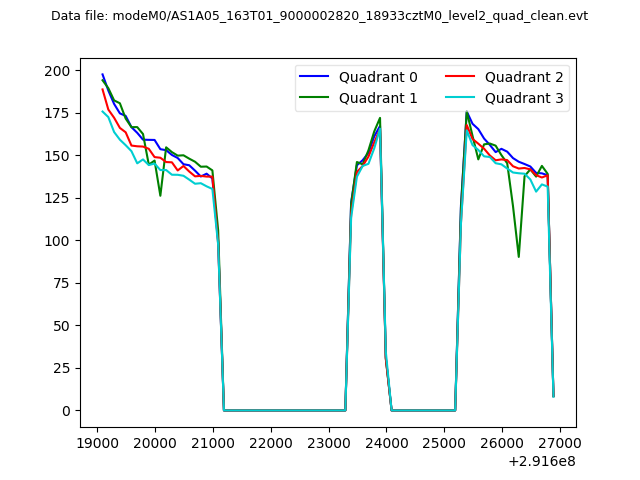 |
|
| Module-wise count rates for Quadrant A Data is divided into 100 sec bins |
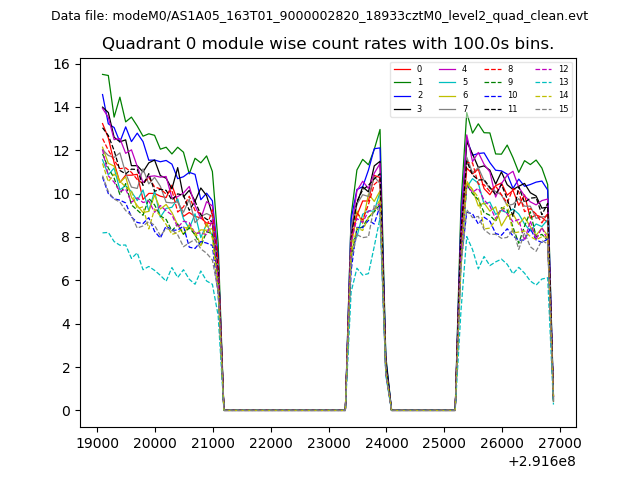 |
 |
| Module-wise count rates for Quadrant B Data is divided into 100 sec bins |
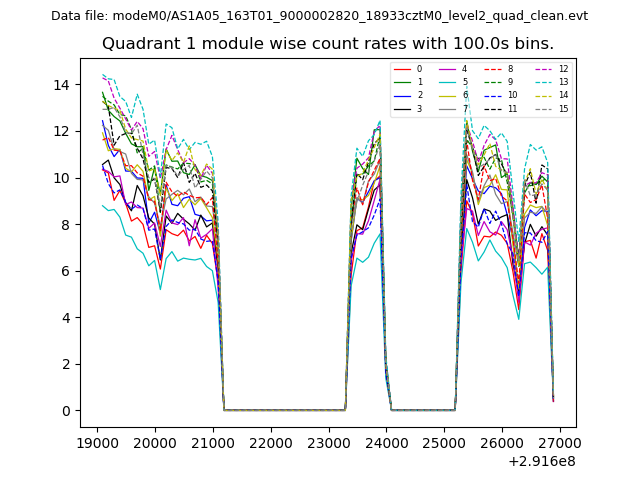 |
 |
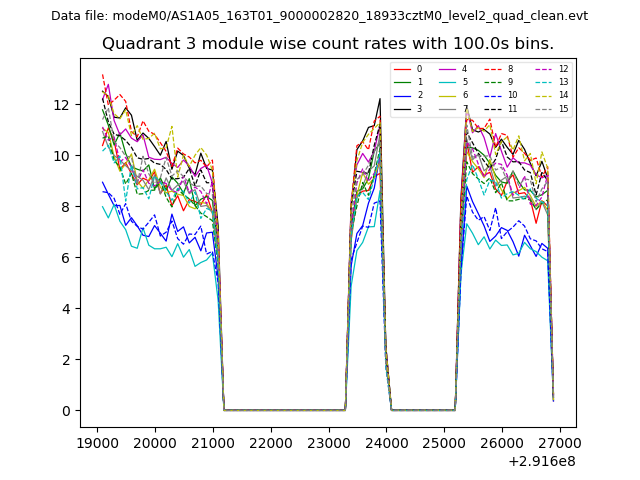
| Module-wise count rates for Quadrant C Data is divided into 100 sec bins |
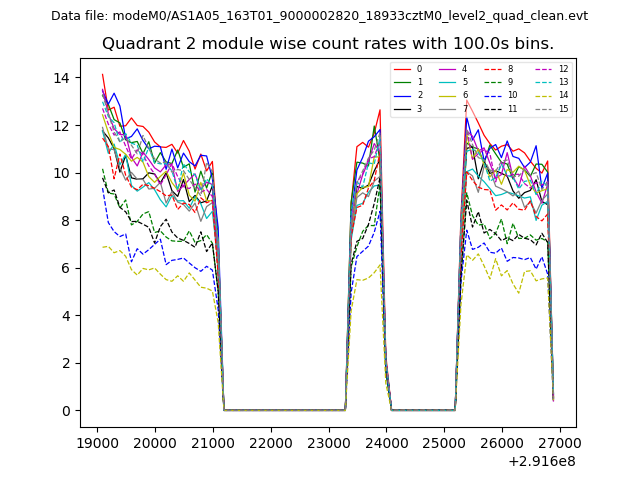 |
 |
| Module-wise count rates for Quadrant D Data is divided into 100 sec bins |
 |
 |
| Parameter | Plot |
|---|---|
| CZT HV Monitor | 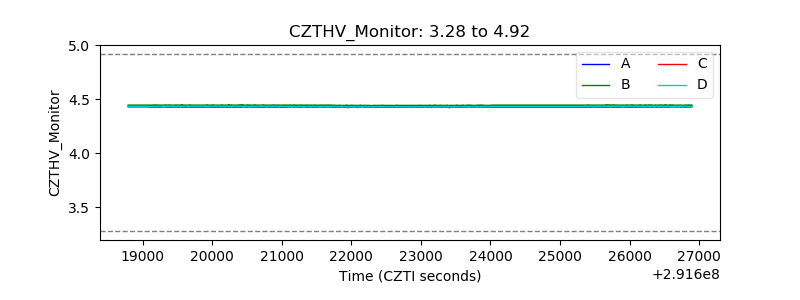 |
| D_VDD | 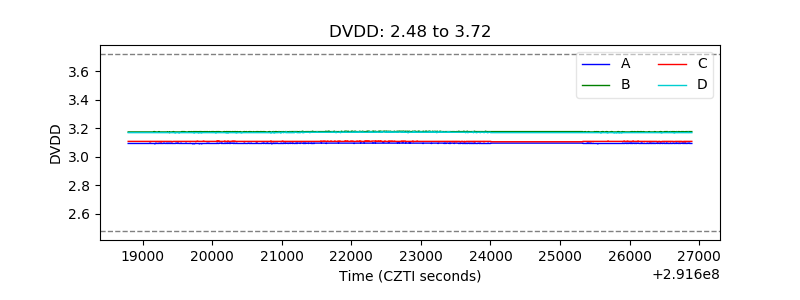 |
| Temperature 1 | 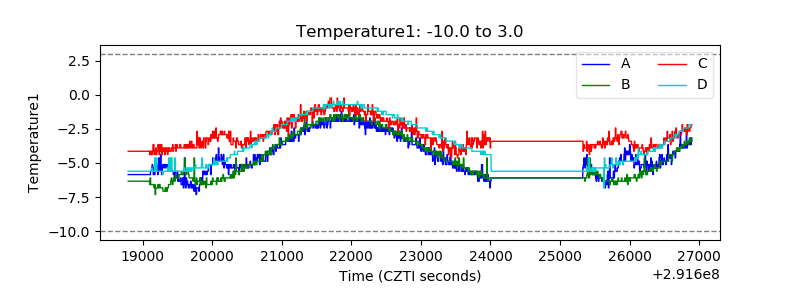 |
| Veto HV Monitor | 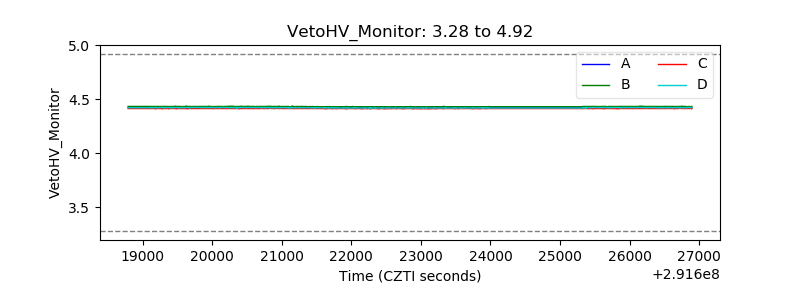 |
| Veto LLD | 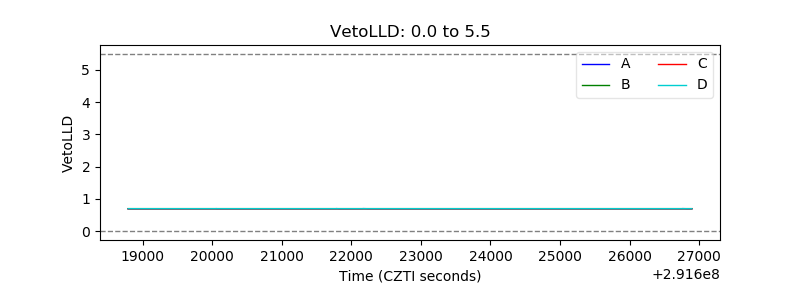 |
| Alpha Counter | 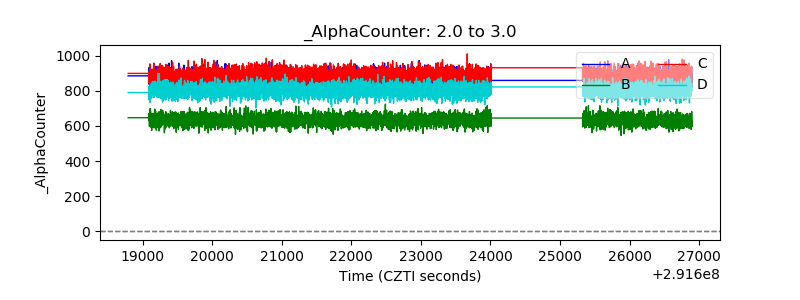 |
| _CPM_Rate | 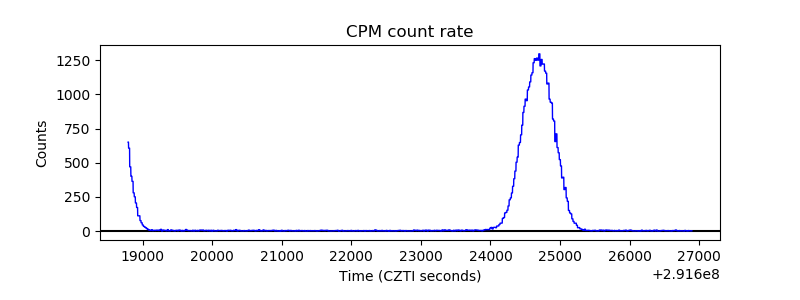 |
| CZT Counter | 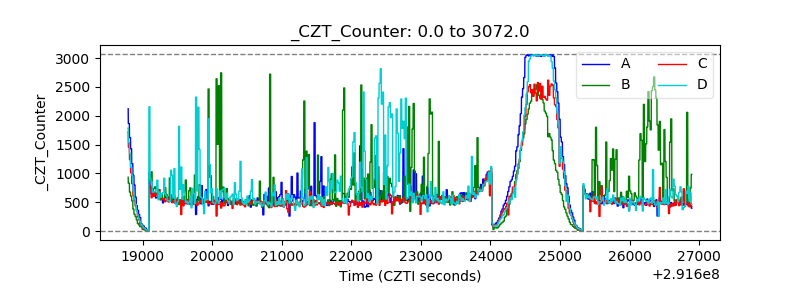 |
| +2.5 Volts monitor |  |
| +5 Volts monitor |  |
| _ROLL_ROT | 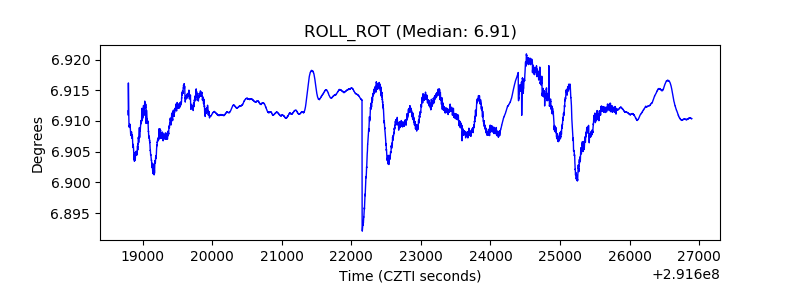 |
| _Roll_DEC | 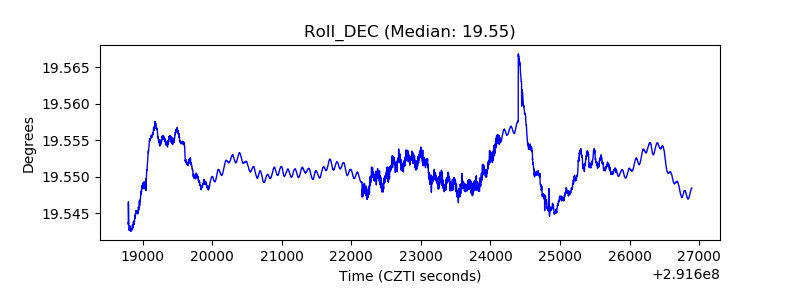 |
| _Roll_RA | 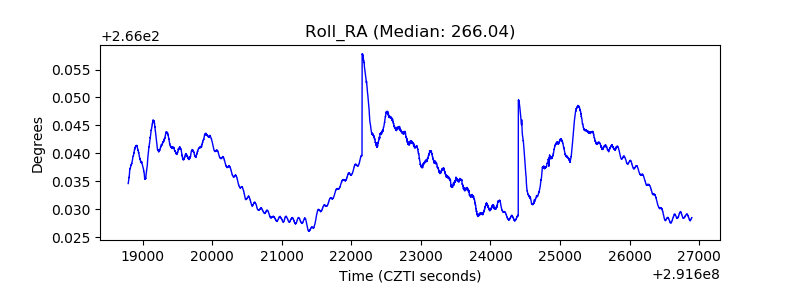 |
| Veto Counter | 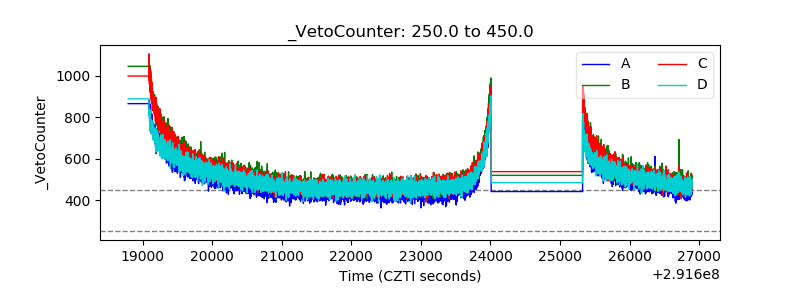 |