| Param | Original file | Final file |
|---|---|---|
| Filename | modeM0/AS1A05_163T01_9000002820_18934cztM0_level2.evt | modeM0/AS1A05_163T01_9000002820_18934cztM0_level2_quad_clean.evt |
| Size (bytes) | 554,808,960 | 81,383,040 |
| Size | 529.1 MB | 77.6 MB |
| Events in quadrant A | 3,823,952 | 521,736 |
| Events in quadrant B | 4,528,958 | 517,986 |
| Events in quadrant C | 2,989,774 | 515,622 |
| Events in quadrant D | 5,054,837 | 491,389 |
| Mode M0 | |||
|---|---|---|---|
| Quadrant | BADHDUFLAG | Total packets | Discarded packets |
| A | 0 | 15041 | 1 |
| B | 0 | 17354 | 2 |
| C | 0 | 12413 | 1 |
| D | 0 | 18822 | 1 |
| Mode SS | |||
|---|---|---|---|
| Quadrant | BADHDUFLAG | Total packets | Discarded packets |
| A | 0 | 122 | 0 |
| B | 0 | 122 | 0 |
| C | 0 | 122 | 0 |
| D | 0 | 122 | 0 |
| Mode M9 | |||
|---|---|---|---|
| Quadrant | BADHDUFLAG | Total packets | Discarded packets |
| A | 0 | 11 | 0 |
| B | 0 | 11 | 0 |
| C | 0 | 11 | 0 |
| D | 0 | 11 | 0 |
| Quadrant | Total seconds | Saturated seconds | Saturation percentage |
|---|---|---|---|
| A | 5968 | 148 | 2.479893% |
| B | 5968 | 378 | 6.333780% |
| C | 5968 | 93 | 1.558311% |
| D | 5968 | 634 | 10.623324% |
Noise dominated data is calculated using 1-second bins in cleaned event files. If a bin has >2000 counts, and if more than 50% of those come from <1% of pixels, then it is considered to be noise-dominated and hence unusable.
| Quadrant | # 1 sec bins | Bins with >0 counts | Bins with >2000 counts | High rate bins dominated by noise | Noise dominated (total time) | Noise dominated (detector-on time) | Marked lightcurve |
|---|---|---|---|---|---|---|---|
| A | 7138 | 5969 | 24 | 24 | 0.34% | 0.40% | 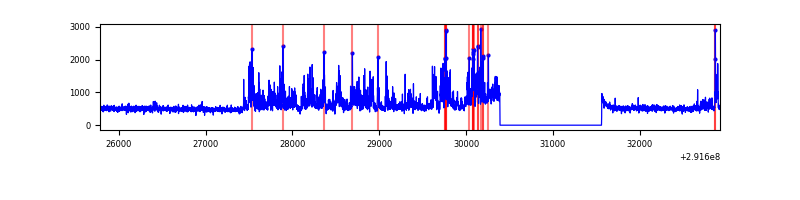 |
| B | 7138 | 5969 | 211 | 211 | 2.96% | 3.53% | 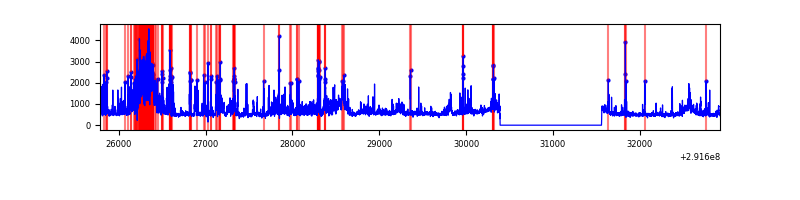 |
| C | 7138 | 5969 | 0 | 0 | 0.00% | 0.00% |  |
| D | 7138 | 5969 | 486 | 486 | 6.81% | 8.14% | 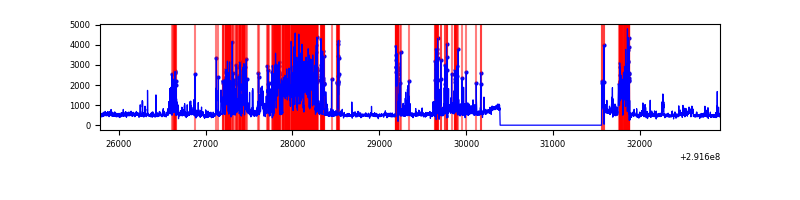 |
Top three noisy pixels from each quadrant. If the there are fewer than three noisy pixels in the level2.evt file, extra rows are filled as -1
| Pixel properties | Quadrant properties | ||||||
|---|---|---|---|---|---|---|---|
| Quadrant | DetID | PixID | Counts | Sigma | Mean | Median | Sigma |
| A | 14 | 235 | 834090 | 5344.61 | 770 | 755 | 155.9 |
| A | 6 | 16 | 10932 | 65.27 | 770 | 755 | 155.9 |
| A | 15 | 174 | 10452 | 62.19 | 770 | 755 | 155.9 |
| B | 3 | 112 | 1267922 | 8893.49 | 750 | 733 | 142.5 |
| B | 7 | 220 | 144187 | 1006.8 | 750 | 733 | 142.5 |
| B | 0 | 189 | 81731 | 568.47 | 750 | 733 | 142.5 |
| C | 14 | 238 | 114416 | 667.56 | 731 | 736 | 170.3 |
| C | 3 | 233 | 17922 | 100.92 | 731 | 736 | 170.3 |
| C | 13 | 61 | 5175 | 26.07 | 731 | 736 | 170.3 |
| D | 7 | 238 | 1508452 | 8552.48 | 721 | 700 | 176.3 |
| D | 1 | 52 | 482616 | 2733.59 | 721 | 700 | 176.3 |
| D | 9 | 1 | 217253 | 1228.36 | 721 | 700 | 176.3 |
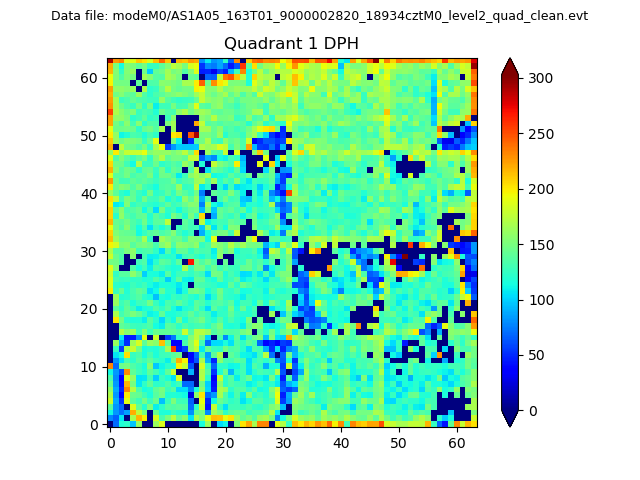
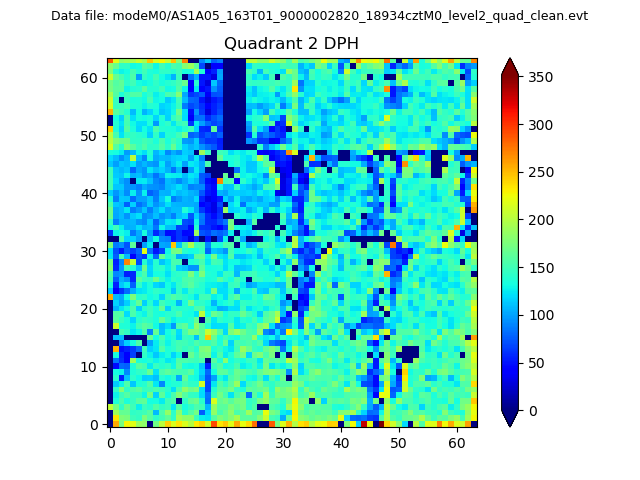
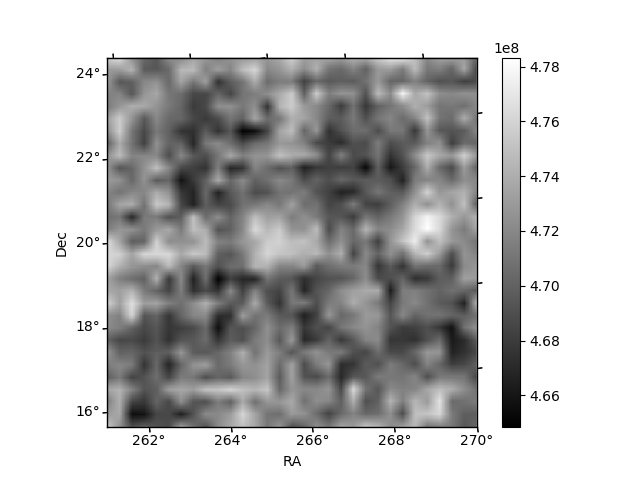
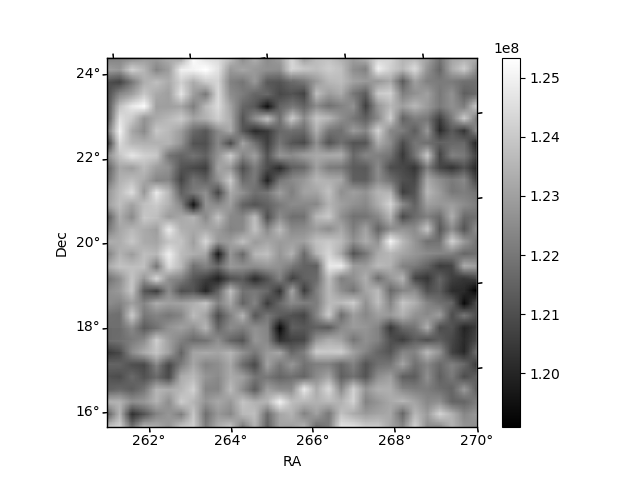
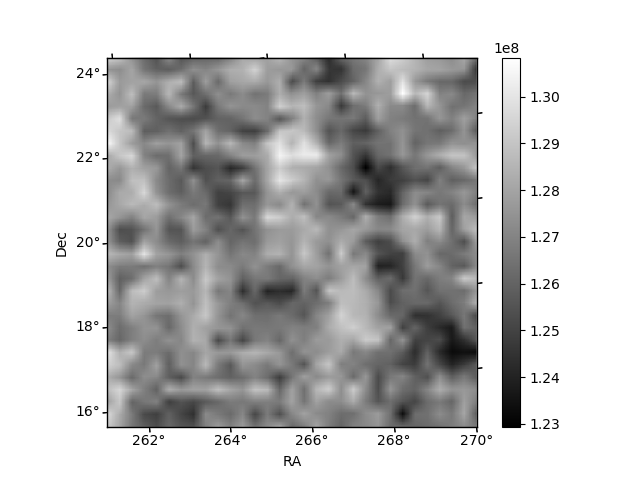
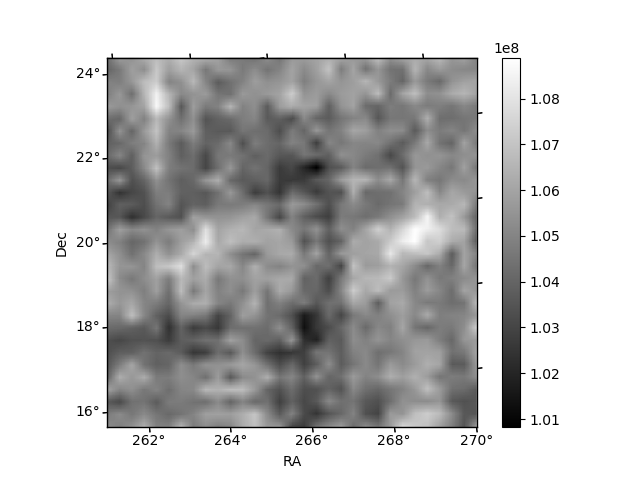
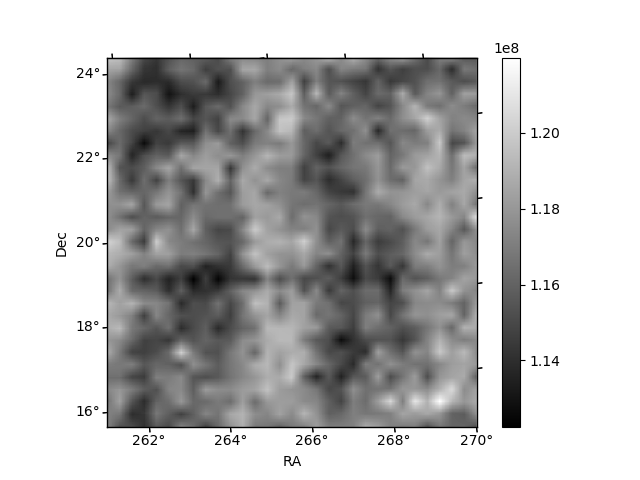
Histogram calculated using DETX and DETY for each event in the final _common_clean file
| Quadrant A | 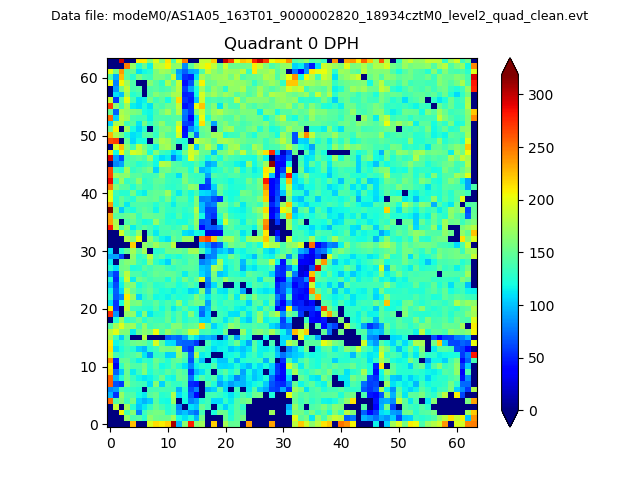 |
 |
Quadrant B |
|---|---|---|---|
| Quadrant D | 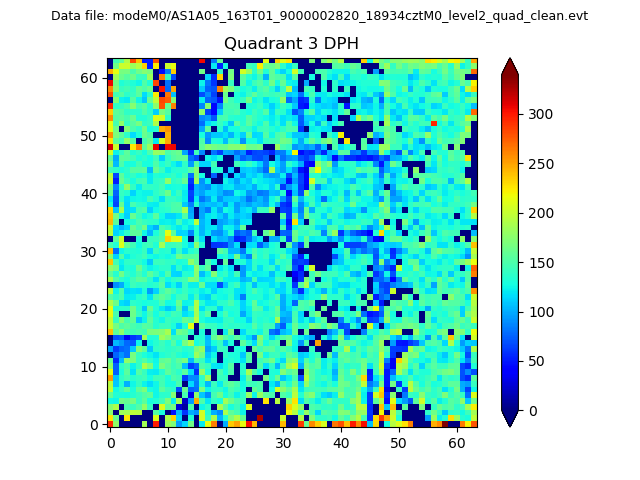 |
 |
Quadrant C |
| Plot type | Count rate plots | Images |
|---|---|---|
| Comparison with Poisson distribution Blue bars denote a histogram of data divided into 1 sec bins. Red curve is a Poisson curve with rate = median count rate of data. |
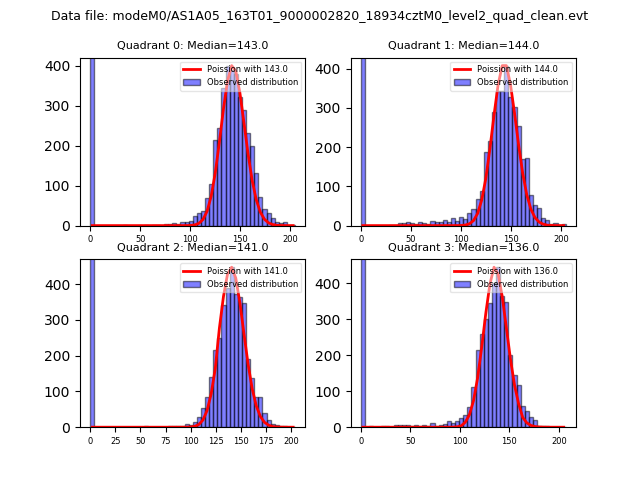 |
 |
| Quadrant-wise count rates Data is divided into 100 sec bins |
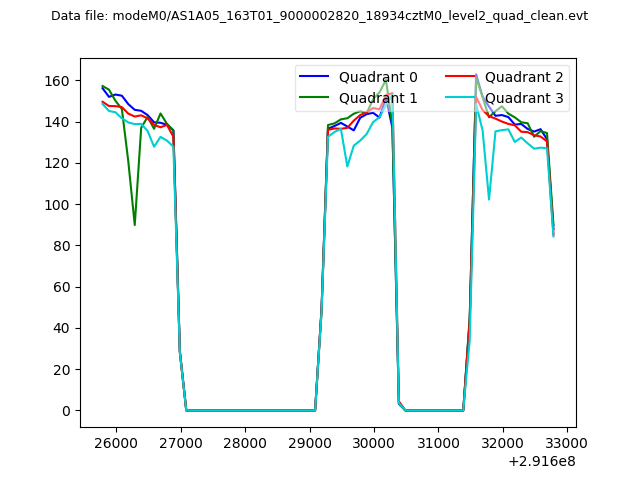 |
|
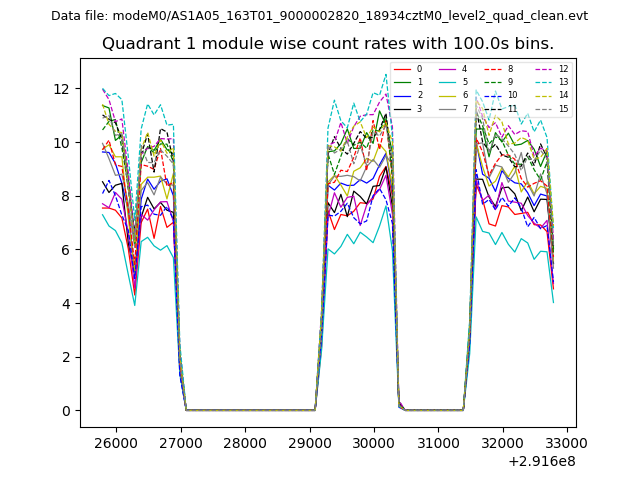
| Module-wise count rates for Quadrant A Data is divided into 100 sec bins |
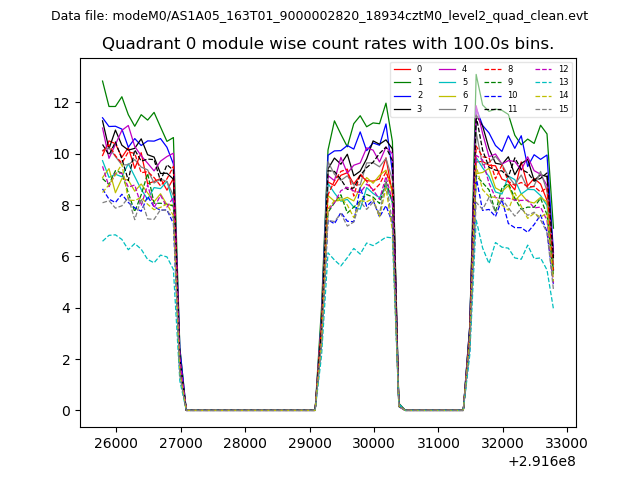 |
 |
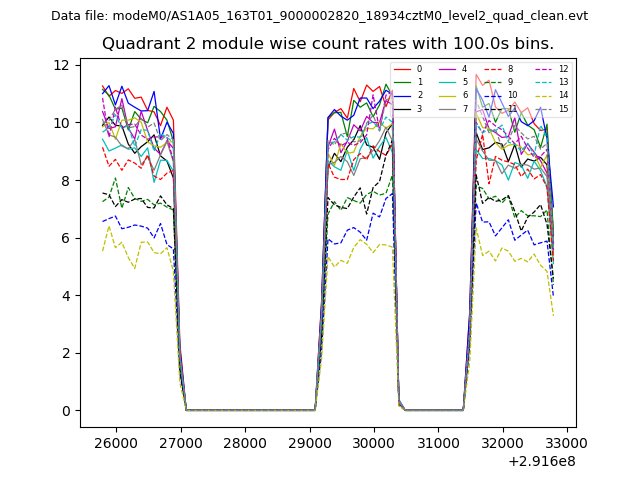
| Module-wise count rates for Quadrant B Data is divided into 100 sec bins |
 |
 |
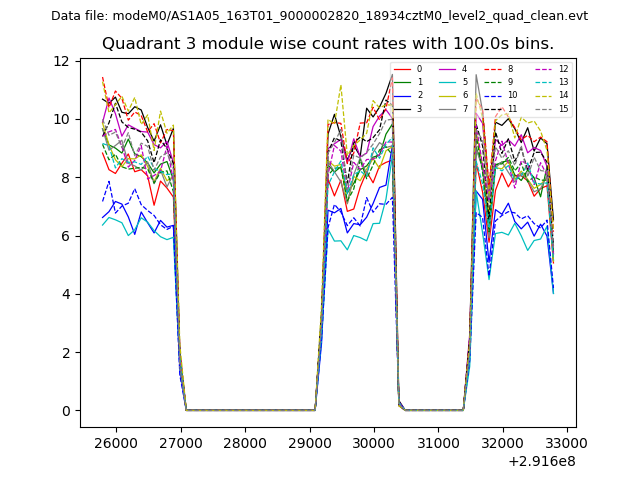
| Module-wise count rates for Quadrant C Data is divided into 100 sec bins |
 |
 |
| Module-wise count rates for Quadrant D Data is divided into 100 sec bins |
 |
 |
| Parameter | Plot |
|---|---|
| CZT HV Monitor | 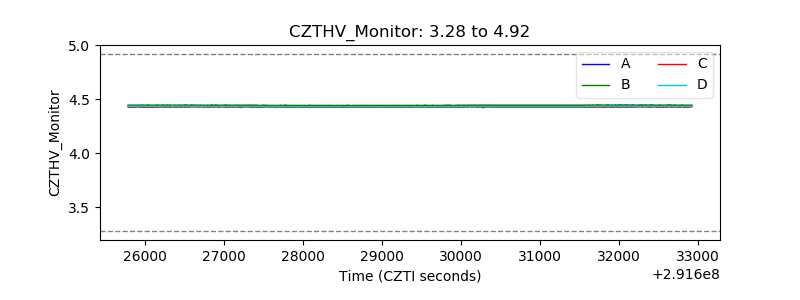 |
| D_VDD | 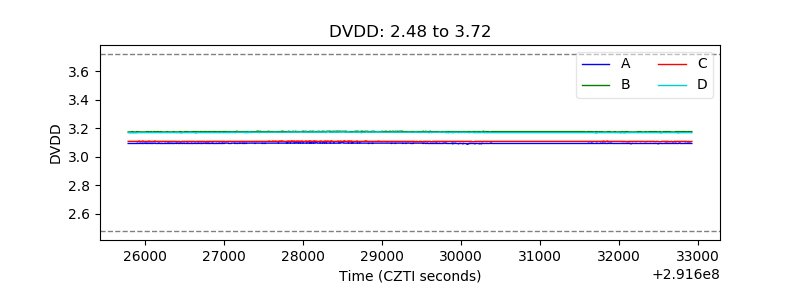 |
| Temperature 1 | 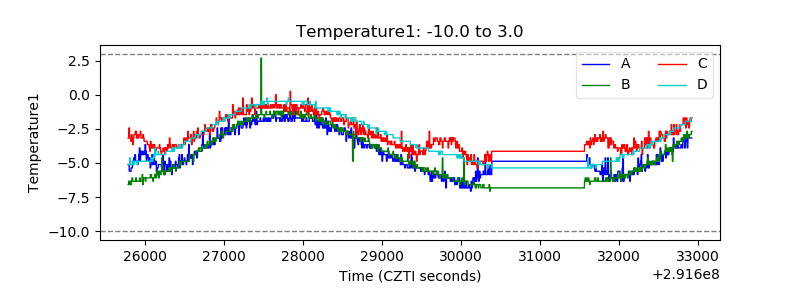 |
| Veto HV Monitor | 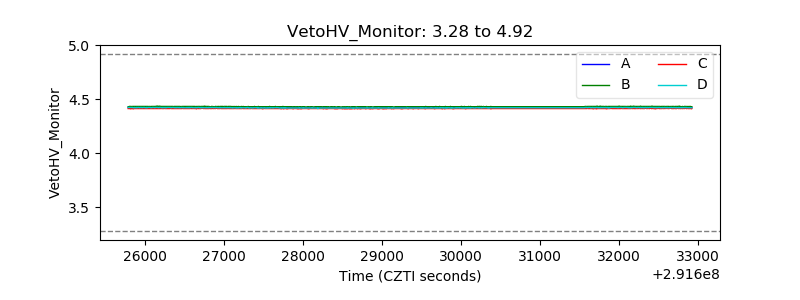 |
| Veto LLD | 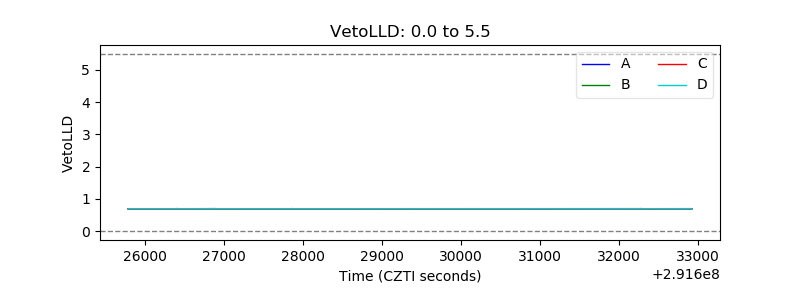 |
| Alpha Counter | 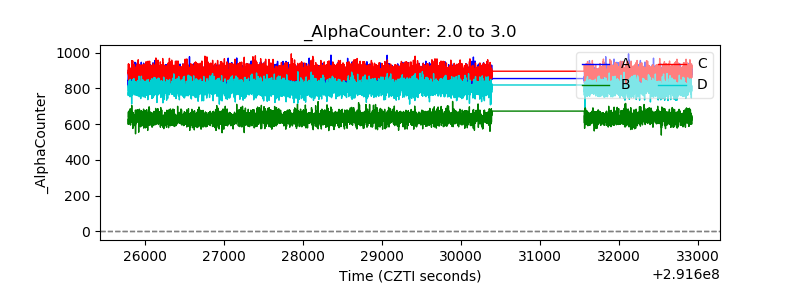 |
| _CPM_Rate | 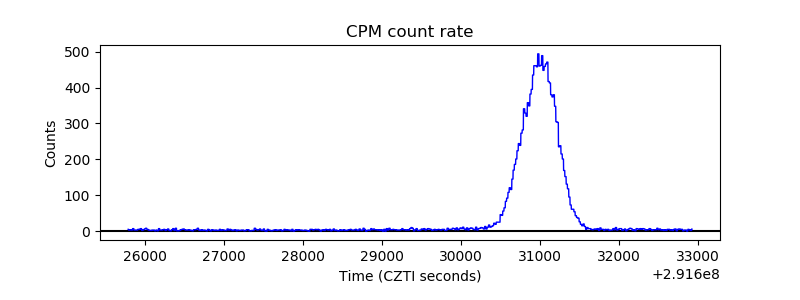 |
| CZT Counter | 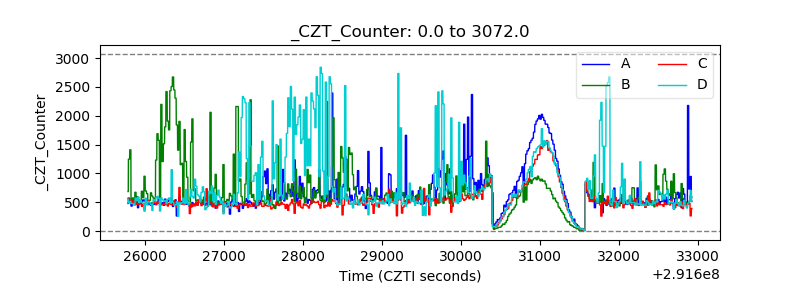 |
| +2.5 Volts monitor | 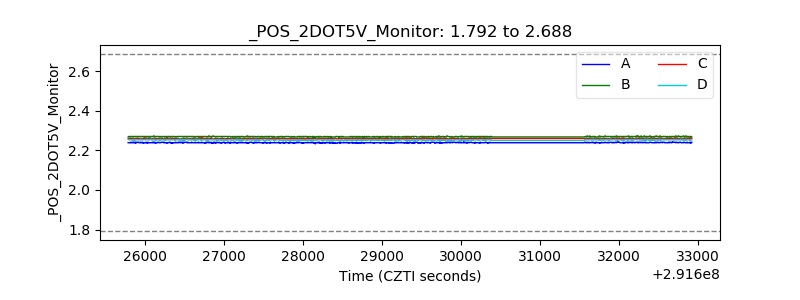 |
| +5 Volts monitor | 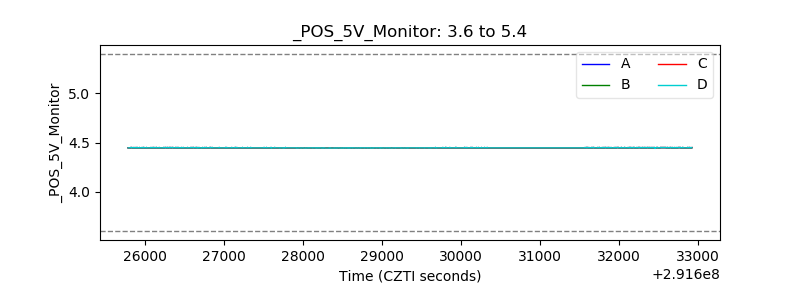 |
| _ROLL_ROT | 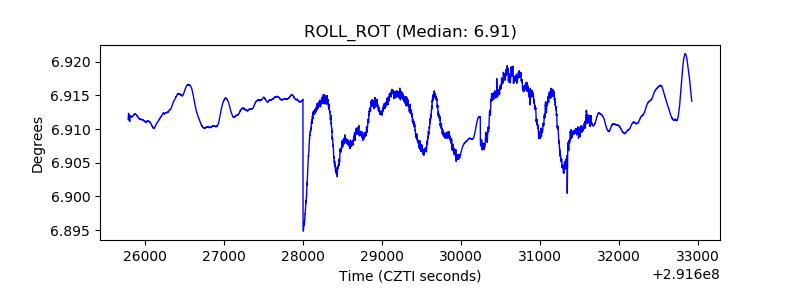 |
| _Roll_DEC | 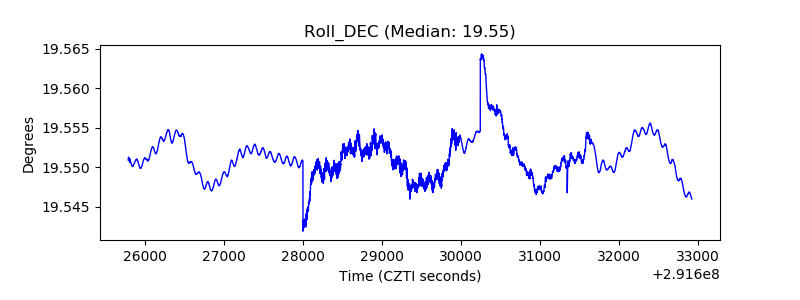 |
| _Roll_RA | 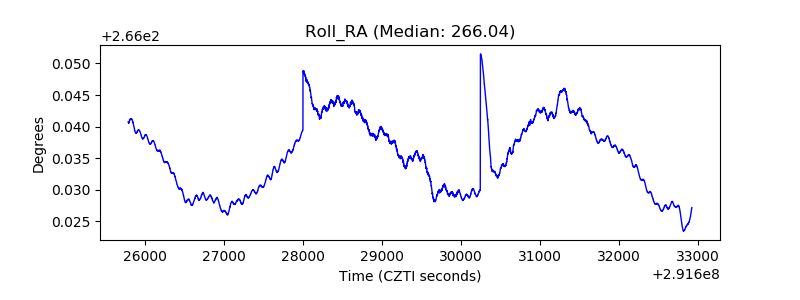 |
| Veto Counter | 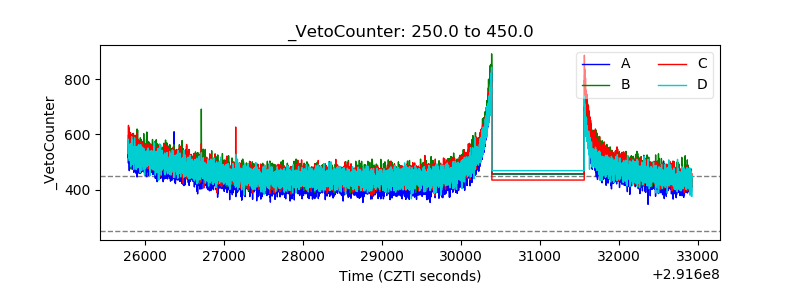 |