| Param | Original file | Final file |
|---|---|---|
| Filename | modeM0/AS1T03_090T01_9000002822_18941cztM0_level2.evt | modeM0/AS1T03_090T01_9000002822_18941cztM0_level2_quad_clean.evt |
| Size (bytes) | 908,156,160 | 114,649,920 |
| Size | 866.1 MB | 109.3 MB |
| Events in quadrant A | 11,074,497 | 669,927 |
| Events in quadrant B | 4,837,032 | 797,091 |
| Events in quadrant C | 3,677,234 | 772,848 |
| Events in quadrant D | 7,395,159 | 695,451 |
| Mode SS | |||
|---|---|---|---|
| Quadrant | BADHDUFLAG | Total packets | Discarded packets |
| A | 0 | 158 | 0 |
| B | 0 | 158 | 0 |
| C | 0 | 158 | 0 |
| D | 0 | 158 | 0 |
| Mode M9 | |||
|---|---|---|---|
| Quadrant | BADHDUFLAG | Total packets | Discarded packets |
| A | 0 | 15 | 0 |
| B | 0 | 15 | 0 |
| C | 0 | 15 | 0 |
| D | 0 | 15 | 0 |
| Mode M0 | |||
|---|---|---|---|
| Quadrant | BADHDUFLAG | Total packets | Discarded packets |
| A | 0 | 38152 | 2 |
| B | 0 | 19501 | 2 |
| C | 0 | 15918 | 2 |
| D | 0 | 27245 | 2 |
| Quadrant | Total seconds | Saturated seconds | Saturation percentage |
|---|---|---|---|
| A | 7701 | 2756 | 35.787560% |
| B | 7700 | 342 | 4.441558% |
| C | 7701 | 66 | 0.857032% |
| D | 7701 | 1117 | 14.504610% |
Noise dominated data is calculated using 1-second bins in cleaned event files. If a bin has >2000 counts, and if more than 50% of those come from <1% of pixels, then it is considered to be noise-dominated and hence unusable.
| Quadrant | # 1 sec bins | Bins with >0 counts | Bins with >2000 counts | High rate bins dominated by noise | Noise dominated (total time) | Noise dominated (detector-on time) | Marked lightcurve |
|---|---|---|---|---|---|---|---|
| A | 9216 | 7703 | 2051 | 2051 | 22.25% | 26.63% | 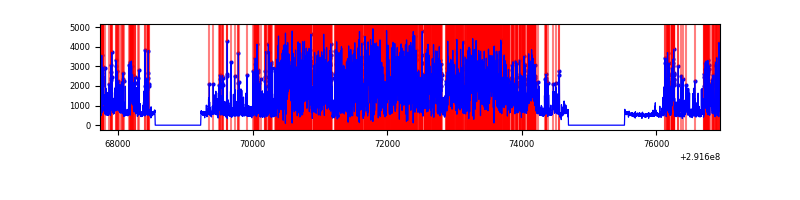 |
| B | 9215 | 7702 | 221 | 221 | 2.40% | 2.87% | 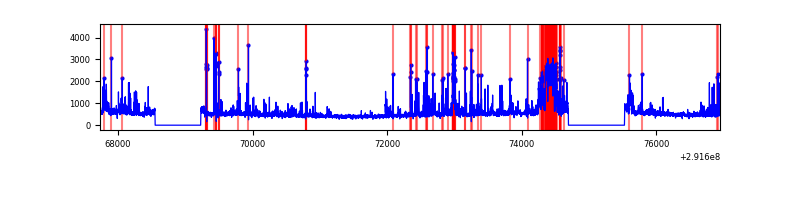 |
| C | 9216 | 7703 | 7 | 7 | 0.08% | 0.09% | 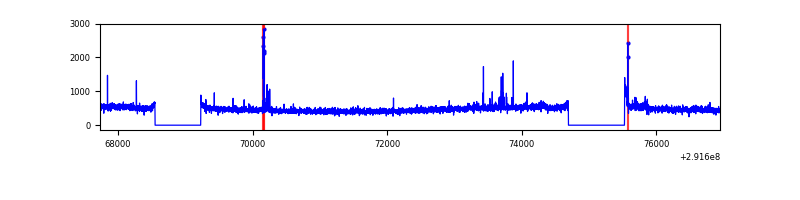 |
| D | 9216 | 7702 | 947 | 947 | 10.28% | 12.30% |  |
Top three noisy pixels from each quadrant. If the there are fewer than three noisy pixels in the level2.evt file, extra rows are filled as -1
| Pixel properties | Quadrant properties | ||||||
|---|---|---|---|---|---|---|---|
| Quadrant | DetID | PixID | Counts | Sigma | Mean | Median | Sigma |
| A | 14 | 235 | 7998018 | 50816.8 | 770 | 750 | 157.4 |
| A | 6 | 16 | 85900 | 541.06 | 770 | 750 | 157.4 |
| A | 0 | 13 | 13210 | 79.17 | 770 | 750 | 157.4 |
| B | 3 | 112 | 1037370 | 6020.61 | 897 | 874 | 172.2 |
| B | 0 | 189 | 98887 | 569.32 | 897 | 874 | 172.2 |
| B | 7 | 220 | 70308 | 403.32 | 897 | 874 | 172.2 |
| C | 14 | 238 | 135807 | 666.15 | 864 | 869 | 202.6 |
| C | 3 | 233 | 91033 | 445.11 | 864 | 869 | 202.6 |
| C | 0 | 207 | 64419 | 313.73 | 864 | 869 | 202.6 |
| D | 7 | 238 | 3243097 | 15908.46 | 822 | 795 | 203.8 |
| D | 12 | 218 | 736771 | 3611.09 | 822 | 795 | 203.8 |
| D | 12 | 233 | 133228 | 649.79 | 822 | 795 | 203.8 |
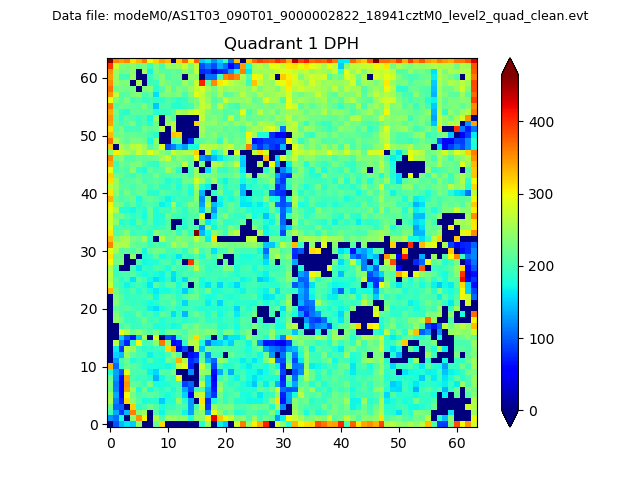
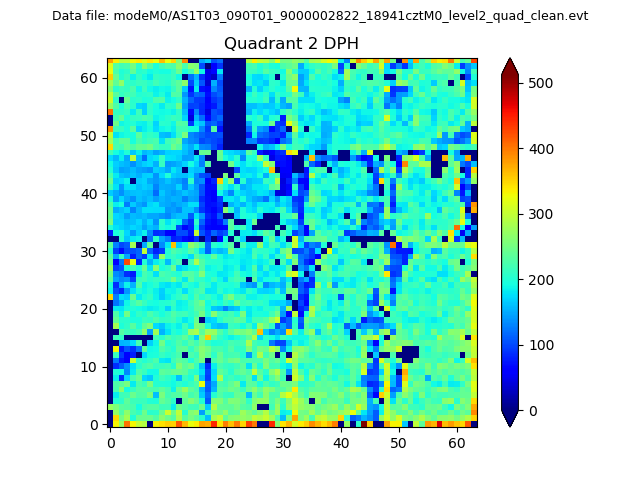
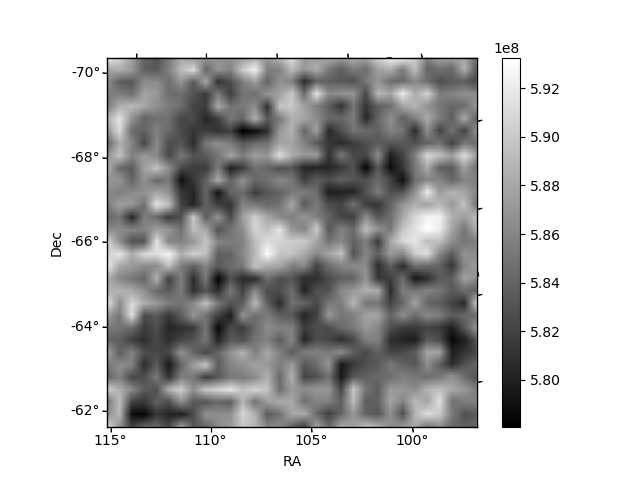
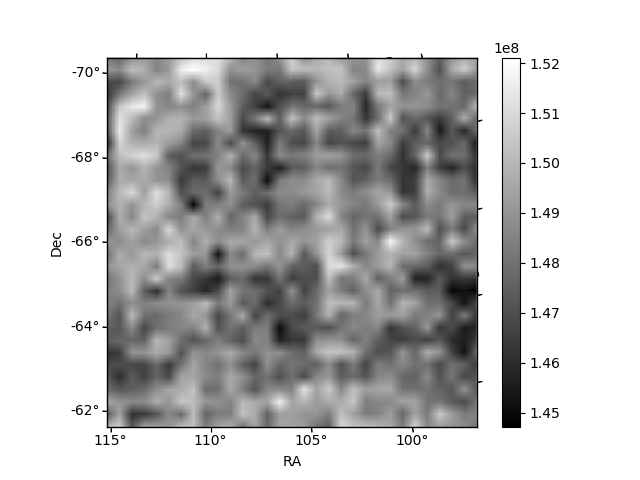
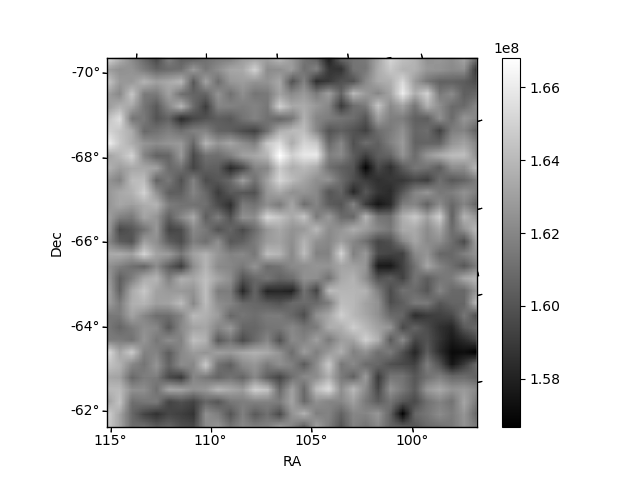
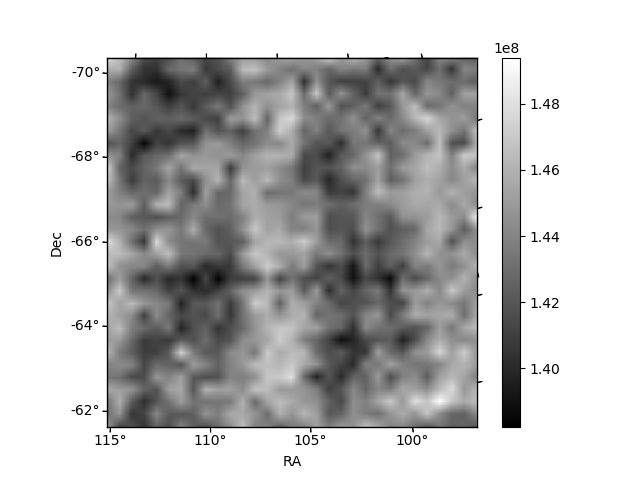
Histogram calculated using DETX and DETY for each event in the final _common_clean file
| Quadrant A | 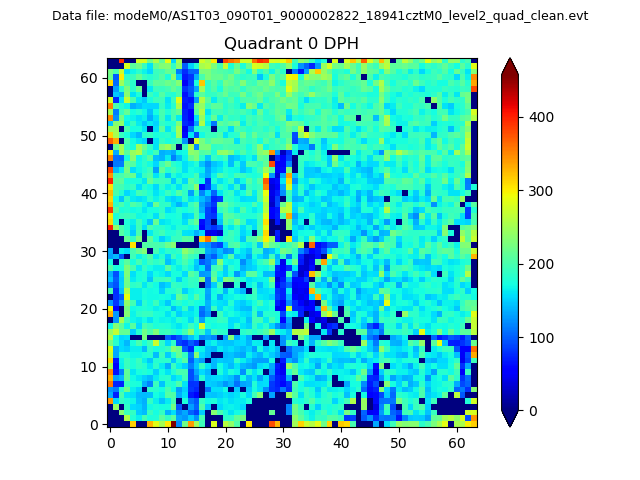 |
 |
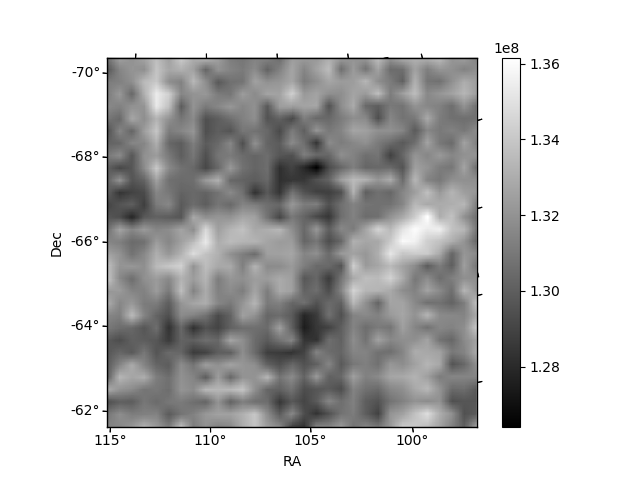
Quadrant B |
|---|---|---|---|
| Quadrant D | 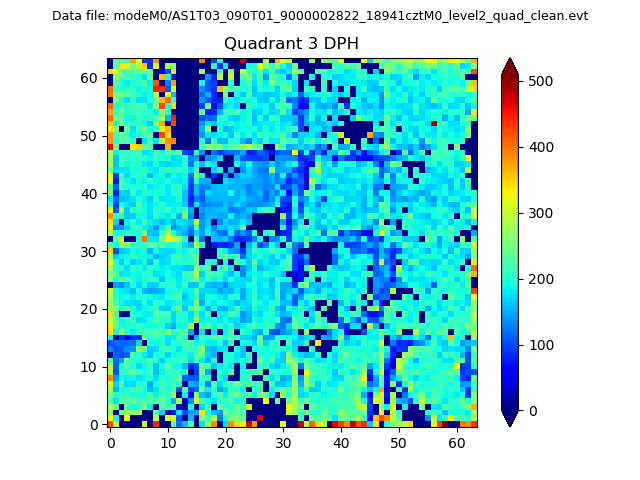 |
 |
Quadrant C |
| Plot type | Count rate plots | Images |
|---|---|---|
| Comparison with Poisson distribution Blue bars denote a histogram of data divided into 1 sec bins. Red curve is a Poisson curve with rate = median count rate of data. |
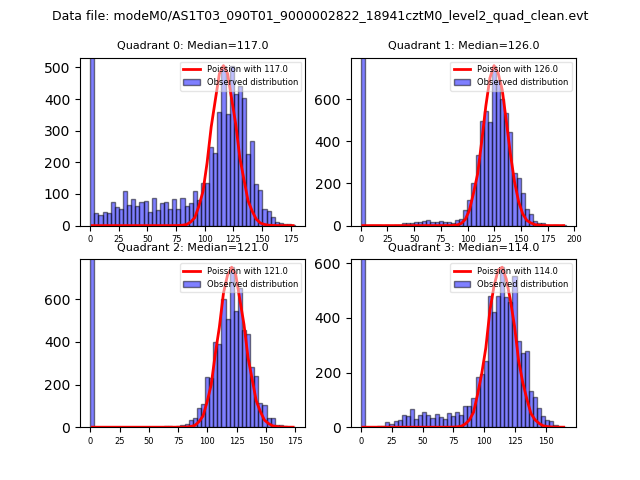 |
 |
| Quadrant-wise count rates Data is divided into 100 sec bins |
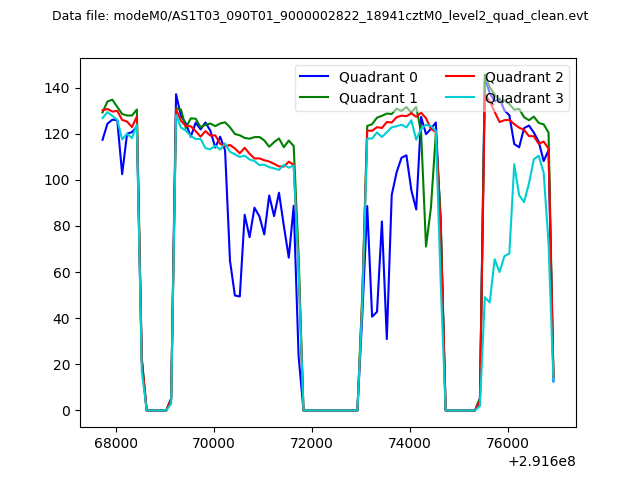 |
|
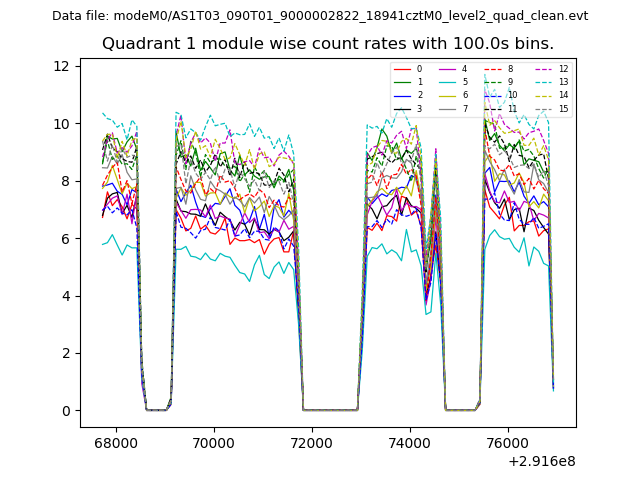
| Module-wise count rates for Quadrant A Data is divided into 100 sec bins |
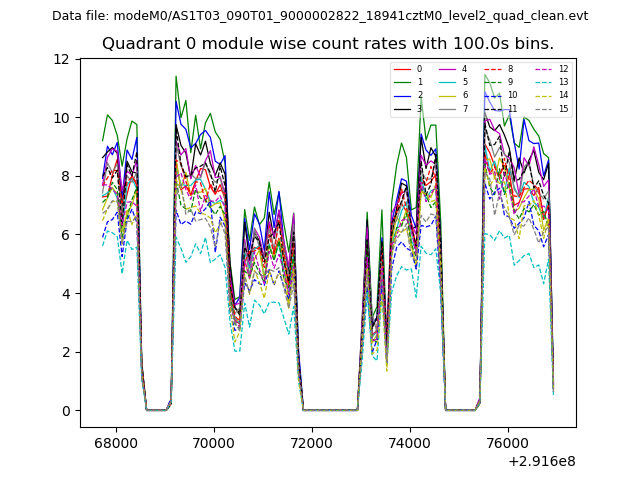 |
 |
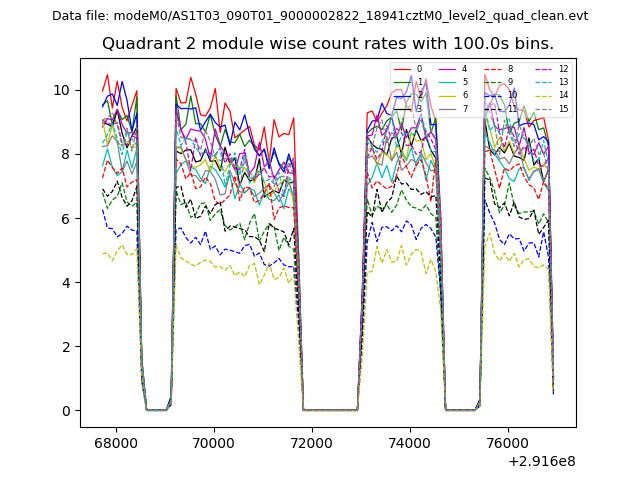
| Module-wise count rates for Quadrant B Data is divided into 100 sec bins |
 |
 |
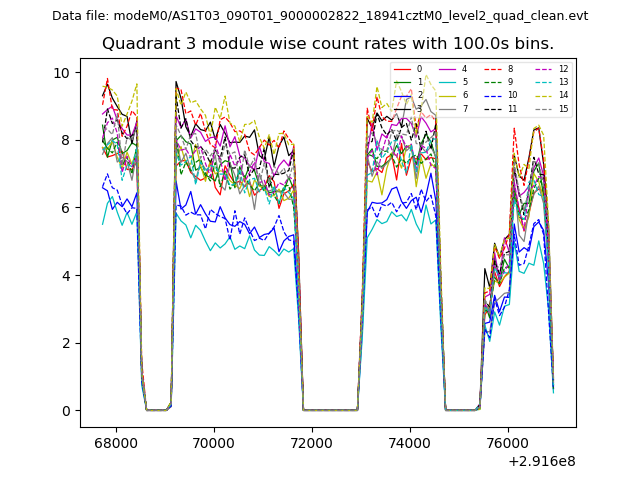
| Module-wise count rates for Quadrant C Data is divided into 100 sec bins |
 |
 |
| Module-wise count rates for Quadrant D Data is divided into 100 sec bins |
 |
 |
| Parameter | Plot |
|---|---|
| CZT HV Monitor | 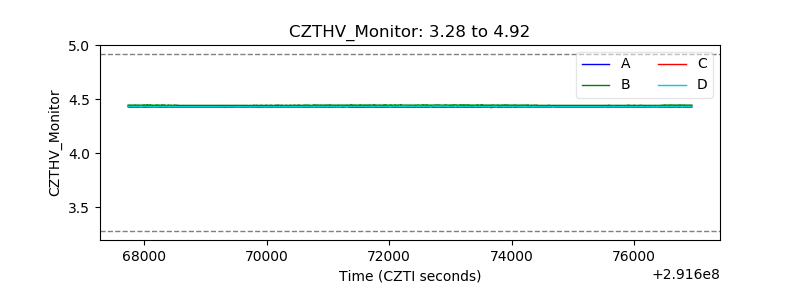 |
| D_VDD | 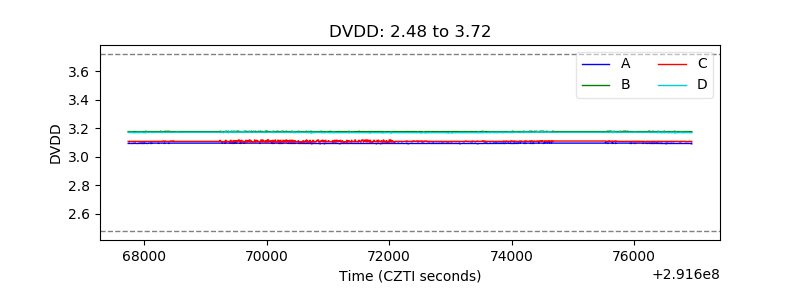 |
| Temperature 1 | 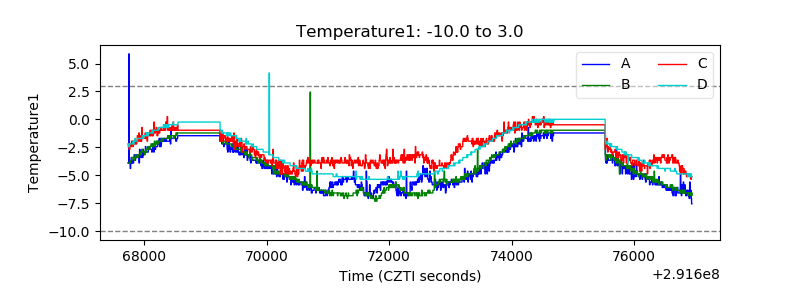 |
| Veto HV Monitor | 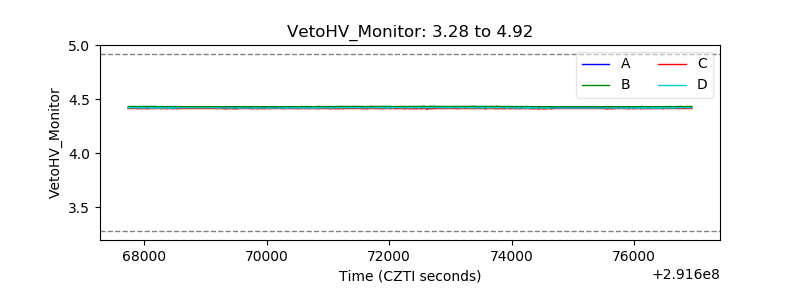 |
| Veto LLD | 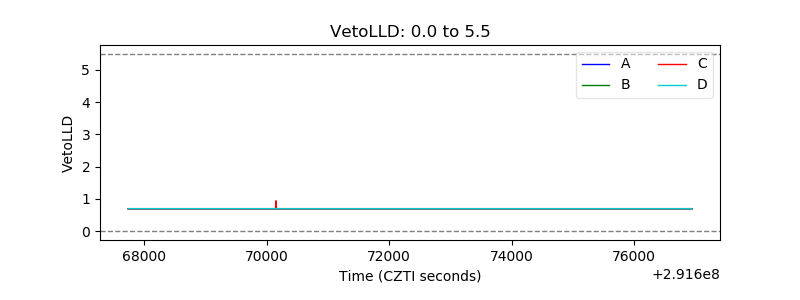 |
| Alpha Counter | 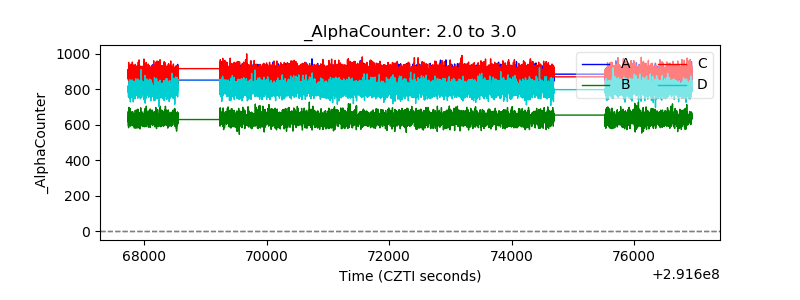 |
| _CPM_Rate | 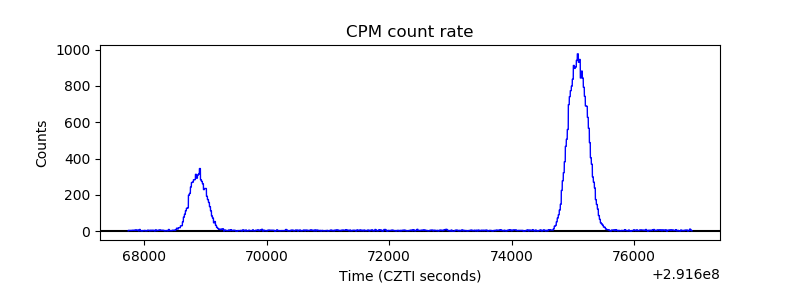 |
| CZT Counter | 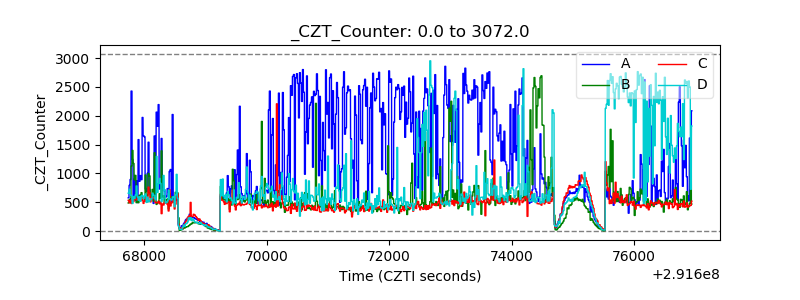 |
| +2.5 Volts monitor | 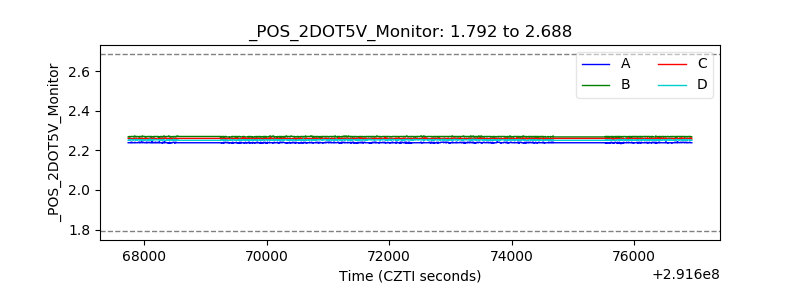 |
| +5 Volts monitor |  |
| _ROLL_ROT | 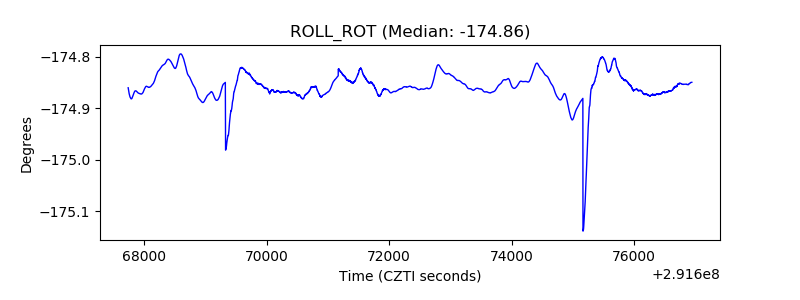 |
| _Roll_DEC | 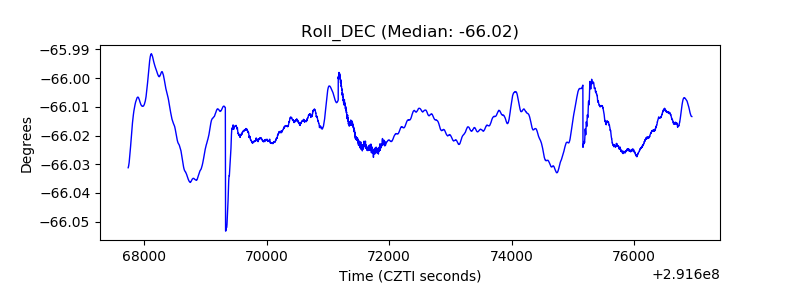 |
| _Roll_RA | 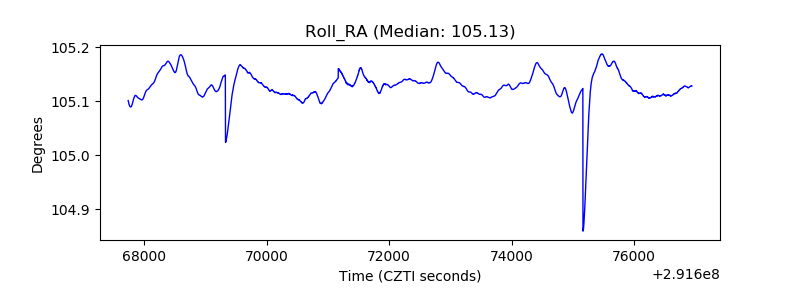 |
| Veto Counter | 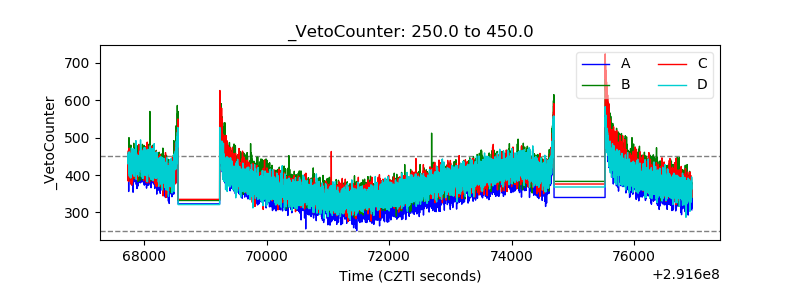 |