| Param | Original file | Final file |
|---|---|---|
| Filename | modeM0/AS1T03_090T01_9000002822_18944cztM0_level2.evt | modeM0/AS1T03_090T01_9000002822_18944cztM0_level2_quad_clean.evt |
| Size (bytes) | 672,454,080 | 102,945,600 |
| Size | 641.3 MB | 98.2 MB |
| Events in quadrant A | 5,451,646 | 665,915 |
| Events in quadrant B | 3,547,749 | 708,905 |
| Events in quadrant C | 3,201,632 | 682,260 |
| Events in quadrant D | 7,716,692 | 598,758 |
| Mode SS | |||
|---|---|---|---|
| Quadrant | BADHDUFLAG | Total packets | Discarded packets |
| A | 0 | 134 | 0 |
| B | 0 | 134 | 0 |
| C | 0 | 134 | 0 |
| D | 0 | 134 | 0 |
| Mode M9 | |||
|---|---|---|---|
| Quadrant | BADHDUFLAG | Total packets | Discarded packets |
| A | 0 | 19 | 0 |
| B | 0 | 20 | 0 |
| C | 0 | 20 | 0 |
| D | 0 | 20 | 0 |
| Mode M0 | |||
|---|---|---|---|
| Quadrant | BADHDUFLAG | Total packets | Discarded packets |
| A | 0 | 20453 | 2 |
| B | 0 | 14791 | 2 |
| C | 0 | 13600 | 2 |
| D | 0 | 27422 | 2 |
| Quadrant | Total seconds | Saturated seconds | Saturation percentage |
|---|---|---|---|
| A | 6616 | 675 | 10.202539% |
| B | 6616 | 66 | 0.997582% |
| C | 6616 | 44 | 0.665054% |
| D | 6616 | 1605 | 24.259371% |
Noise dominated data is calculated using 1-second bins in cleaned event files. If a bin has >2000 counts, and if more than 50% of those come from <1% of pixels, then it is considered to be noise-dominated and hence unusable.
| Quadrant | # 1 sec bins | Bins with >0 counts | Bins with >2000 counts | High rate bins dominated by noise | Noise dominated (total time) | Noise dominated (detector-on time) | Marked lightcurve |
|---|---|---|---|---|---|---|---|
| A | 7771 | 6617 | 523 | 523 | 6.73% | 7.90% | 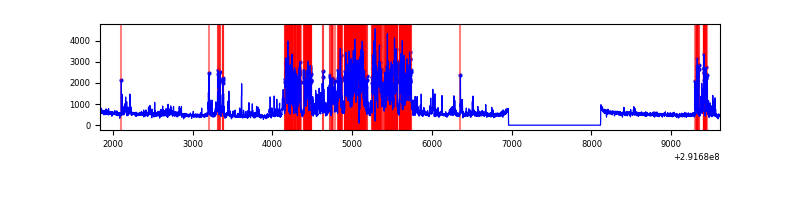 |
| B | 7771 | 6617 | 14 | 14 | 0.18% | 0.21% | 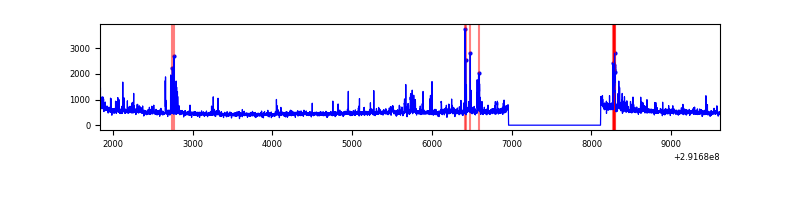 |
| C | 7771 | 6617 | 0 | 0 | 0.00% | 0.00% | 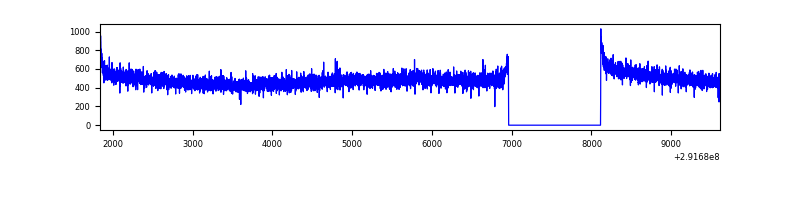 |
| D | 7771 | 6617 | 1118 | 1118 | 14.39% | 16.90% | 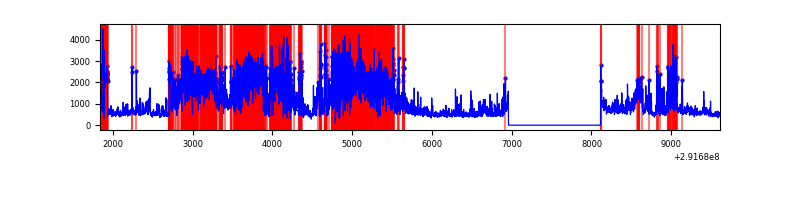 |
Top three noisy pixels from each quadrant. If the there are fewer than three noisy pixels in the level2.evt file, extra rows are filled as -1
| Pixel properties | Quadrant properties | ||||||
|---|---|---|---|---|---|---|---|
| Quadrant | DetID | PixID | Counts | Sigma | Mean | Median | Sigma |
| A | 14 | 235 | 2427045 | 15627.76 | 777 | 763 | 155.3 |
| A | 6 | 16 | 20934 | 129.92 | 777 | 763 | 155.3 |
| A | 13 | 254 | 9445 | 55.92 | 777 | 763 | 155.3 |
| B | 3 | 112 | 190632 | 1253.57 | 810 | 792 | 151.4 |
| B | 0 | 189 | 114663 | 751.92 | 810 | 792 | 151.4 |
| B | 0 | 229 | 31743 | 204.38 | 810 | 792 | 151.4 |
| C | 14 | 238 | 122310 | 675.07 | 778 | 782 | 180.0 |
| C | 3 | 233 | 47148 | 257.56 | 778 | 782 | 180.0 |
| C | 13 | 61 | 5501 | 26.21 | 778 | 782 | 180.0 |
| D | 7 | 238 | 4720704 | 27323.37 | 712 | 692 | 172.7 |
| D | 12 | 218 | 183836 | 1060.19 | 712 | 692 | 172.7 |
| D | 1 | 52 | 56745 | 324.48 | 712 | 692 | 172.7 |
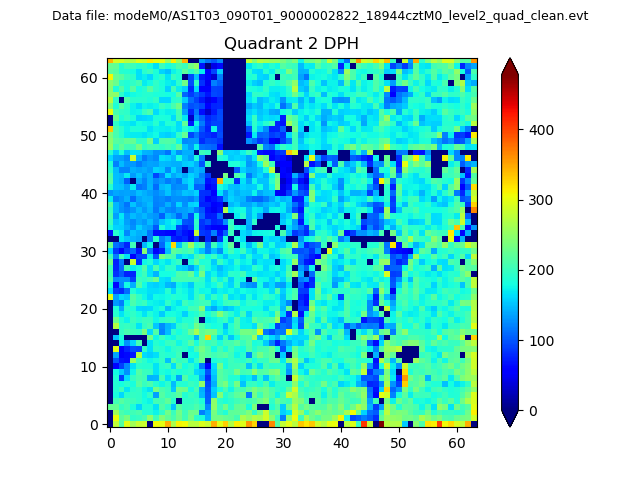
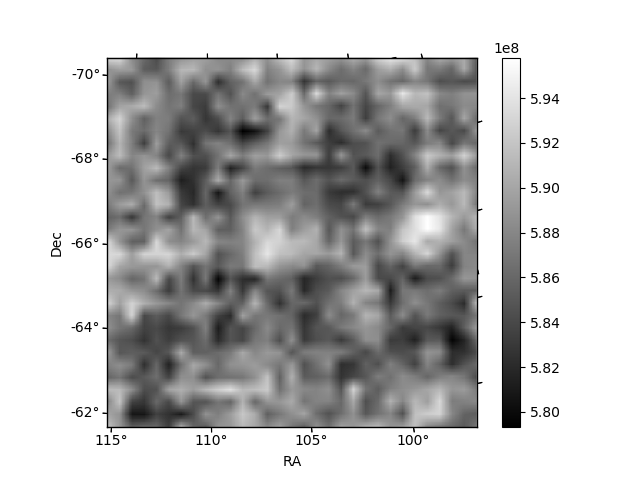
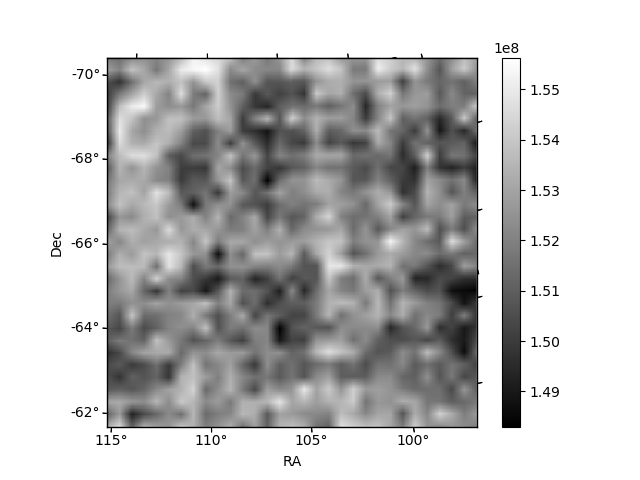
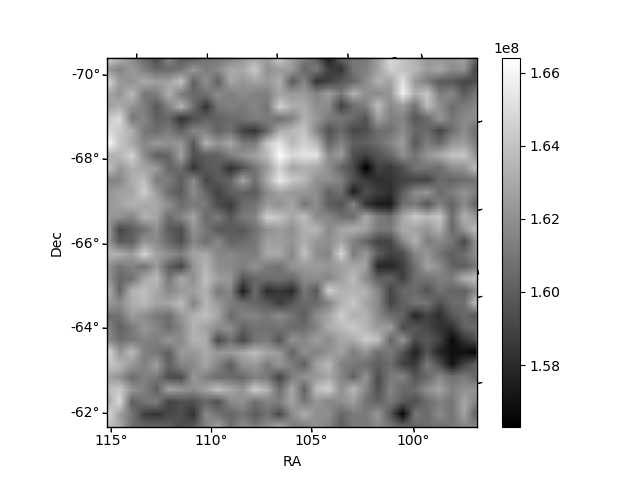
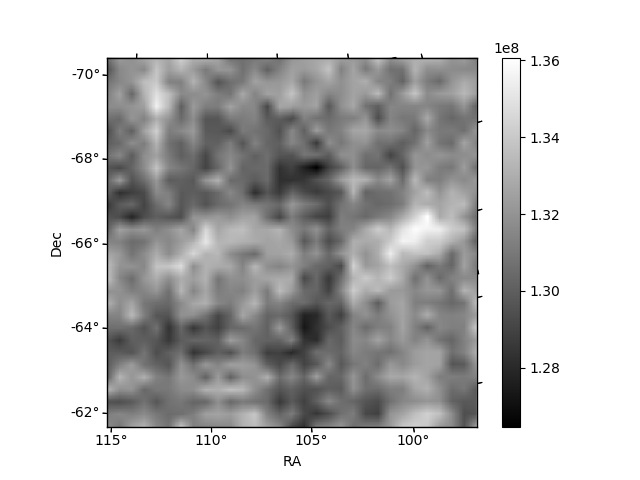
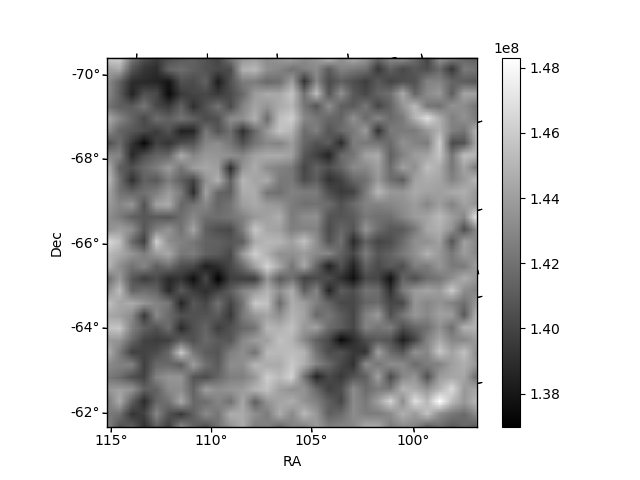
Histogram calculated using DETX and DETY for each event in the final _common_clean file
| Quadrant A | 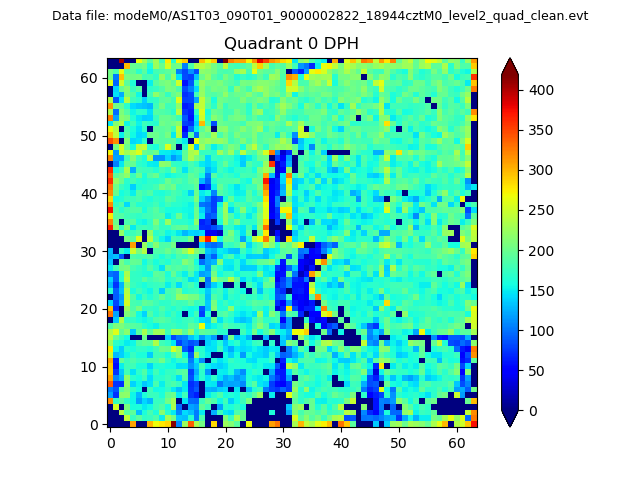 |
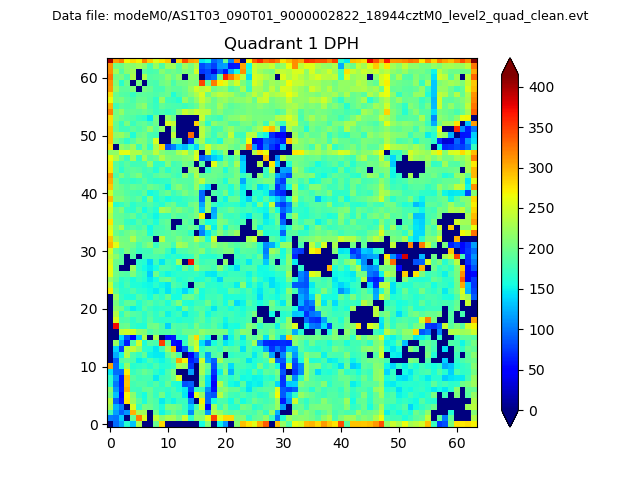 |
Quadrant B |
|---|---|---|---|
| Quadrant D | 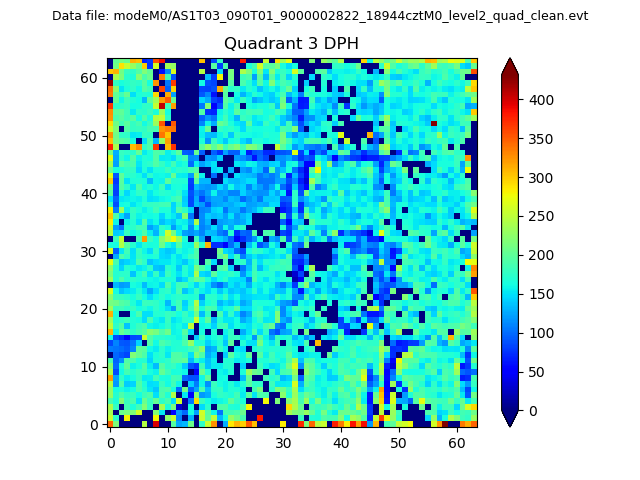 |
 |
Quadrant C |
| Plot type | Count rate plots | Images |
|---|---|---|
| Comparison with Poisson distribution Blue bars denote a histogram of data divided into 1 sec bins. Red curve is a Poisson curve with rate = median count rate of data. |
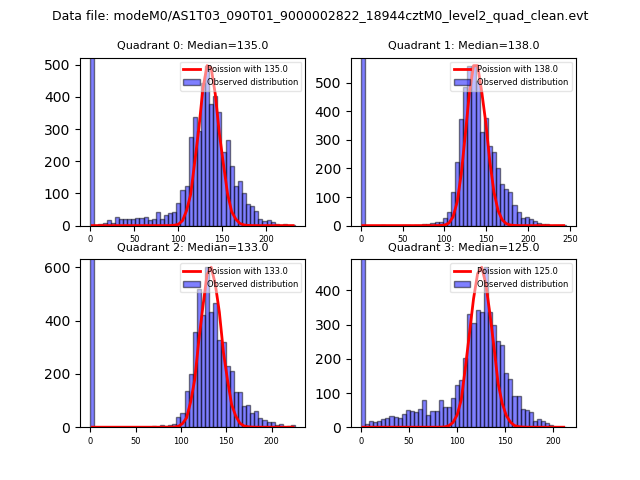 |
 |
| Quadrant-wise count rates Data is divided into 100 sec bins |
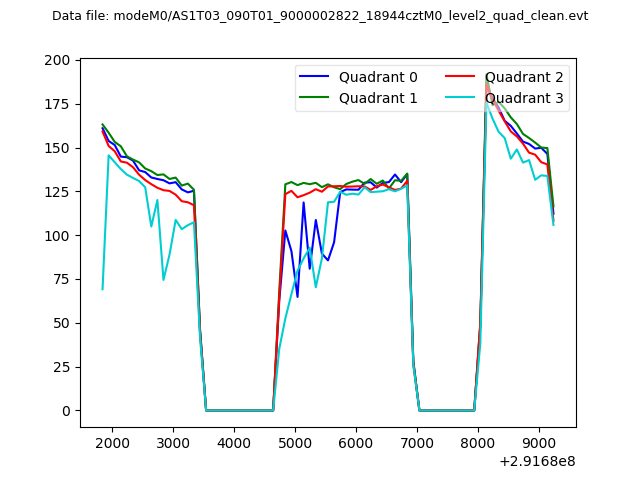 |
|
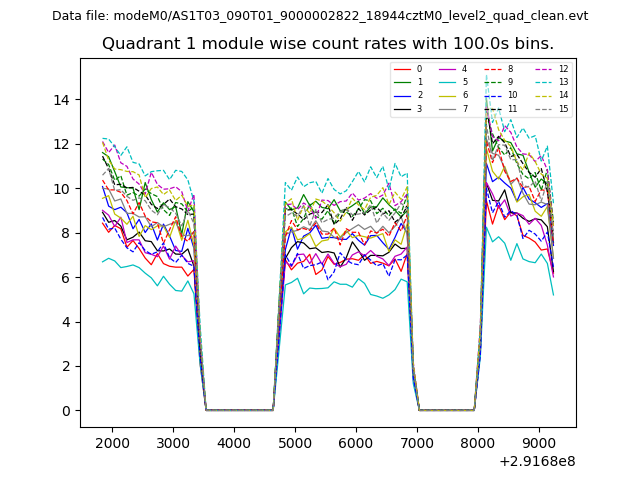
| Module-wise count rates for Quadrant A Data is divided into 100 sec bins |
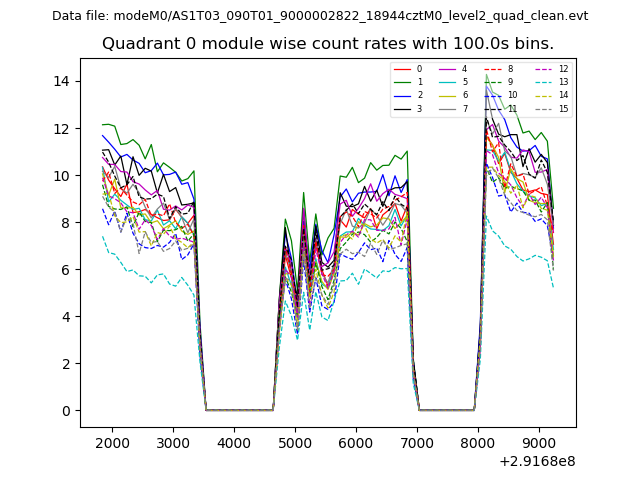 |
 |
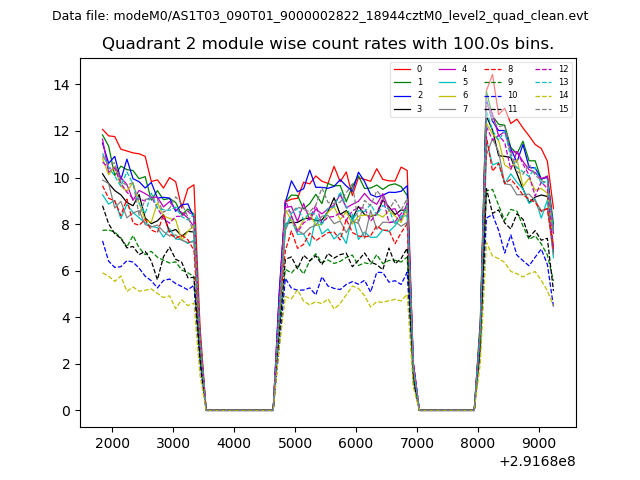
| Module-wise count rates for Quadrant B Data is divided into 100 sec bins |
 |
 |
| Module-wise count rates for Quadrant C Data is divided into 100 sec bins |
 |
 |
| Module-wise count rates for Quadrant D Data is divided into 100 sec bins |
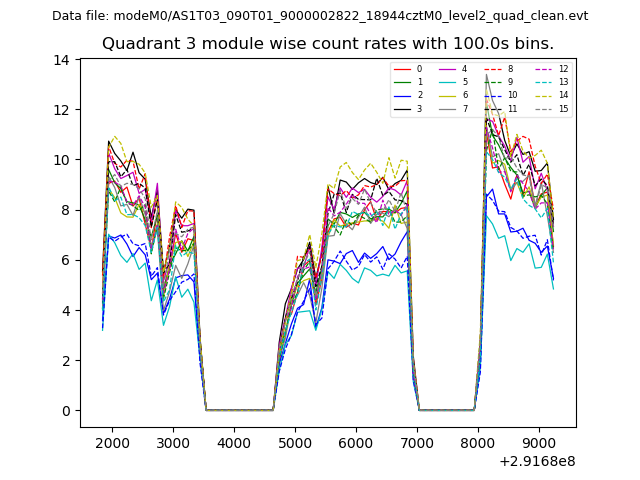 |
 |
| Parameter | Plot |
|---|---|
| CZT HV Monitor | 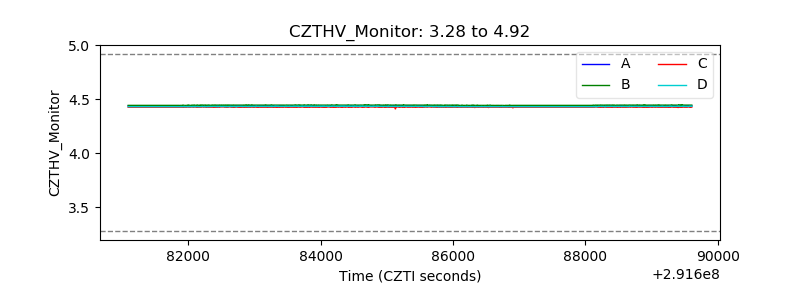 |
| D_VDD | 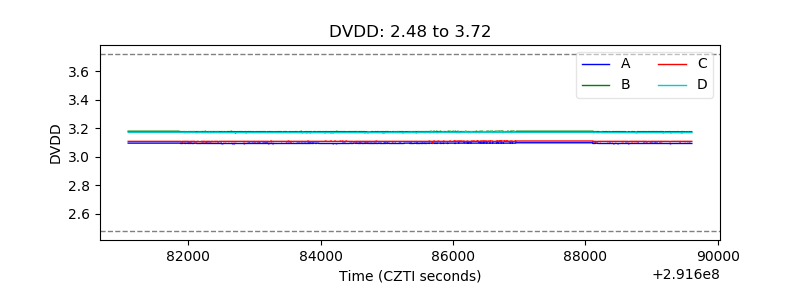 |
| Temperature 1 | 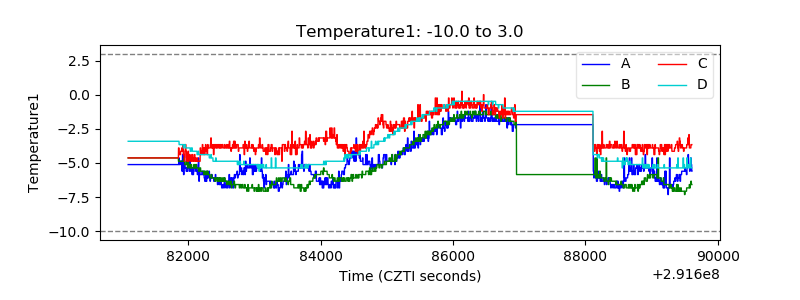 |
| Veto HV Monitor | 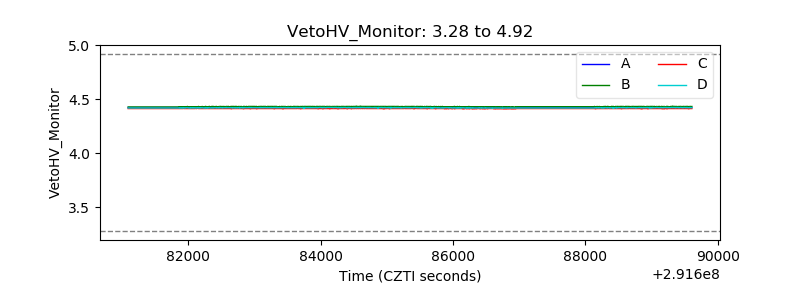 |
| Veto LLD | 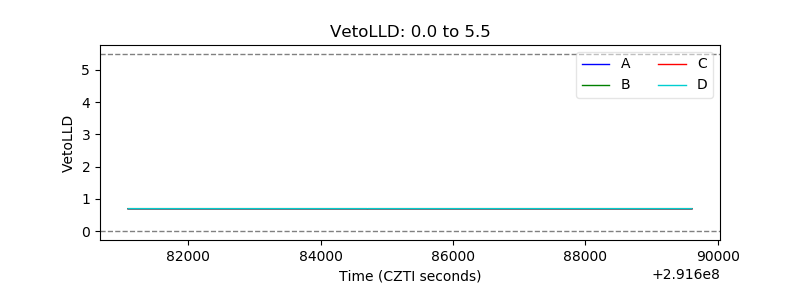 |
| Alpha Counter | 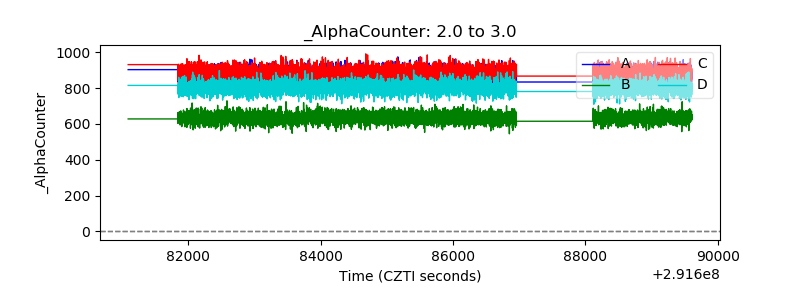 |
| _CPM_Rate | 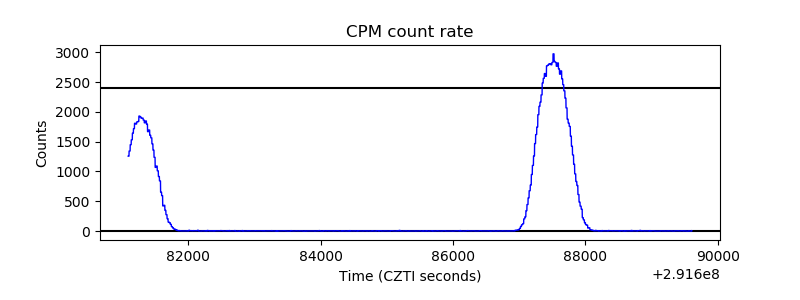 |
| CZT Counter | 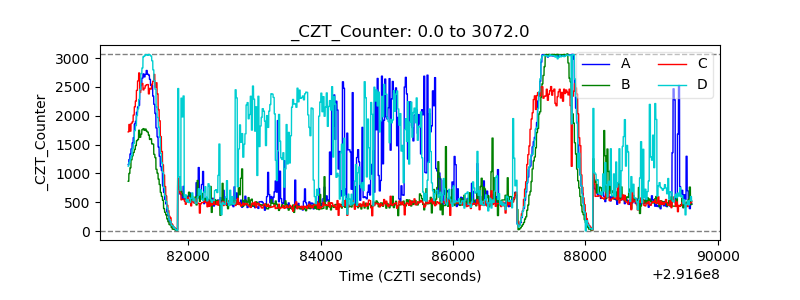 |
| +2.5 Volts monitor | 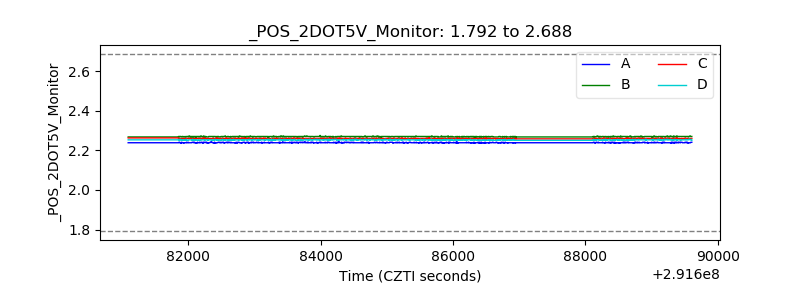 |
| +5 Volts monitor |  |
| _ROLL_ROT | 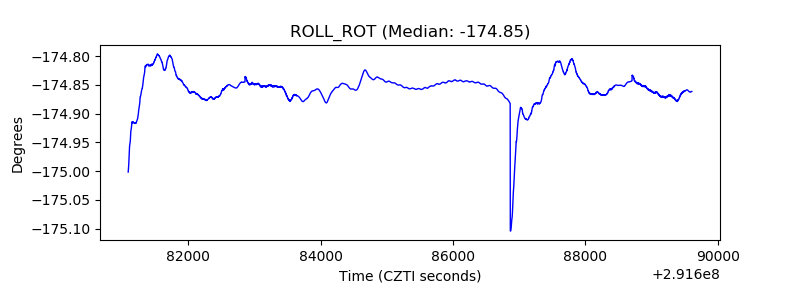 |
| _Roll_DEC | 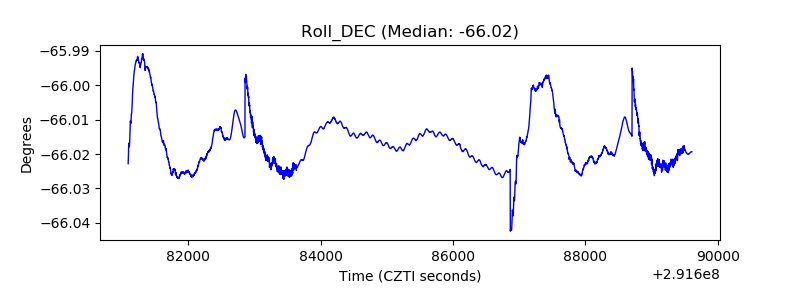 |
| _Roll_RA | 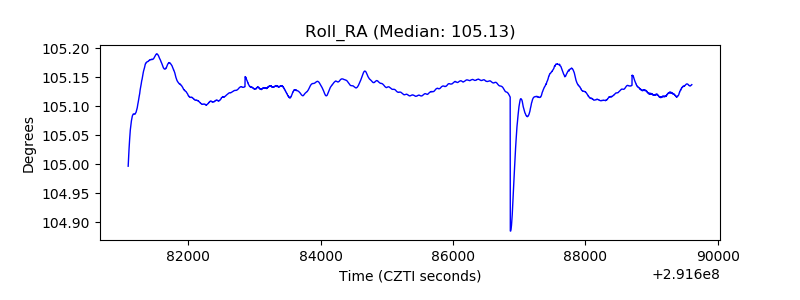 |
| Veto Counter | 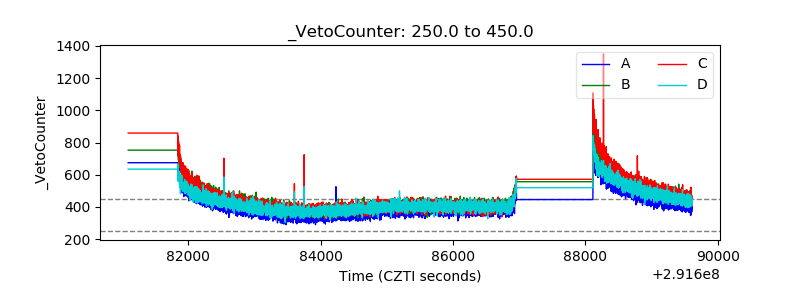 |