| Param | Original file | Final file |
|---|---|---|
| Filename | modeM0/AS1T03_090T01_9000002822_18945cztM0_level2.evt | modeM0/AS1T03_090T01_9000002822_18945cztM0_level2_quad_clean.evt |
| Size (bytes) | 550,987,200 | 95,293,440 |
| Size | 525.5 MB | 90.9 MB |
| Events in quadrant A | 3,547,745 | 633,481 |
| Events in quadrant B | 3,671,126 | 649,912 |
| Events in quadrant C | 3,232,479 | 627,758 |
| Events in quadrant D | 5,804,773 | 531,472 |
| Mode SS | |||
|---|---|---|---|
| Quadrant | BADHDUFLAG | Total packets | Discarded packets |
| A | 0 | 130 | 0 |
| B | 0 | 130 | 0 |
| C | 0 | 130 | 0 |
| D | 0 | 130 | 0 |
| Mode M9 | |||
|---|---|---|---|
| Quadrant | BADHDUFLAG | Total packets | Discarded packets |
| A | 0 | 12 | 0 |
| B | 0 | 12 | 0 |
| C | 0 | 12 | 0 |
| D | 0 | 12 | 0 |
| Mode M0 | |||
|---|---|---|---|
| Quadrant | BADHDUFLAG | Total packets | Discarded packets |
| A | 0 | 14460 | 1 |
| B | 0 | 14893 | 1 |
| C | 0 | 13386 | 1 |
| D | 0 | 21493 | 6 |
| Quadrant | Total seconds | Saturated seconds | Saturation percentage |
|---|---|---|---|
| A | 6344 | 77 | 1.213745% |
| B | 6344 | 64 | 1.008827% |
| C | 6344 | 55 | 0.866961% |
| D | 6344 | 1157 | 18.237705% |
Noise dominated data is calculated using 1-second bins in cleaned event files. If a bin has >2000 counts, and if more than 50% of those come from <1% of pixels, then it is considered to be noise-dominated and hence unusable.
| Quadrant | # 1 sec bins | Bins with >0 counts | Bins with >2000 counts | High rate bins dominated by noise | Noise dominated (total time) | Noise dominated (detector-on time) | Marked lightcurve |
|---|---|---|---|---|---|---|---|
| A | 7619 | 6345 | 31 | 31 | 0.41% | 0.49% | 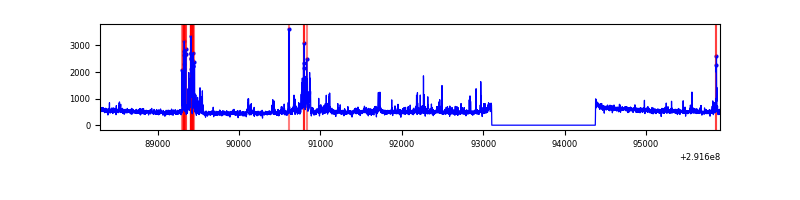 |
| B | 7619 | 6345 | 20 | 20 | 0.26% | 0.32% | 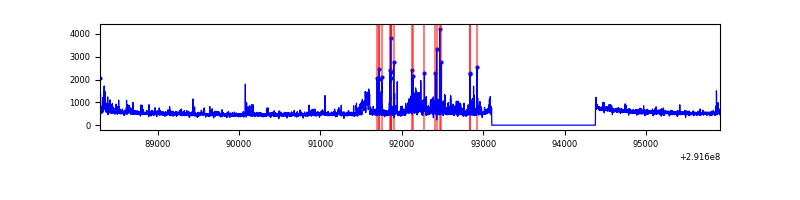 |
| C | 7619 | 6345 | 0 | 0 | 0.00% | 0.00% | 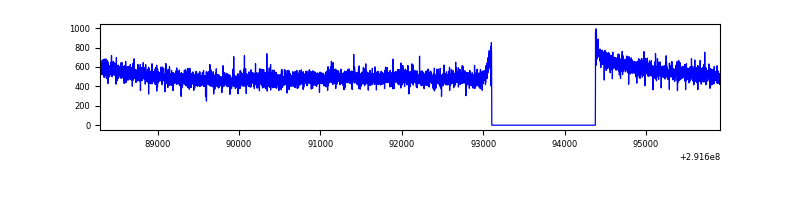 |
| D | 7619 | 6345 | 564 | 564 | 7.40% | 8.89% | 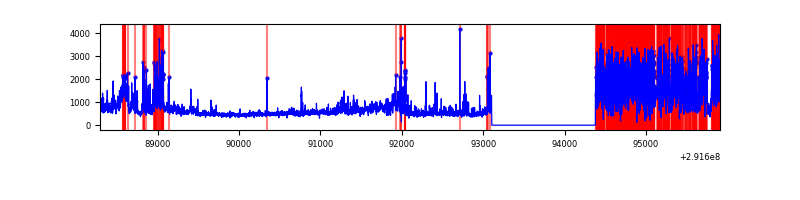 |
Top three noisy pixels from each quadrant. If the there are fewer than three noisy pixels in the level2.evt file, extra rows are filled as -1
| Pixel properties | Quadrant properties | ||||||
|---|---|---|---|---|---|---|---|
| Quadrant | DetID | PixID | Counts | Sigma | Mean | Median | Sigma |
| A | 14 | 235 | 430898 | 2705.6 | 804 | 789 | 159.0 |
| A | 11 | 29 | 15300 | 91.28 | 804 | 789 | 159.0 |
| A | 13 | 254 | 9323 | 53.68 | 804 | 789 | 159.0 |
| B | 3 | 112 | 173015 | 1165.85 | 810 | 791 | 147.7 |
| B | 7 | 220 | 145506 | 979.63 | 810 | 791 | 147.7 |
| B | 0 | 189 | 128913 | 867.31 | 810 | 791 | 147.7 |
| C | 14 | 238 | 127259 | 700.51 | 789 | 795 | 180.5 |
| C | 3 | 233 | 30271 | 163.27 | 789 | 795 | 180.5 |
| C | 13 | 61 | 5616 | 26.7 | 789 | 795 | 180.5 |
| D | 7 | 238 | 2889917 | 16997.5 | 707 | 688 | 170.0 |
| D | 12 | 218 | 105954 | 619.29 | 707 | 688 | 170.0 |
| D | 1 | 52 | 65213 | 379.6 | 707 | 688 | 170.0 |
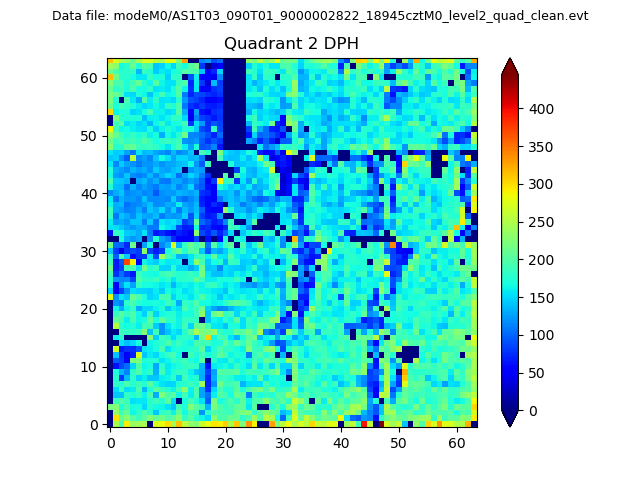
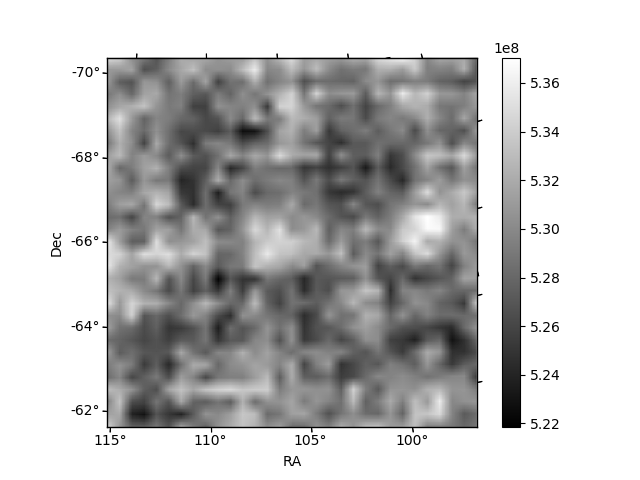
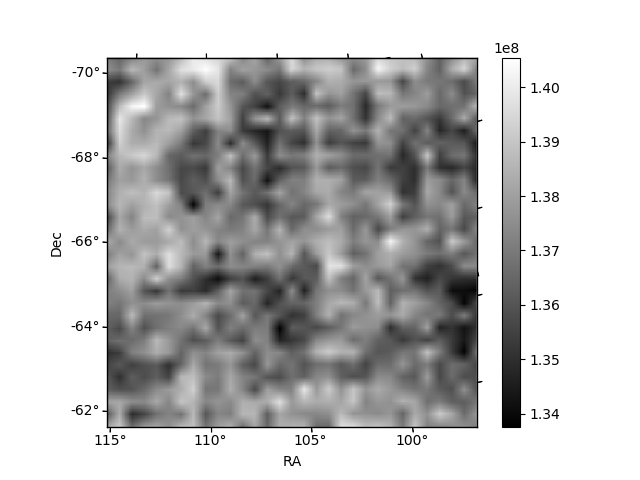
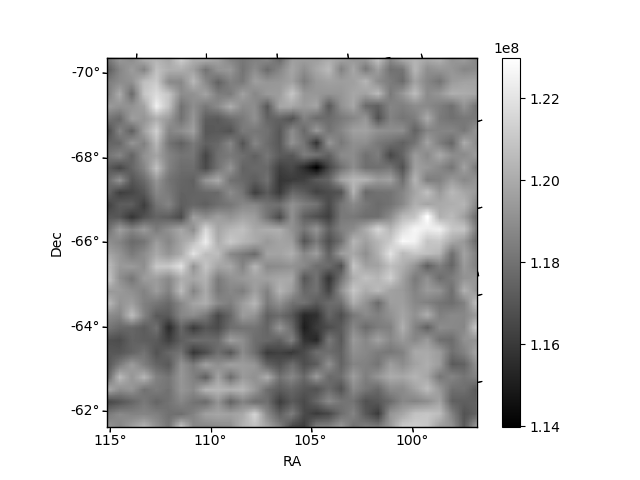
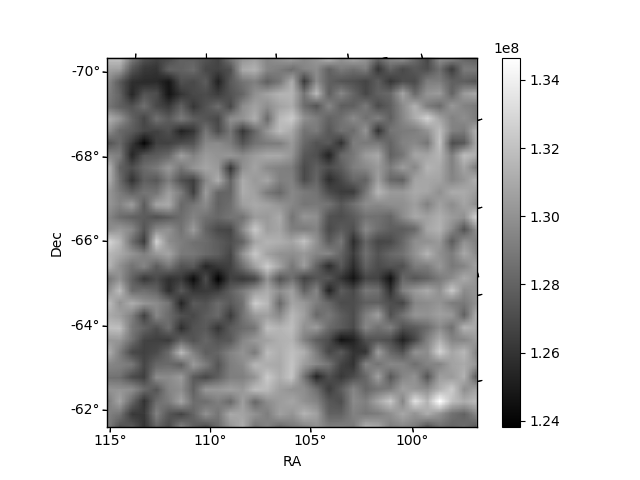
Histogram calculated using DETX and DETY for each event in the final _common_clean file
| Quadrant A | 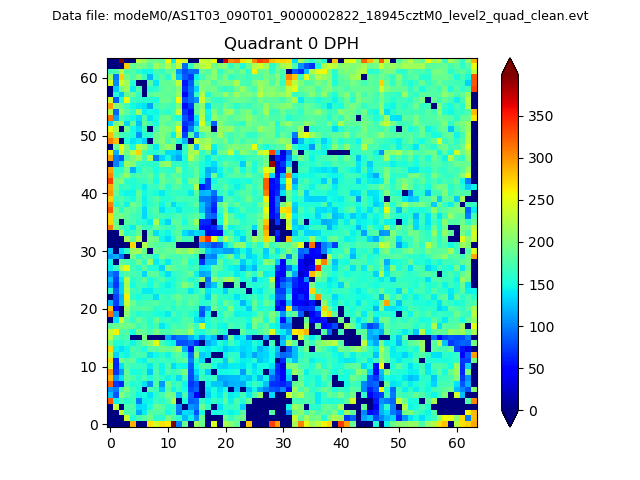 |
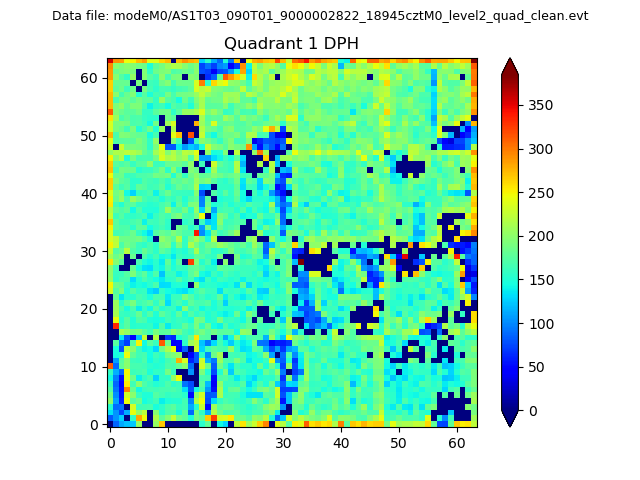 |
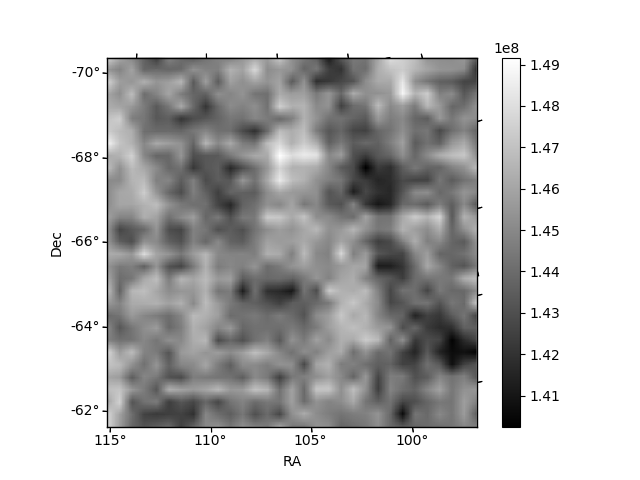
Quadrant B |
|---|---|---|---|
| Quadrant D | 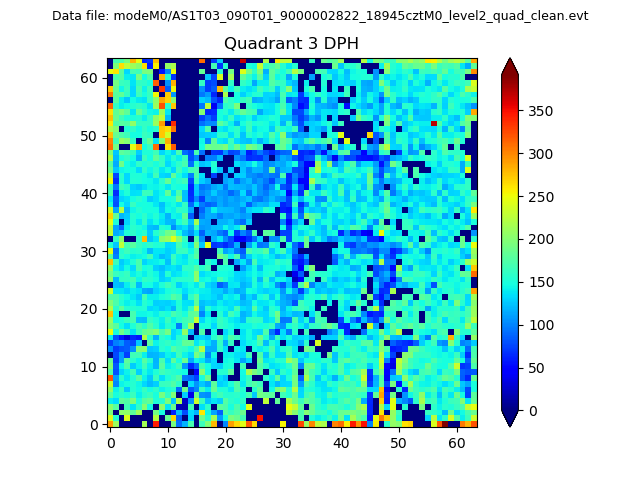 |
 |
Quadrant C |
| Plot type | Count rate plots | Images |
|---|---|---|
| Comparison with Poisson distribution Blue bars denote a histogram of data divided into 1 sec bins. Red curve is a Poisson curve with rate = median count rate of data. |
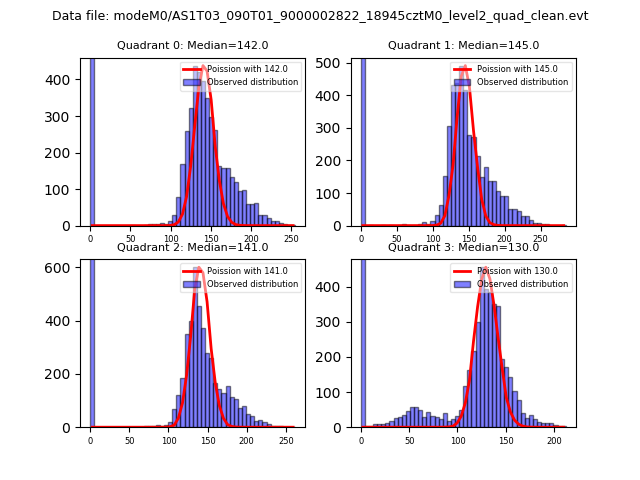 |
 |
| Quadrant-wise count rates Data is divided into 100 sec bins |
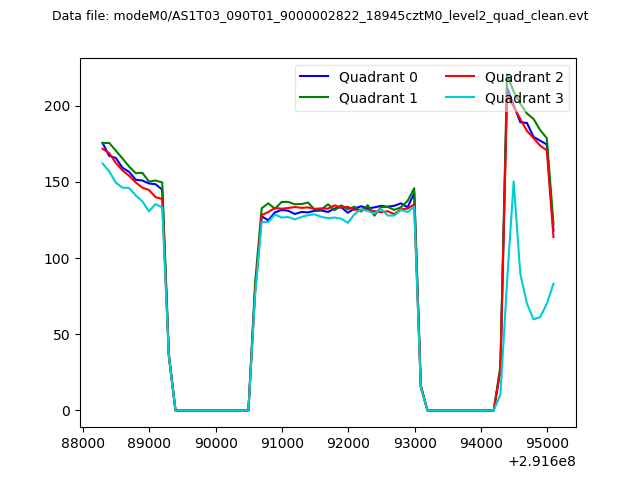 |
|
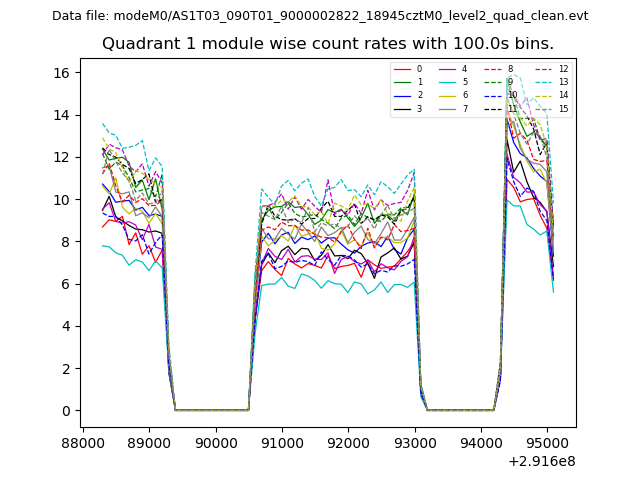
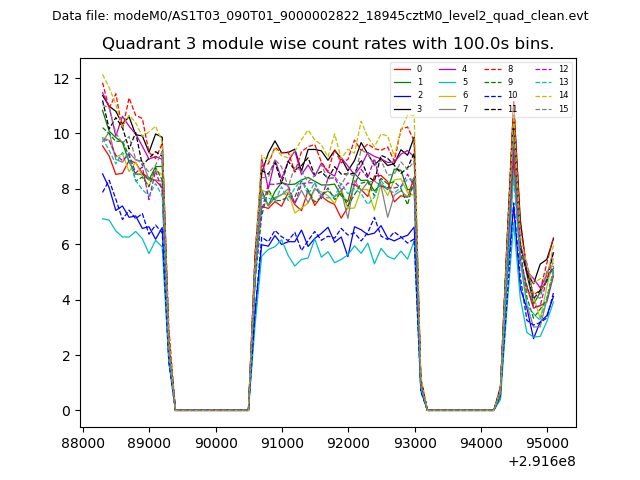
| Module-wise count rates for Quadrant A Data is divided into 100 sec bins |
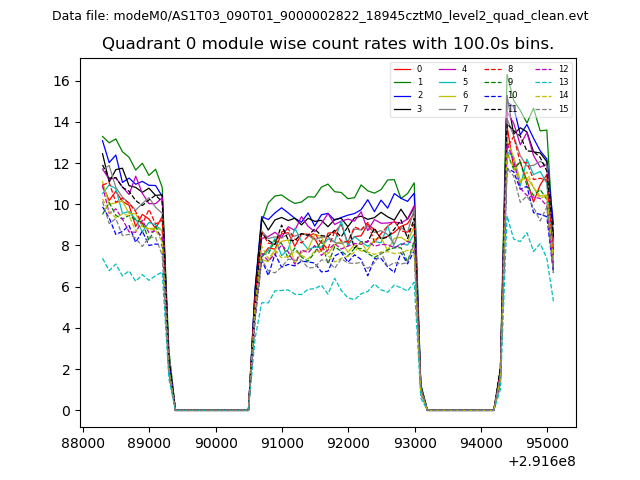 |
 |
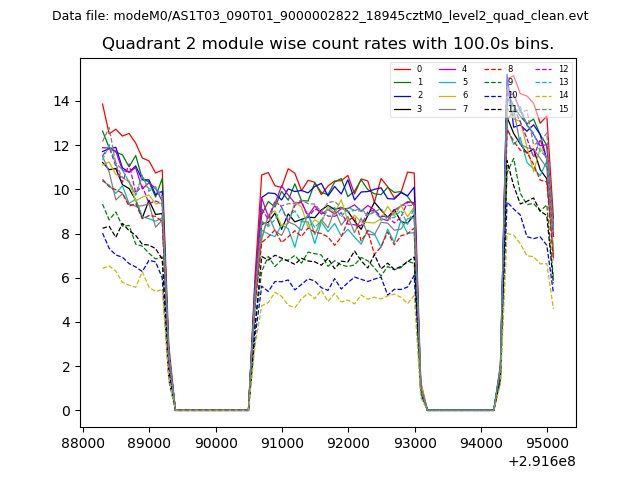
| Module-wise count rates for Quadrant B Data is divided into 100 sec bins |
 |
 |
| Module-wise count rates for Quadrant C Data is divided into 100 sec bins |
 |
 |
| Module-wise count rates for Quadrant D Data is divided into 100 sec bins |
 |
 |
| Parameter | Plot |
|---|---|
| CZT HV Monitor | 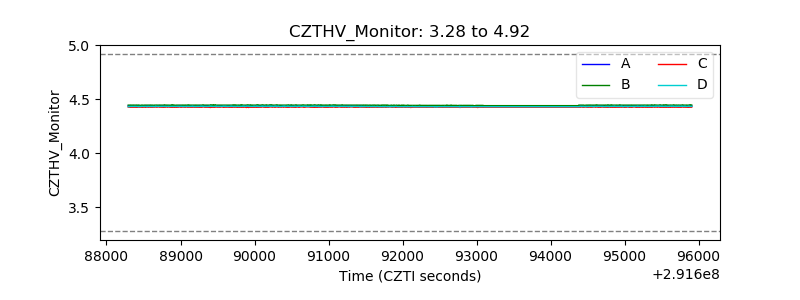 |
| D_VDD | 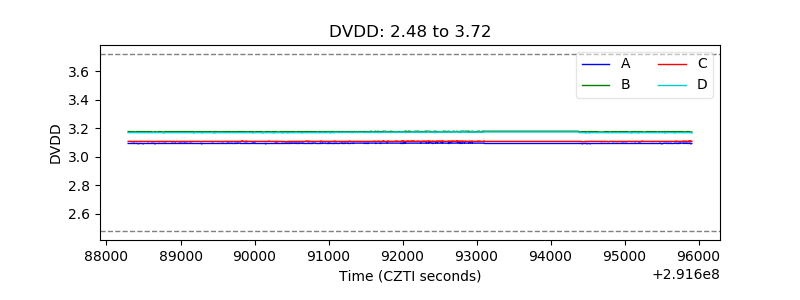 |
| Temperature 1 | 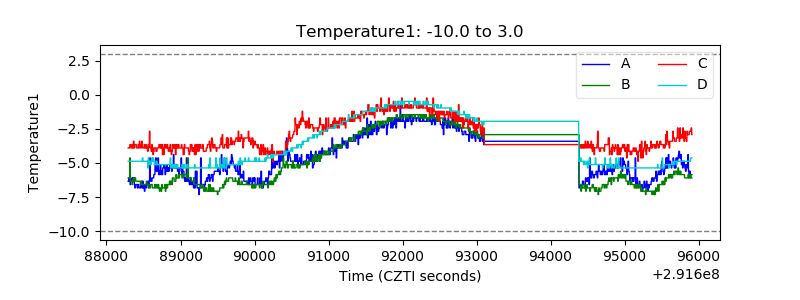 |
| Veto HV Monitor | 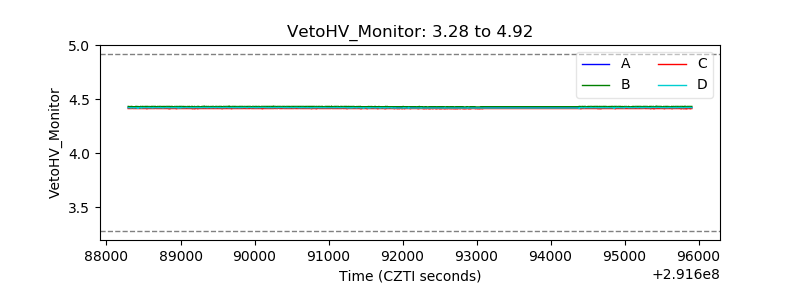 |
| Veto LLD | 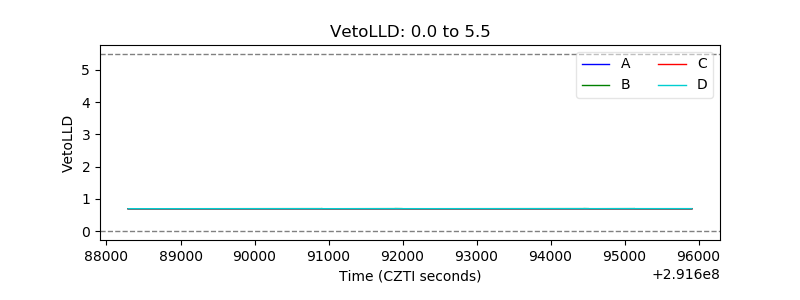 |
| Alpha Counter | 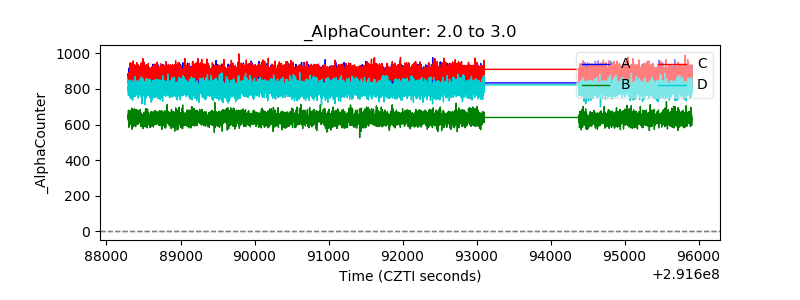 |
| _CPM_Rate |  |
| CZT Counter | 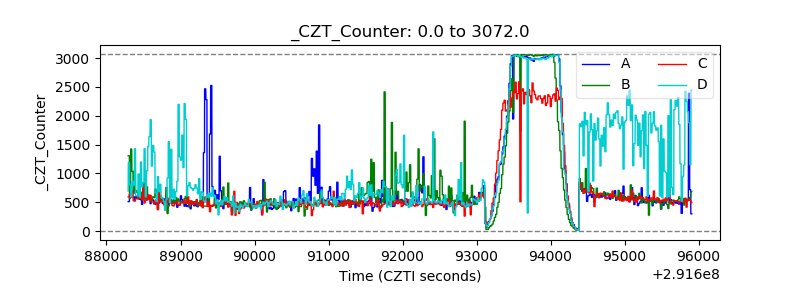 |
| +2.5 Volts monitor |  |
| +5 Volts monitor |  |
| _ROLL_ROT | 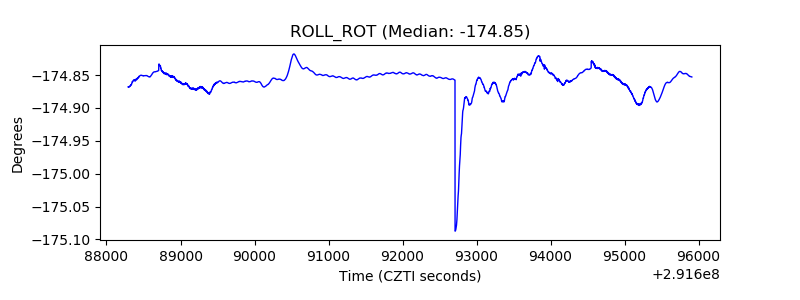 |
| _Roll_DEC | 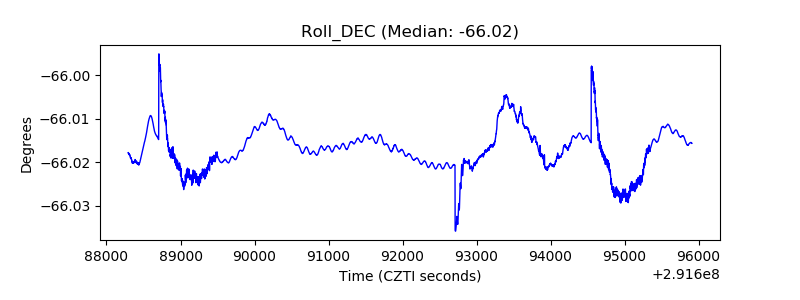 |
| _Roll_RA |  |
| Veto Counter | 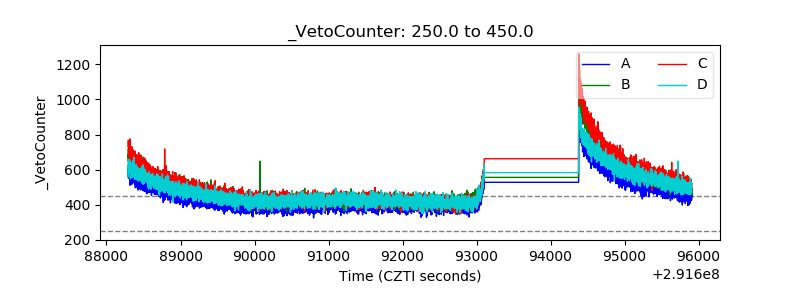 |