| Param | Original file | Final file |
|---|---|---|
| Filename | modeM0/AS1T03_090T01_9000002822_18947cztM0_level2.evt | modeM0/AS1T03_090T01_9000002822_18947cztM0_level2_quad_clean.evt |
| Size (bytes) | 695,246,400 | 80,133,120 |
| Size | 663.0 MB | 76.4 MB |
| Events in quadrant A | 3,337,909 | 532,199 |
| Events in quadrant B | 4,101,018 | 531,759 |
| Events in quadrant C | 3,374,291 | 528,673 |
| Events in quadrant D | 9,825,514 | 402,355 |
| Mode SS | |||
|---|---|---|---|
| Quadrant | BADHDUFLAG | Total packets | Discarded packets |
| A | 0 | 124 | 0 |
| B | 0 | 124 | 0 |
| C | 0 | 124 | 0 |
| D | 0 | 124 | 0 |
| Mode M9 | |||
|---|---|---|---|
| Quadrant | BADHDUFLAG | Total packets | Discarded packets |
| A | 0 | 16 | 0 |
| B | 0 | 17 | 0 |
| C | 0 | 17 | 0 |
| D | 0 | 17 | 0 |
| Mode M0 | |||
|---|---|---|---|
| Quadrant | BADHDUFLAG | Total packets | Discarded packets |
| A | 0 | 13503 | 2 |
| B | 0 | 16098 | 2 |
| C | 0 | 13810 | 2 |
| D | 0 | 33481 | 2 |
| Quadrant | Total seconds | Saturated seconds | Saturation percentage |
|---|---|---|---|
| A | 6172 | 49 | 0.793908% |
| B | 6172 | 280 | 4.536617% |
| C | 6172 | 94 | 1.523007% |
| D | 6172 | 2545 | 41.234608% |
Noise dominated data is calculated using 1-second bins in cleaned event files. If a bin has >2000 counts, and if more than 50% of those come from <1% of pixels, then it is considered to be noise-dominated and hence unusable.
| Quadrant | # 1 sec bins | Bins with >0 counts | Bins with >2000 counts | High rate bins dominated by noise | Noise dominated (total time) | Noise dominated (detector-on time) | Marked lightcurve |
|---|---|---|---|---|---|---|---|
| A | 7548 | 6173 | 0 | 0 | 0.00% | 0.00% | 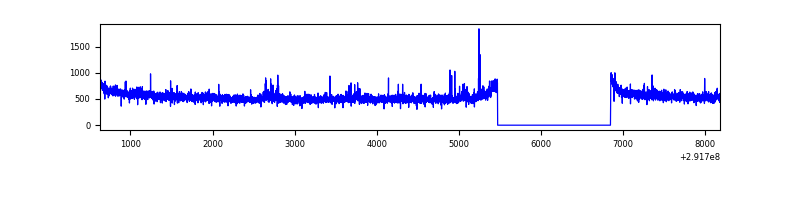 |
| B | 7548 | 6173 | 119 | 119 | 1.58% | 1.93% | 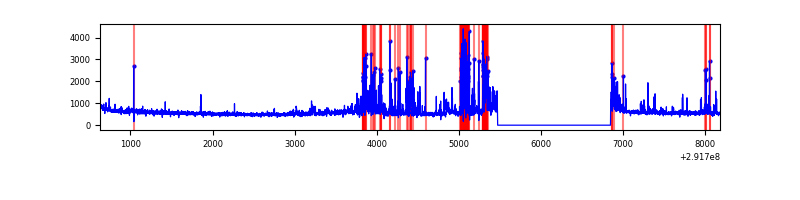 |
| C | 7548 | 6173 | 0 | 0 | 0.00% | 0.00% | 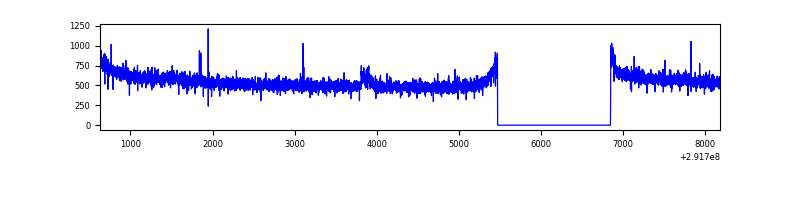 |
| D | 7548 | 6173 | 1619 | 1619 | 21.45% | 26.23% | 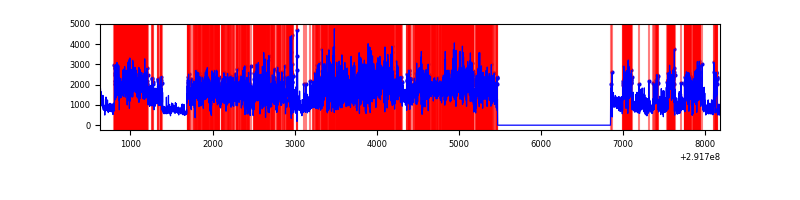 |
Top three noisy pixels from each quadrant. If the there are fewer than three noisy pixels in the level2.evt file, extra rows are filled as -1
| Pixel properties | Quadrant properties | ||||||
|---|---|---|---|---|---|---|---|
| Quadrant | DetID | PixID | Counts | Sigma | Mean | Median | Sigma |
| A | 14 | 235 | 78617 | 470.39 | 844 | 829 | 165.4 |
| A | 13 | 254 | 7894 | 42.72 | 844 | 829 | 165.4 |
| A | 0 | 226 | 7254 | 38.85 | 844 | 829 | 165.4 |
| B | 3 | 112 | 587186 | 3862.01 | 832 | 815 | 151.8 |
| B | 7 | 220 | 134228 | 878.7 | 832 | 815 | 151.8 |
| B | 0 | 189 | 88049 | 574.55 | 832 | 815 | 151.8 |
| C | 14 | 238 | 133542 | 713.71 | 823 | 831 | 185.9 |
| C | 3 | 233 | 28408 | 148.31 | 823 | 831 | 185.9 |
| C | 13 | 61 | 5853 | 27.01 | 823 | 831 | 185.9 |
| D | 7 | 238 | 6544068 | 38046.04 | 725 | 706 | 172.0 |
| D | 12 | 218 | 265819 | 1541.49 | 725 | 706 | 172.0 |
| D | 12 | 233 | 197790 | 1145.93 | 725 | 706 | 172.0 |
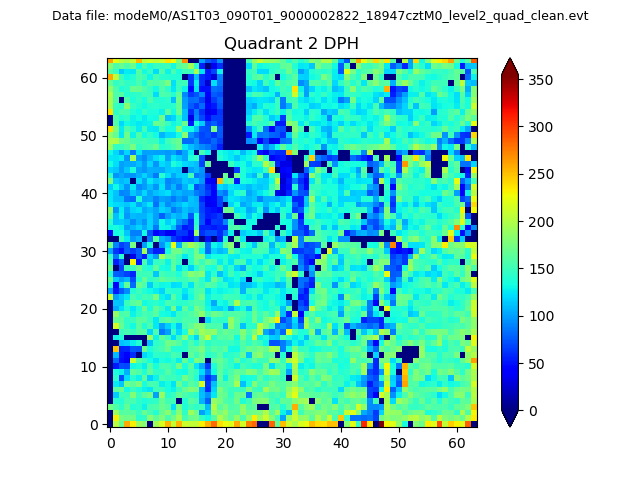
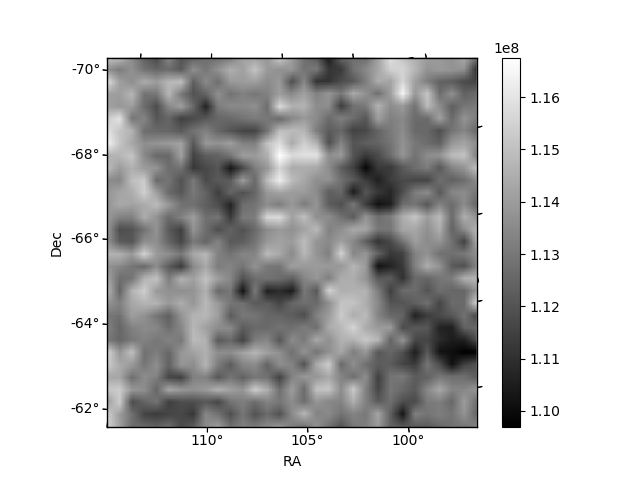
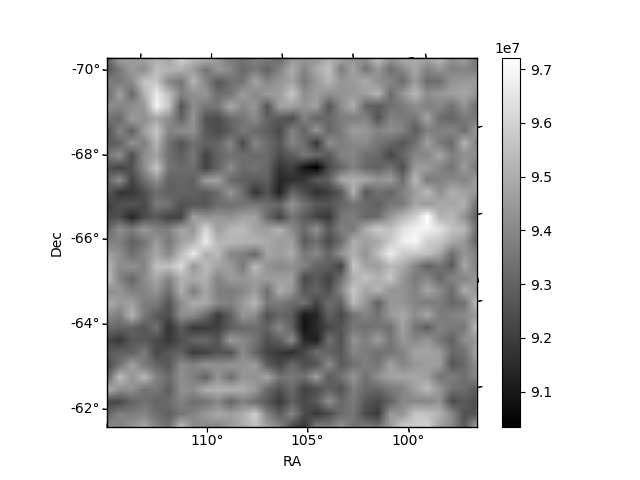
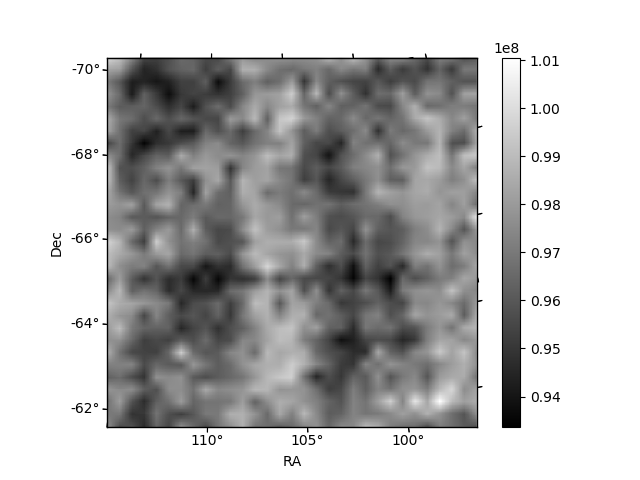
Histogram calculated using DETX and DETY for each event in the final _common_clean file
| Quadrant A | 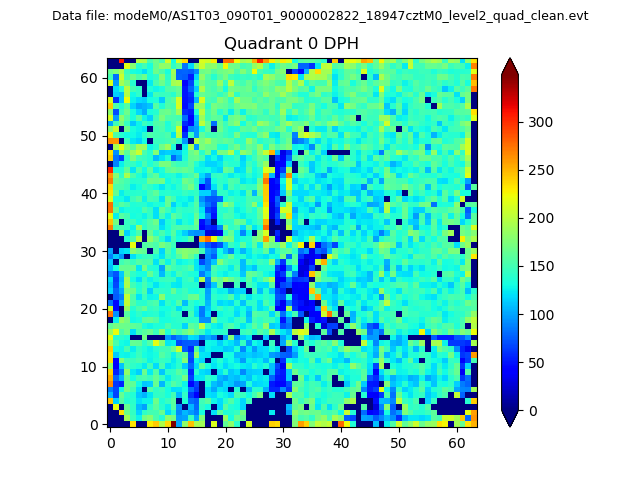 |
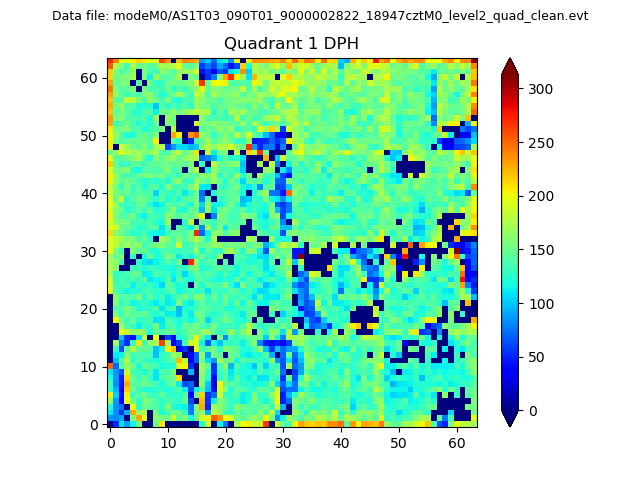 |
Quadrant B |
|---|---|---|---|
| Quadrant D | 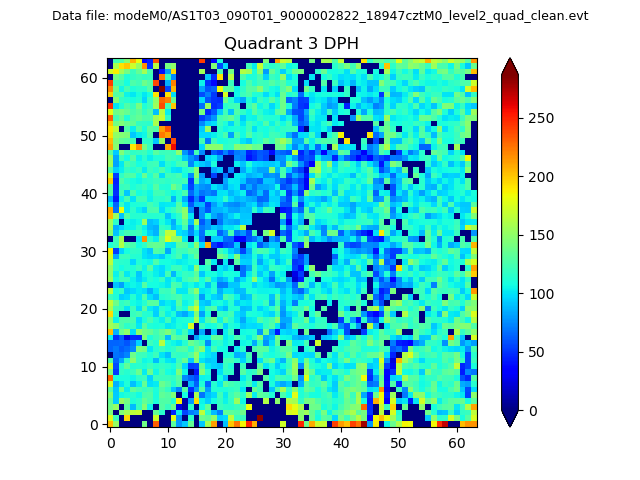 |
 |
Quadrant C |
| Plot type | Count rate plots | Images |
|---|---|---|
| Comparison with Poisson distribution Blue bars denote a histogram of data divided into 1 sec bins. Red curve is a Poisson curve with rate = median count rate of data. |
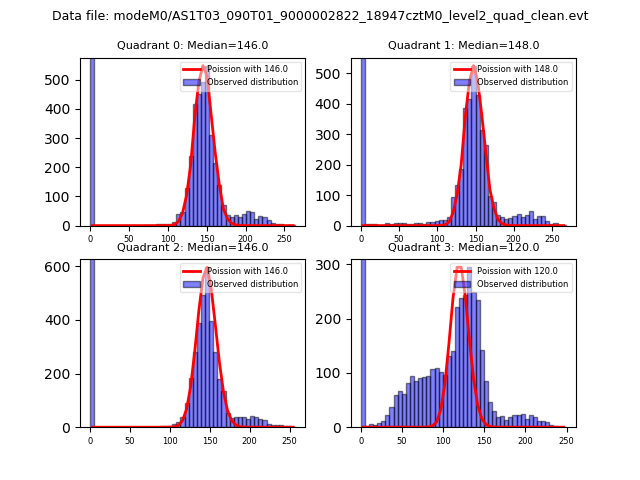 |
 |
| Quadrant-wise count rates Data is divided into 100 sec bins |
 |
|
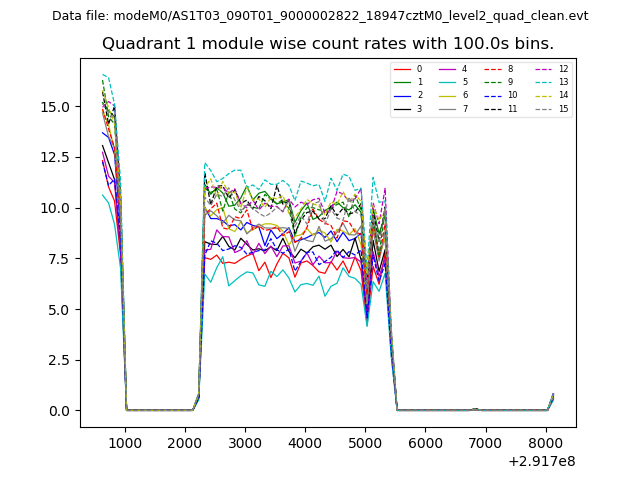
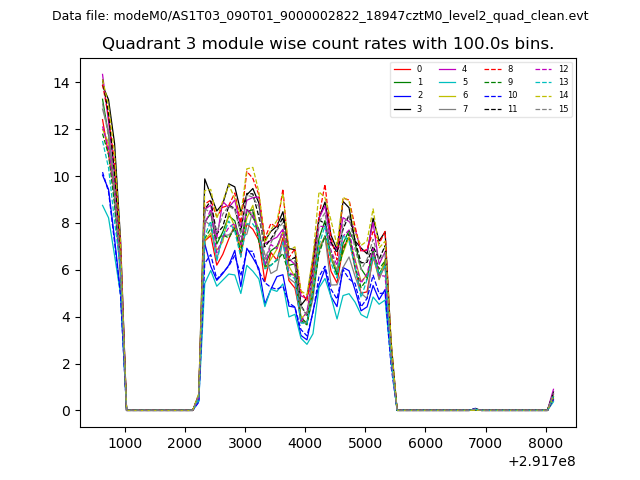
| Module-wise count rates for Quadrant A Data is divided into 100 sec bins |
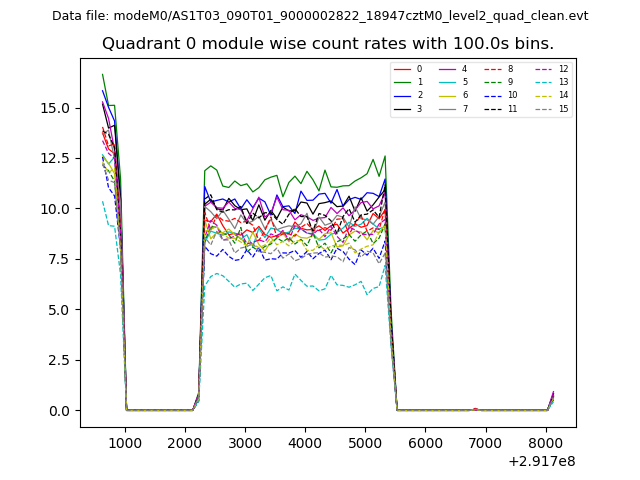 |
 |
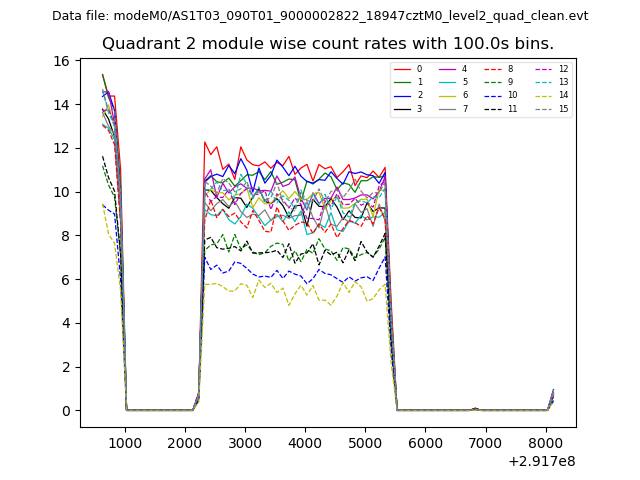
| Module-wise count rates for Quadrant B Data is divided into 100 sec bins |
 |
 |
| Module-wise count rates for Quadrant C Data is divided into 100 sec bins |
 |
 |
| Module-wise count rates for Quadrant D Data is divided into 100 sec bins |
 |
 |
| Parameter | Plot |
|---|---|
| CZT HV Monitor | 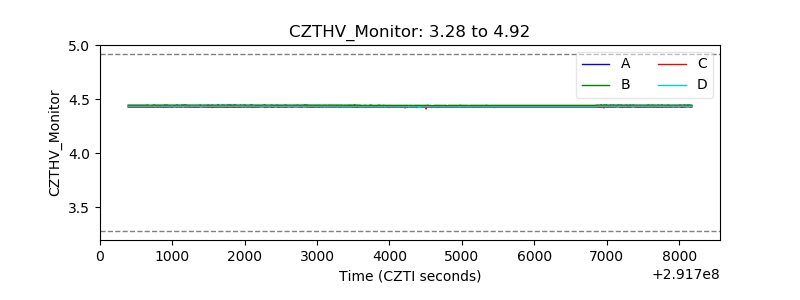 |
| D_VDD | 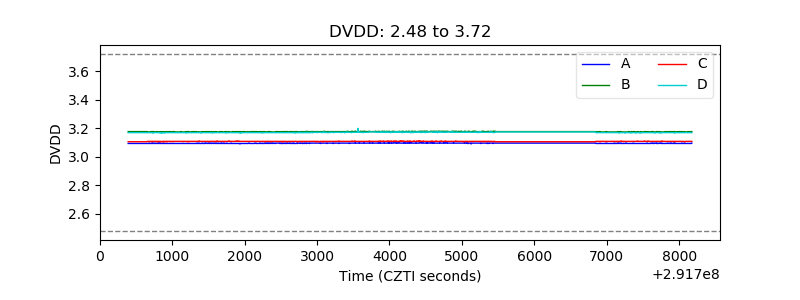 |
| Temperature 1 | 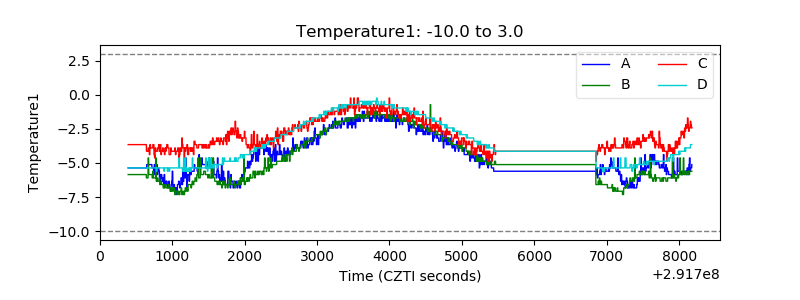 |
| Veto HV Monitor |  |
| Veto LLD | 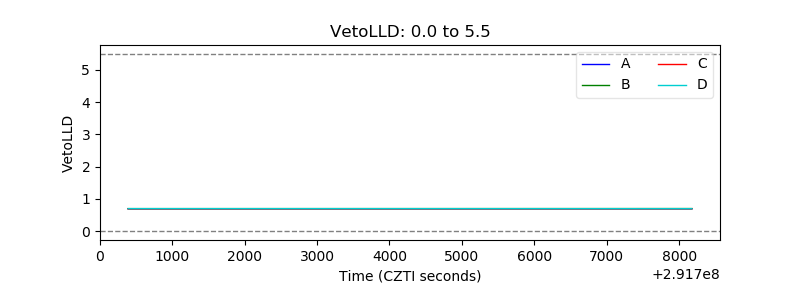 |
| Alpha Counter |  |
| _CPM_Rate | 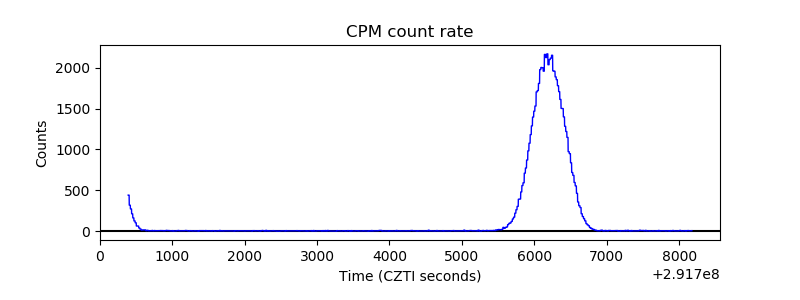 |
| CZT Counter | 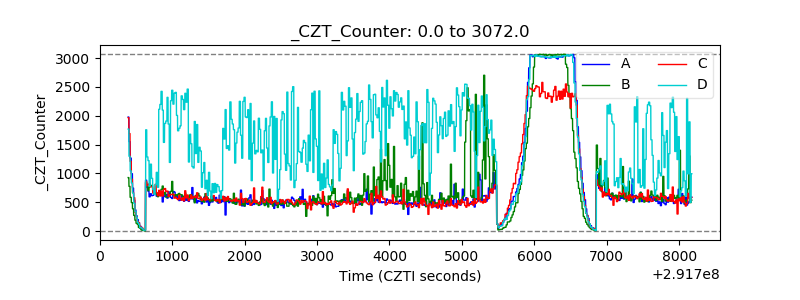 |
| +2.5 Volts monitor | 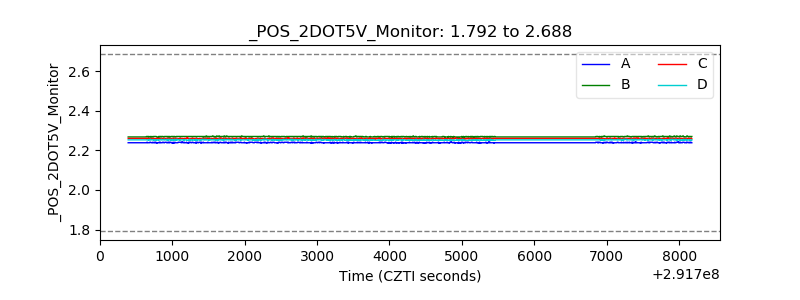 |
| +5 Volts monitor |  |
| _ROLL_ROT | 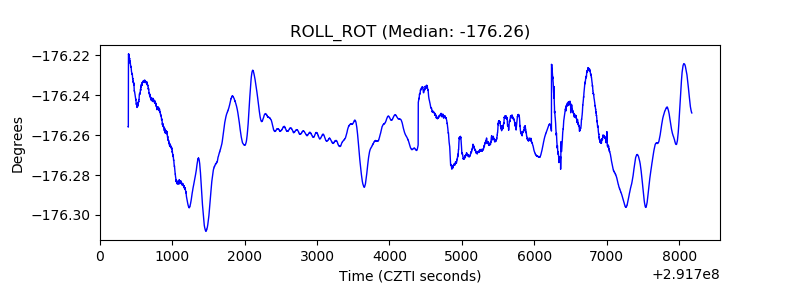 |
| _Roll_DEC | 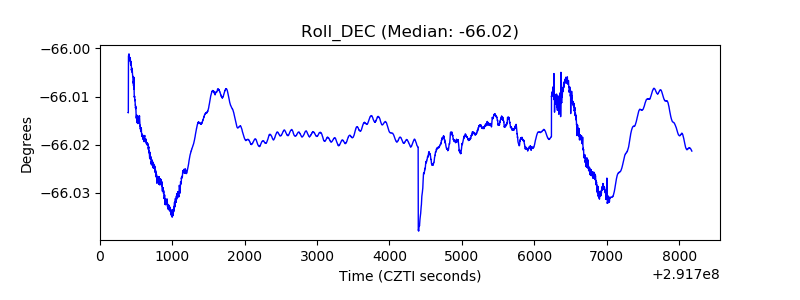 |
| _Roll_RA | 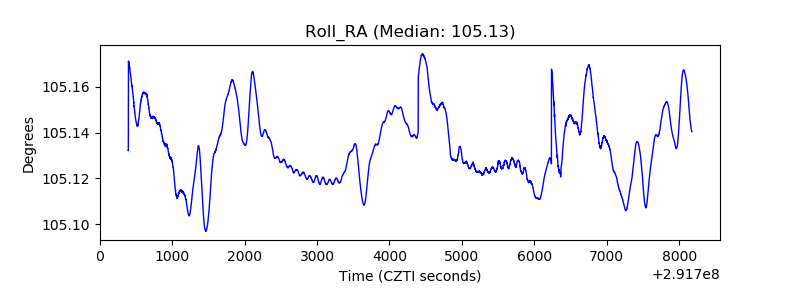 |
| Veto Counter | 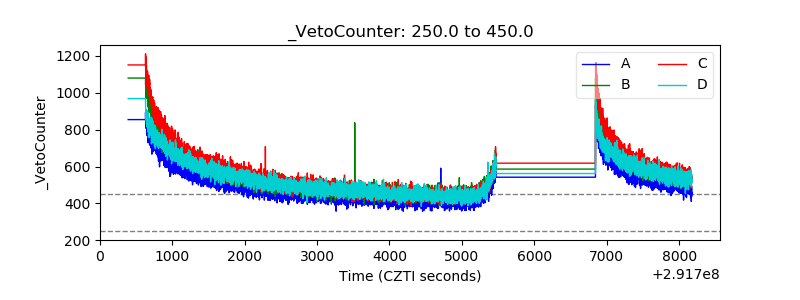 |