| Param | Original file | Final file |
|---|---|---|
| Filename | modeM0/AS1T03_090T01_9000002822_18949cztM0_level2.evt | modeM0/AS1T03_090T01_9000002822_18949cztM0_level2_quad_clean.evt |
| Size (bytes) | 756,622,080 | 99,820,800 |
| Size | 721.6 MB | 95.2 MB |
| Events in quadrant A | 6,555,328 | 602,936 |
| Events in quadrant B | 4,571,113 | 687,197 |
| Events in quadrant C | 3,098,620 | 692,746 |
| Events in quadrant D | 8,263,417 | 598,863 |
| Mode SS | |||
|---|---|---|---|
| Quadrant | BADHDUFLAG | Total packets | Discarded packets |
| A | 0 | 128 | 0 |
| B | 0 | 128 | 0 |
| C | 0 | 128 | 0 |
| D | 0 | 128 | 0 |
| Mode M9 | |||
|---|---|---|---|
| Quadrant | BADHDUFLAG | Total packets | Discarded packets |
| A | 0 | 11 | 0 |
| B | 0 | 11 | 0 |
| C | 0 | 11 | 0 |
| D | 0 | 11 | 0 |
| Mode M0 | |||
|---|---|---|---|
| Quadrant | BADHDUFLAG | Total packets | Discarded packets |
| A | 0 | 23507 | 1 |
| B | 0 | 17525 | 1 |
| C | 0 | 12995 | 1 |
| D | 0 | 28966 | 1 |
| Quadrant | Total seconds | Saturated seconds | Saturation percentage |
|---|---|---|---|
| A | 6305 | 1355 | 21.490880% |
| B | 6306 | 496 | 7.865525% |
| C | 6306 | 129 | 2.045671% |
| D | 6306 | 1718 | 27.243895% |
Noise dominated data is calculated using 1-second bins in cleaned event files. If a bin has >2000 counts, and if more than 50% of those come from <1% of pixels, then it is considered to be noise-dominated and hence unusable.
| Quadrant | # 1 sec bins | Bins with >0 counts | Bins with >2000 counts | High rate bins dominated by noise | Noise dominated (total time) | Noise dominated (detector-on time) | Marked lightcurve |
|---|---|---|---|---|---|---|---|
| A | 7345 | 6305 | 936 | 936 | 12.74% | 14.85% | 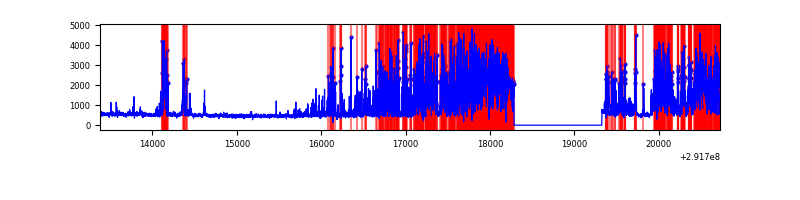 |
| B | 7346 | 6307 | 271 | 271 | 3.69% | 4.30% | 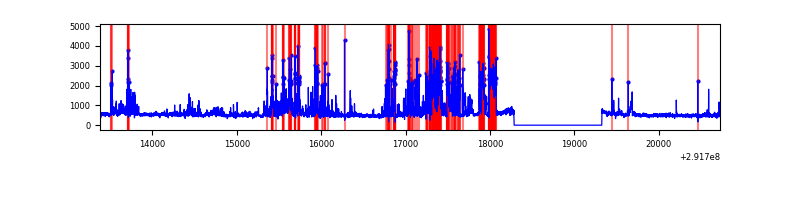 |
| C | 7346 | 6307 | 0 | 0 | 0.00% | 0.00% | 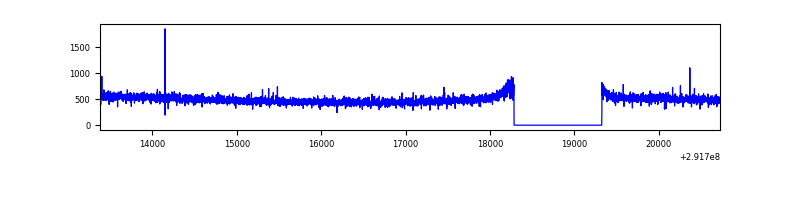 |
| D | 7346 | 6307 | 1046 | 1046 | 14.24% | 16.58% | 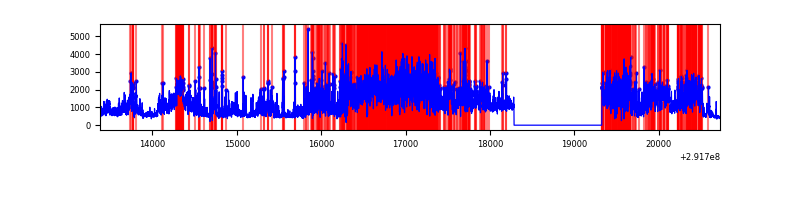 |
Top three noisy pixels from each quadrant. If the there are fewer than three noisy pixels in the level2.evt file, extra rows are filled as -1
| Pixel properties | Quadrant properties | ||||||
|---|---|---|---|---|---|---|---|
| Quadrant | DetID | PixID | Counts | Sigma | Mean | Median | Sigma |
| A | 14 | 235 | 3844884 | 27529.03 | 703 | 690 | 139.6 |
| A | 13 | 254 | 6766 | 43.51 | 703 | 690 | 139.6 |
| A | 0 | 226 | 6049 | 38.38 | 703 | 690 | 139.6 |
| B | 3 | 112 | 1337164 | 9350.64 | 768 | 748 | 142.9 |
| B | 7 | 220 | 143980 | 1002.17 | 768 | 748 | 142.9 |
| B | 0 | 189 | 60347 | 417.0 | 768 | 748 | 142.9 |
| C | 14 | 238 | 122009 | 693.3 | 762 | 769 | 174.9 |
| C | 13 | 61 | 5453 | 26.79 | 762 | 769 | 174.9 |
| C | 3 | 233 | 4137 | 19.26 | 762 | 769 | 174.9 |
| D | 7 | 238 | 4928314 | 28617.96 | 705 | 684 | 172.2 |
| D | 12 | 218 | 369113 | 2139.71 | 705 | 684 | 172.2 |
| D | 12 | 233 | 186894 | 1081.44 | 705 | 684 | 172.2 |
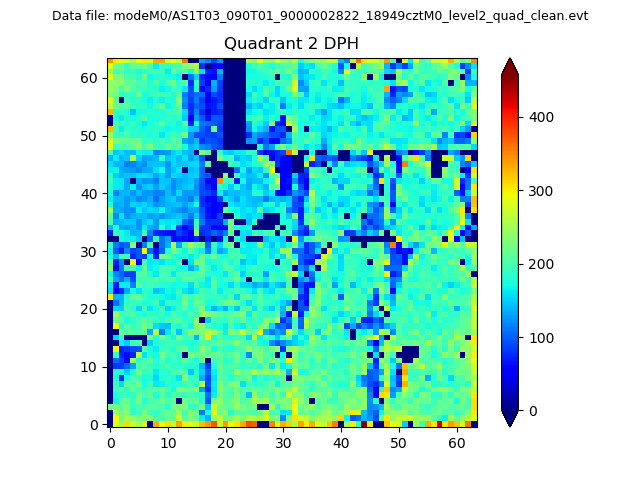
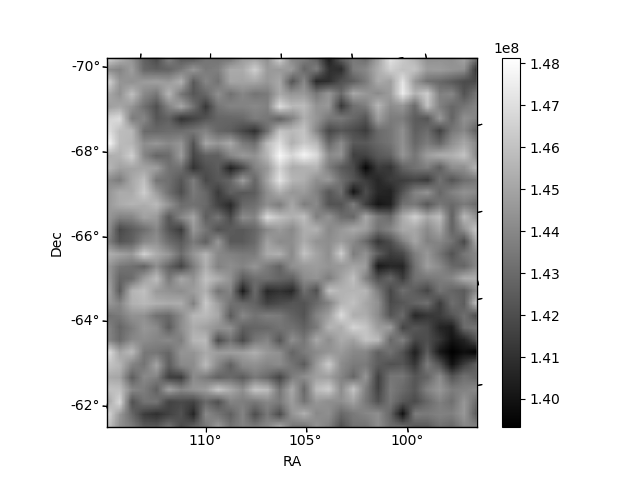
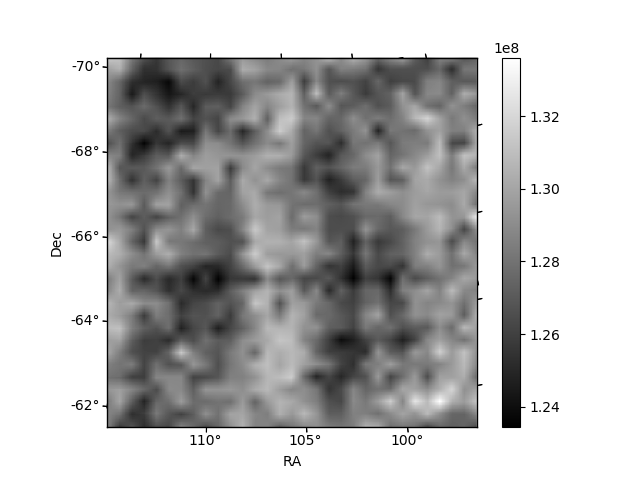
Histogram calculated using DETX and DETY for each event in the final _common_clean file
| Quadrant A | 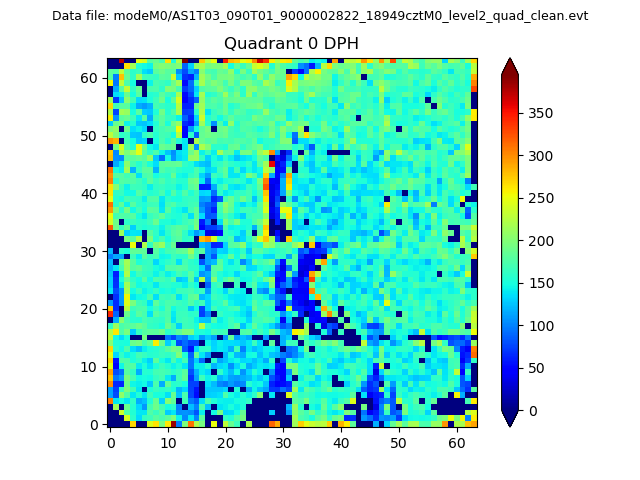 |
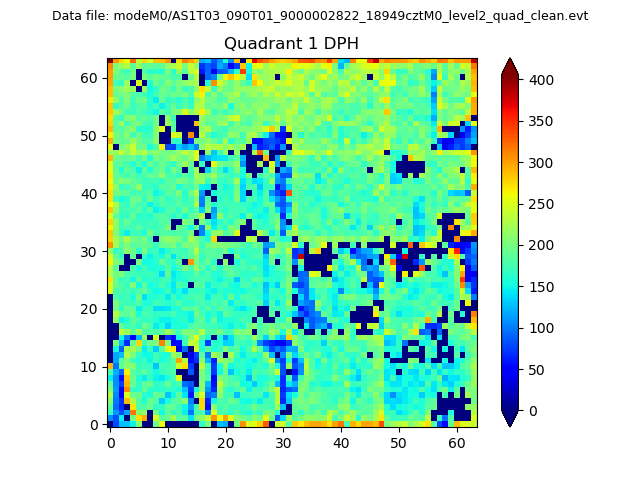 |
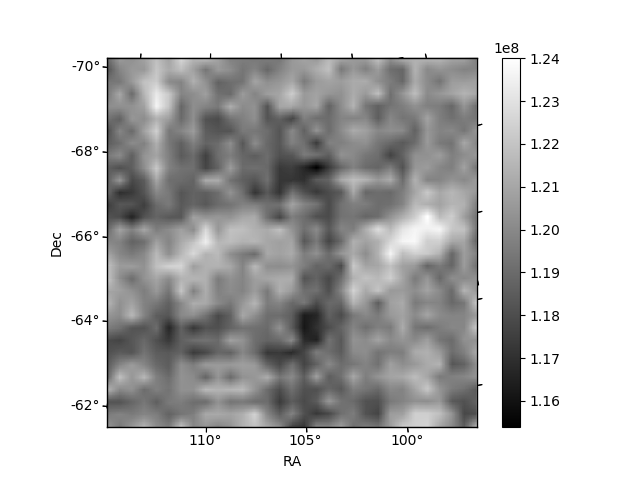
Quadrant B |
|---|---|---|---|
| Quadrant D | 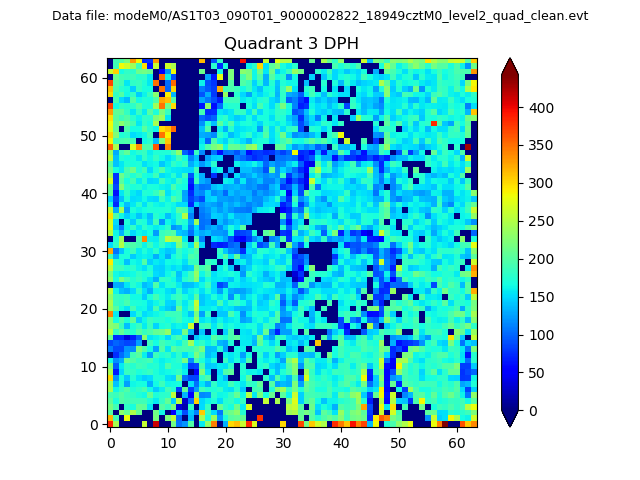 |
 |
Quadrant C |
| Plot type | Count rate plots | Images |
|---|---|---|
| Comparison with Poisson distribution Blue bars denote a histogram of data divided into 1 sec bins. Red curve is a Poisson curve with rate = median count rate of data. |
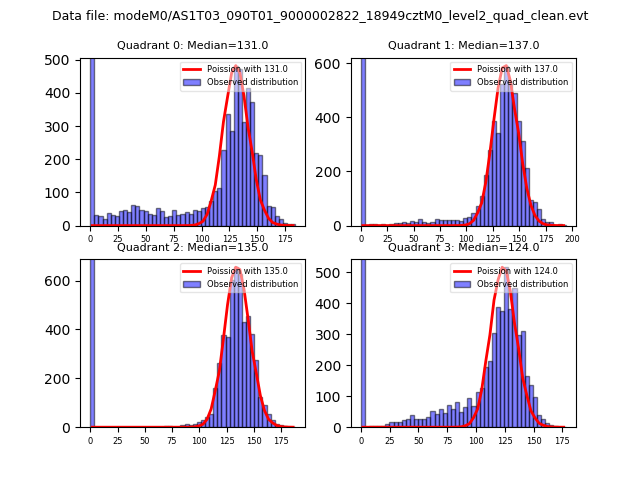 |
 |
| Quadrant-wise count rates Data is divided into 100 sec bins |
 |
|
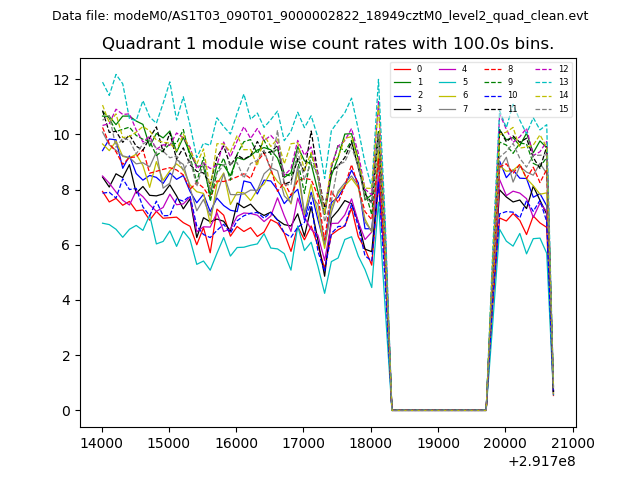
| Module-wise count rates for Quadrant A Data is divided into 100 sec bins |
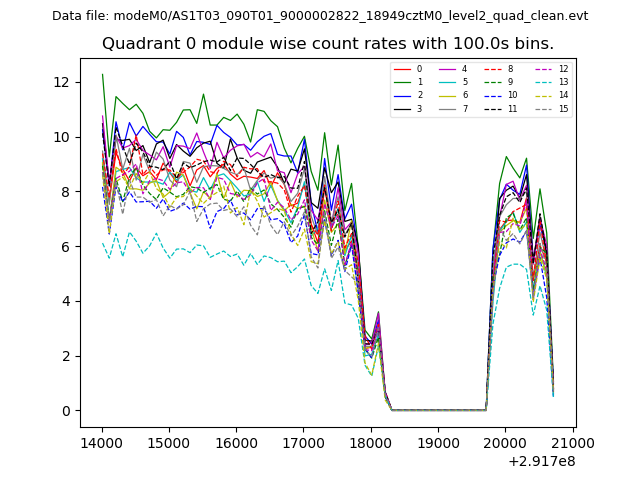 |
 |
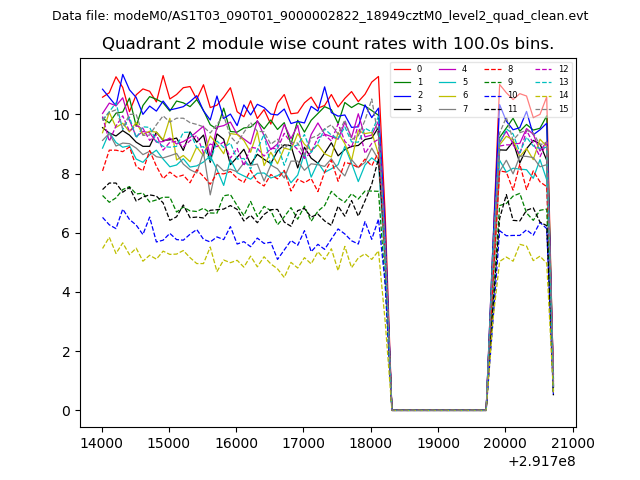
| Module-wise count rates for Quadrant B Data is divided into 100 sec bins |
 |
 |
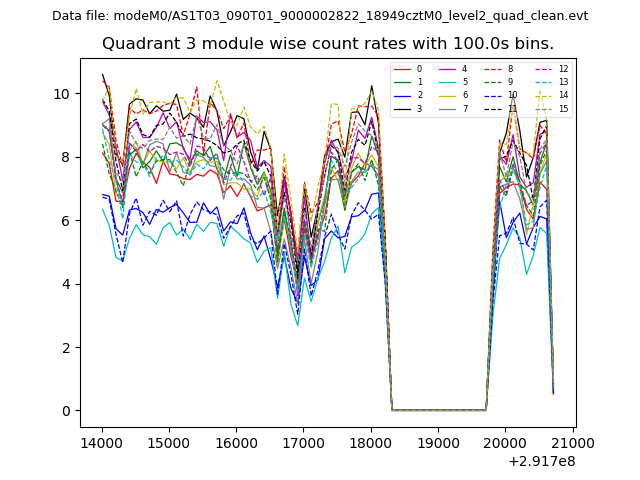
| Module-wise count rates for Quadrant C Data is divided into 100 sec bins |
 |
 |
| Module-wise count rates for Quadrant D Data is divided into 100 sec bins |
 |
 |
| Parameter | Plot |
|---|---|
| CZT HV Monitor | 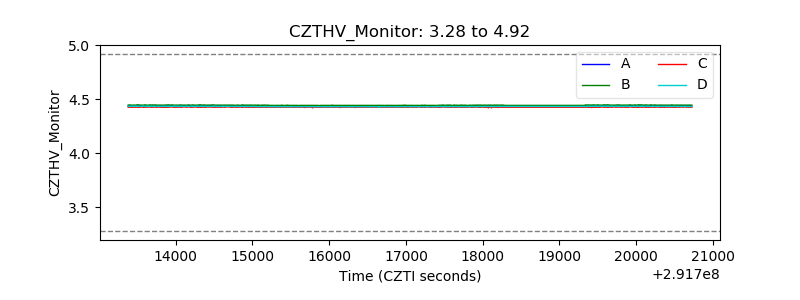 |
| D_VDD | 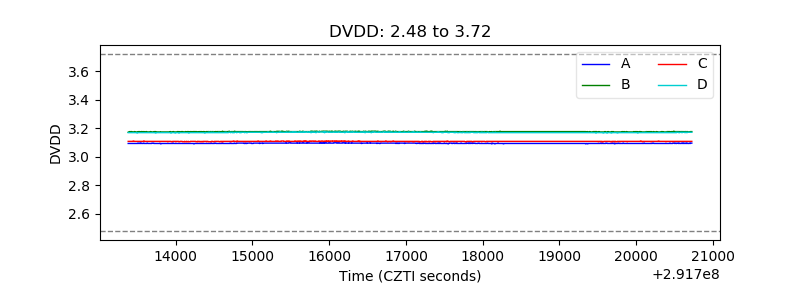 |
| Temperature 1 | 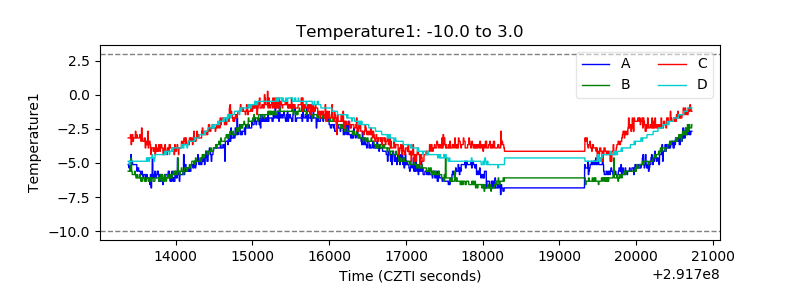 |
| Veto HV Monitor |  |
| Veto LLD | 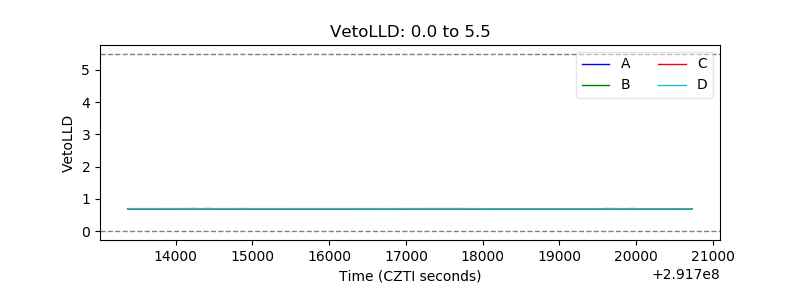 |
| Alpha Counter |  |
| _CPM_Rate |  |
| CZT Counter | 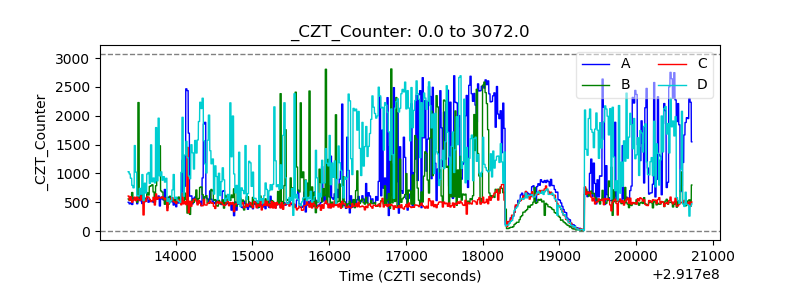 |
| +2.5 Volts monitor |  |
| +5 Volts monitor |  |
| _ROLL_ROT | 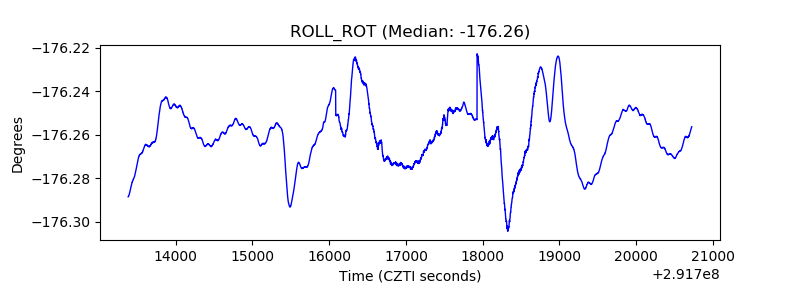 |
| _Roll_DEC | 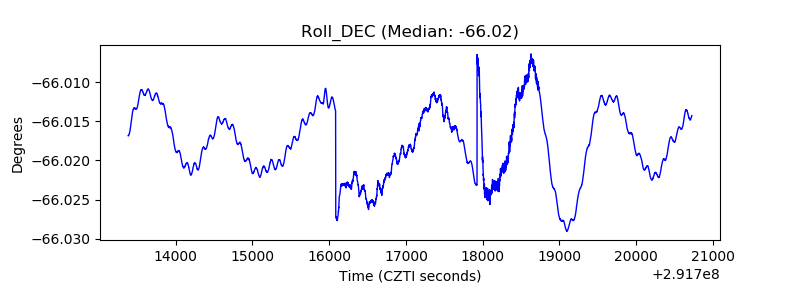 |
| _Roll_RA | 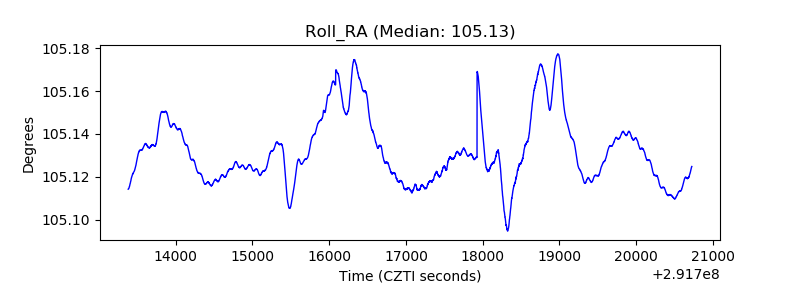 |
| Veto Counter | 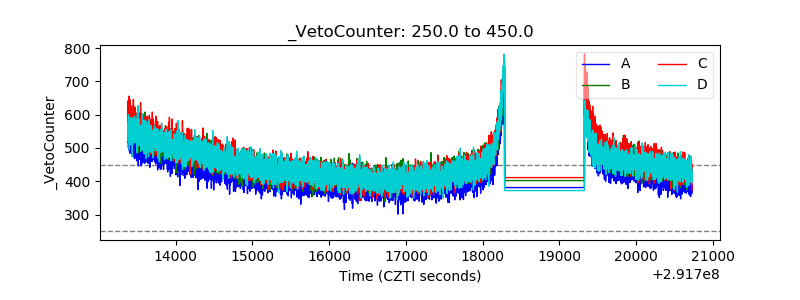 |