| Param | Original file | Final file |
|---|---|---|
| Filename | modeM0/AS1T03_090T01_9000002822_18950cztM0_level2.evt | modeM0/AS1T03_090T01_9000002822_18950cztM0_level2_quad_clean.evt |
| Size (bytes) | 824,728,320 | 105,972,480 |
| Size | 786.5 MB | 101.1 MB |
| Events in quadrant A | 11,580,408 | 521,076 |
| Events in quadrant B | 4,556,508 | 750,736 |
| Events in quadrant C | 3,240,640 | 745,347 |
| Events in quadrant D | 5,134,810 | 711,793 |
| Mode SS | |||
|---|---|---|---|
| Quadrant | BADHDUFLAG | Total packets | Discarded packets |
| A | 0 | 140 | 0 |
| B | 0 | 140 | 0 |
| C | 0 | 140 | 0 |
| D | 0 | 140 | 0 |
| Mode M9 | |||
|---|---|---|---|
| Quadrant | BADHDUFLAG | Total packets | Discarded packets |
| A | 0 | 6 | 0 |
| B | 0 | 6 | 0 |
| C | 0 | 6 | 0 |
| D | 0 | 6 | 0 |
| Mode M0 | |||
|---|---|---|---|
| Quadrant | BADHDUFLAG | Total packets | Discarded packets |
| A | 0 | 39132 | 8 |
| B | 0 | 17895 | 1 |
| C | 0 | 14050 | 1 |
| D | 0 | 19861 | 1 |
| Quadrant | Total seconds | Saturated seconds | Saturation percentage |
|---|---|---|---|
| A | 6871 | 3549 | 51.651870% |
| B | 6871 | 333 | 4.846456% |
| C | 6872 | 126 | 1.833527% |
| D | 6872 | 519 | 7.552386% |
Noise dominated data is calculated using 1-second bins in cleaned event files. If a bin has >2000 counts, and if more than 50% of those come from <1% of pixels, then it is considered to be noise-dominated and hence unusable.
| Quadrant | # 1 sec bins | Bins with >0 counts | Bins with >2000 counts | High rate bins dominated by noise | Noise dominated (total time) | Noise dominated (detector-on time) | Marked lightcurve |
|---|---|---|---|---|---|---|---|
| A | 7516 | 6872 | 2613 | 2613 | 34.77% | 38.02% | 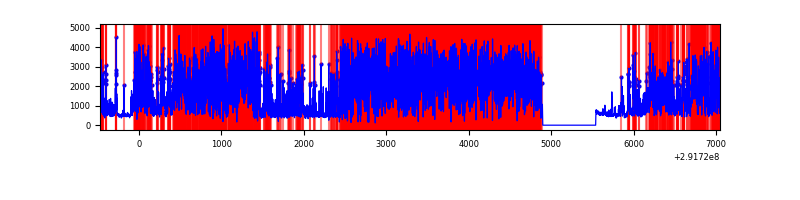 |
| B | 7516 | 6872 | 178 | 178 | 2.37% | 2.59% | 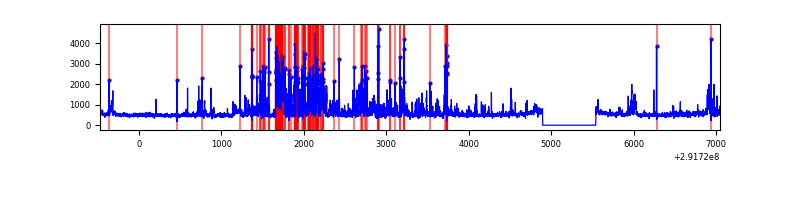 |
| C | 7517 | 6873 | 0 | 0 | 0.00% | 0.00% | 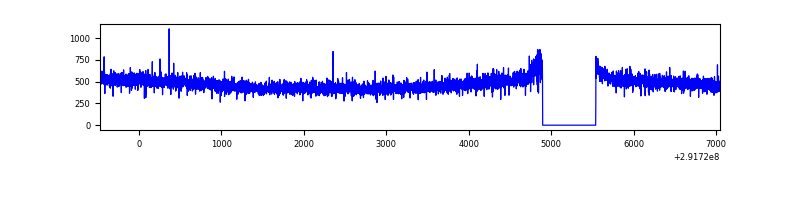 |
| D | 7517 | 6873 | 247 | 247 | 3.29% | 3.59% | 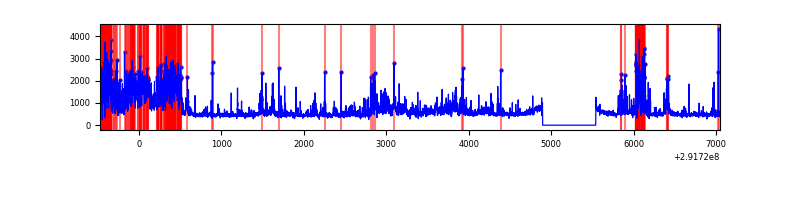 |
Top three noisy pixels from each quadrant. If the there are fewer than three noisy pixels in the level2.evt file, extra rows are filled as -1
| Pixel properties | Quadrant properties | ||||||
|---|---|---|---|---|---|---|---|
| Quadrant | DetID | PixID | Counts | Sigma | Mean | Median | Sigma |
| A | 14 | 235 | 9222730 | 75297.77 | 608 | 595 | 122.5 |
| A | 3 | 0 | 8288 | 62.81 | 608 | 595 | 122.5 |
| A | 13 | 254 | 5890 | 43.23 | 608 | 595 | 122.5 |
| B | 3 | 112 | 1107691 | 7251.8 | 814 | 794 | 152.6 |
| B | 0 | 189 | 115857 | 753.83 | 814 | 794 | 152.6 |
| B | 7 | 220 | 83211 | 539.95 | 814 | 794 | 152.6 |
| C | 14 | 238 | 126107 | 681.71 | 796 | 801 | 183.8 |
| C | 13 | 61 | 5670 | 26.49 | 796 | 801 | 183.8 |
| C | 8 | 128 | 4860 | 22.08 | 796 | 801 | 183.8 |
| D | 7 | 238 | 1575210 | 8269.47 | 794 | 768 | 190.4 |
| D | 12 | 218 | 252771 | 1323.6 | 794 | 768 | 190.4 |
| D | 1 | 52 | 93091 | 484.91 | 794 | 768 | 190.4 |
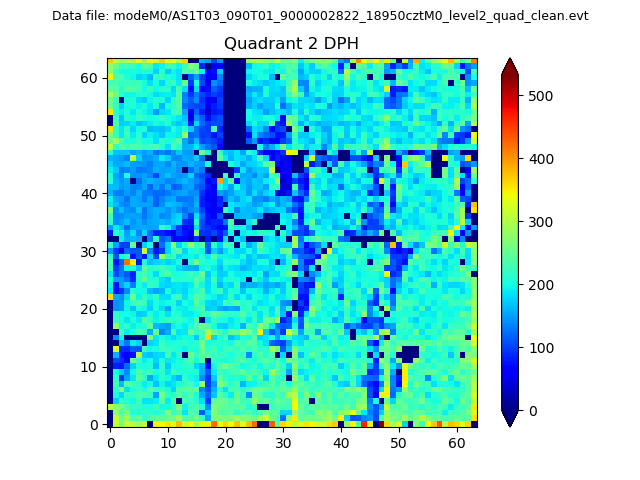
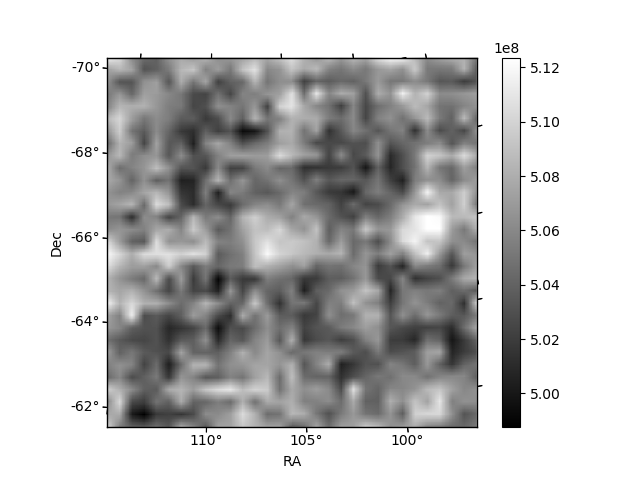
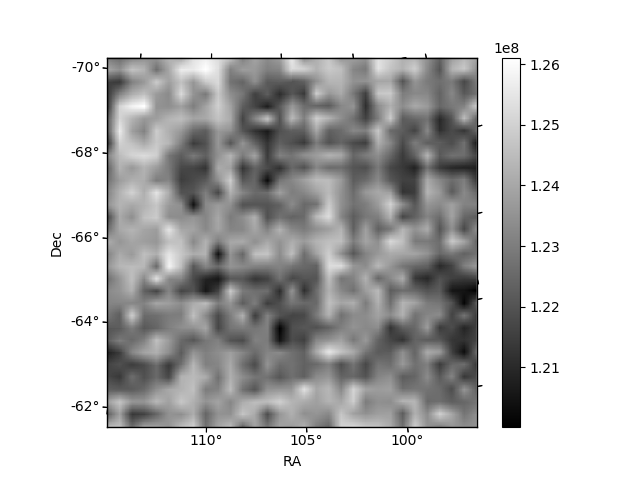
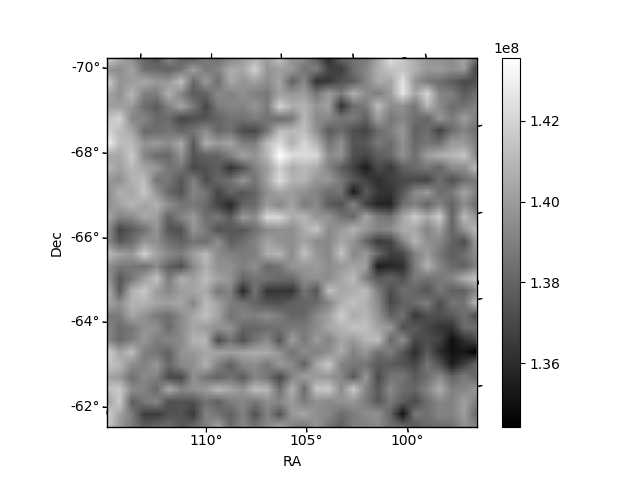
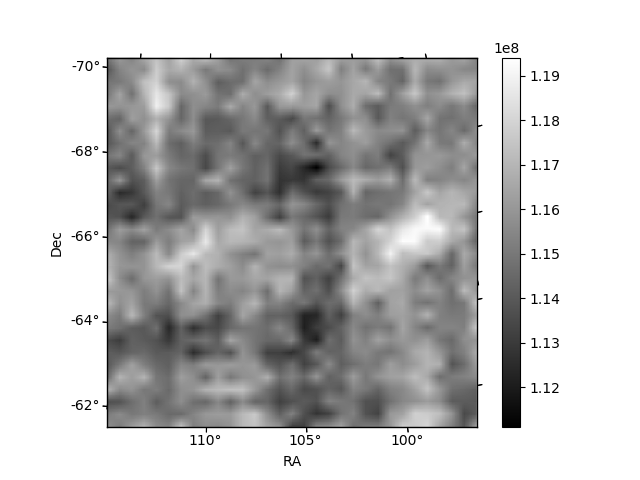
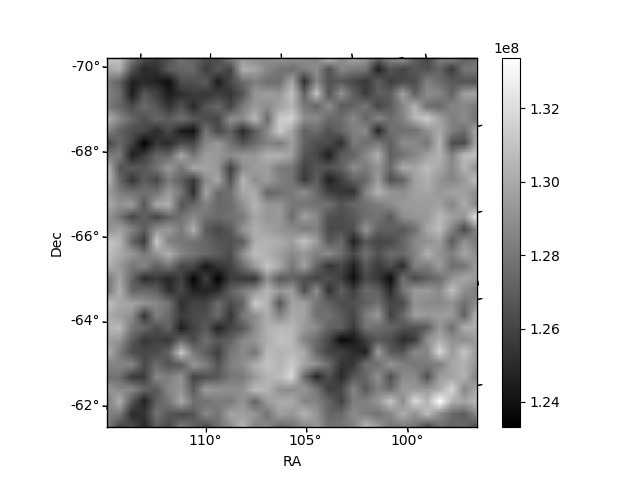
Histogram calculated using DETX and DETY for each event in the final _common_clean file
| Quadrant A | 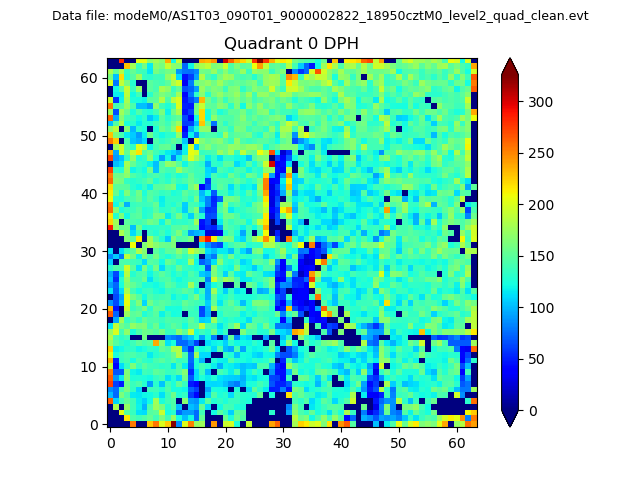 |
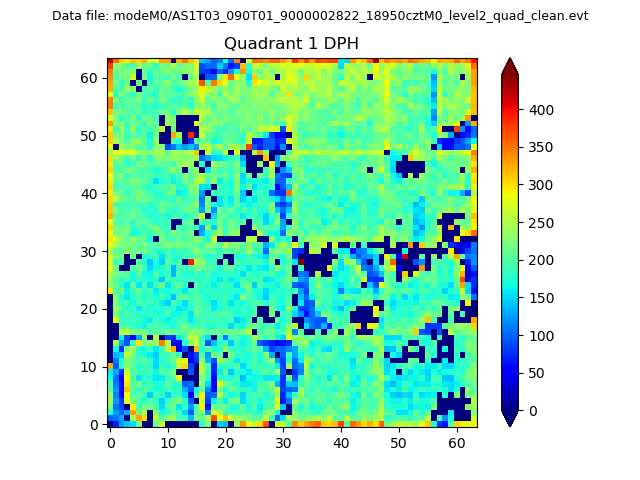 |
Quadrant B |
|---|---|---|---|
| Quadrant D | 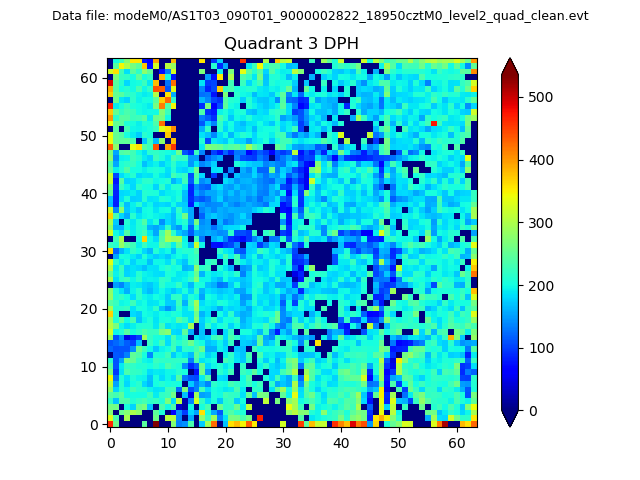 |
 |
Quadrant C |
| Plot type | Count rate plots | Images |
|---|---|---|
| Comparison with Poisson distribution Blue bars denote a histogram of data divided into 1 sec bins. Red curve is a Poisson curve with rate = median count rate of data. |
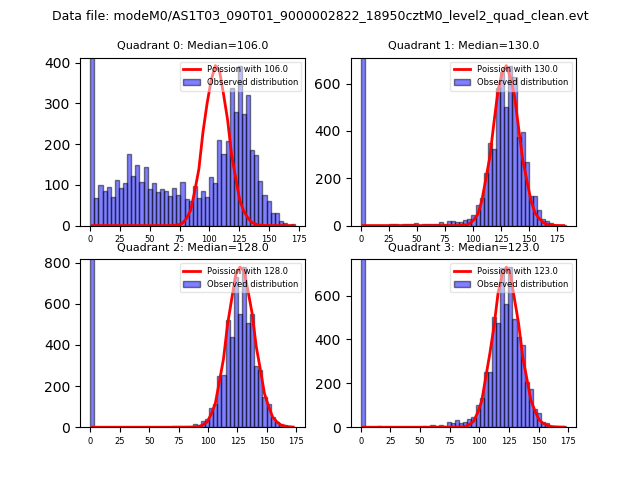 |
 |
| Quadrant-wise count rates Data is divided into 100 sec bins |
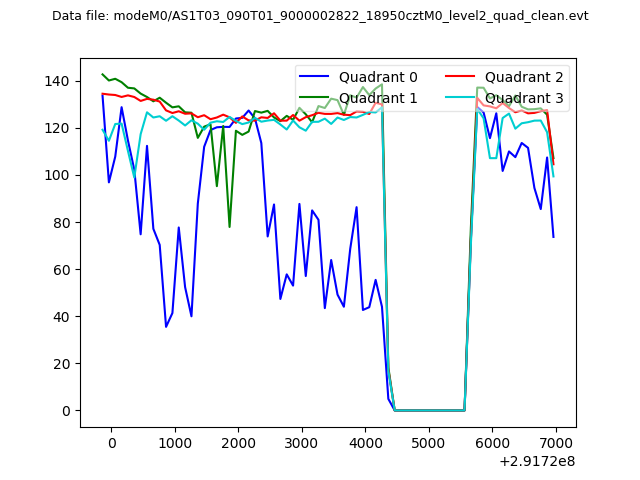 |
|
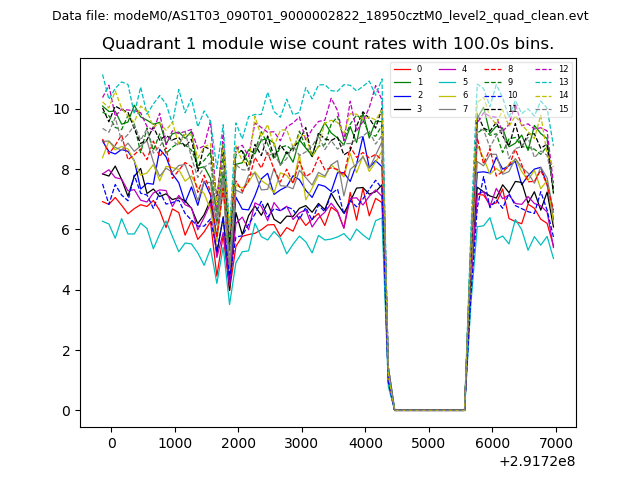
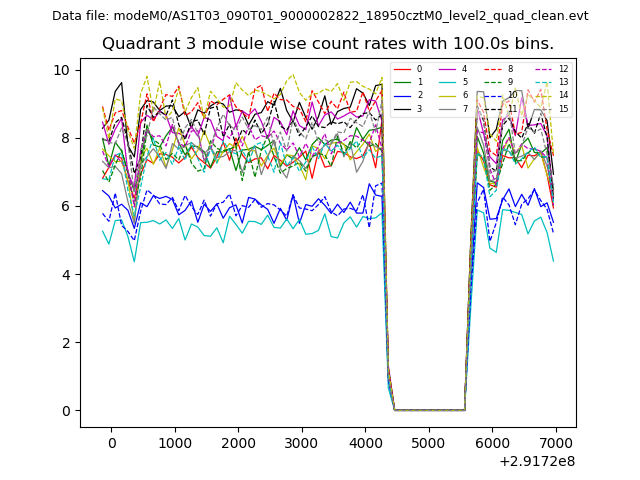
| Module-wise count rates for Quadrant A Data is divided into 100 sec bins |
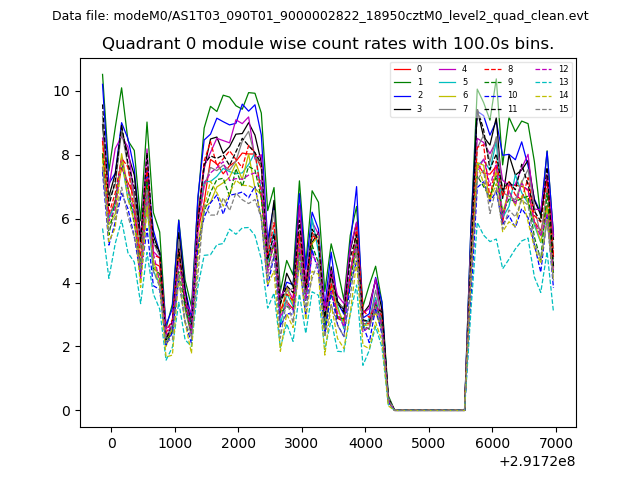 |
 |
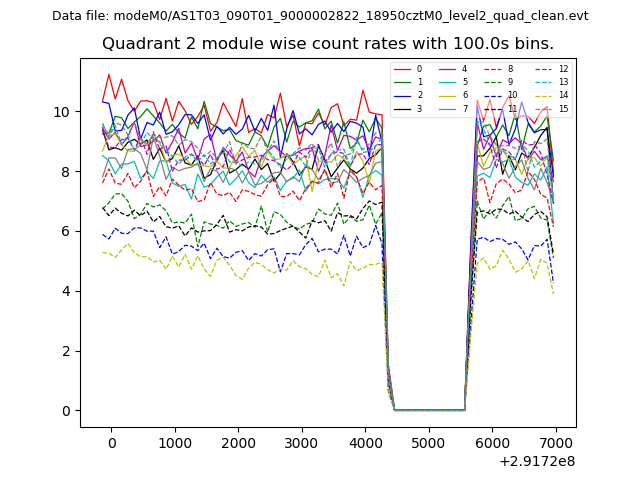
| Module-wise count rates for Quadrant B Data is divided into 100 sec bins |
 |
 |
| Module-wise count rates for Quadrant C Data is divided into 100 sec bins |
 |
 |
| Module-wise count rates for Quadrant D Data is divided into 100 sec bins |
 |
 |
| Parameter | Plot |
|---|---|
| CZT HV Monitor | 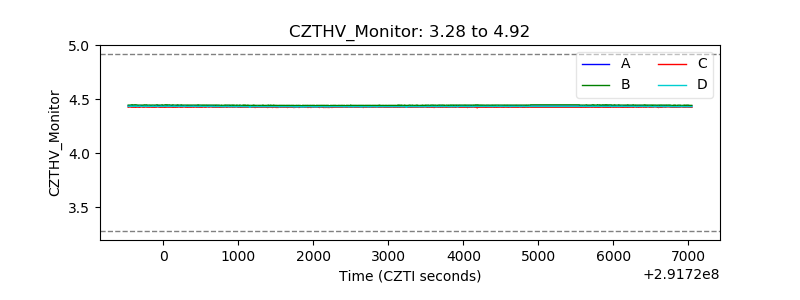 |
| D_VDD | 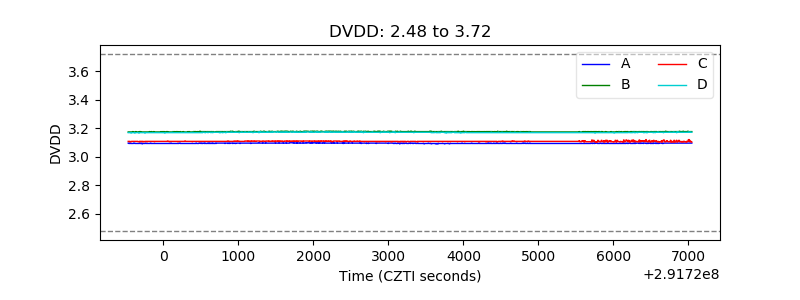 |
| Temperature 1 | 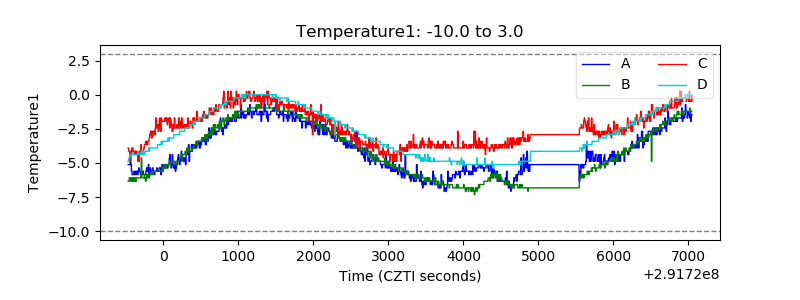 |
| Veto HV Monitor | 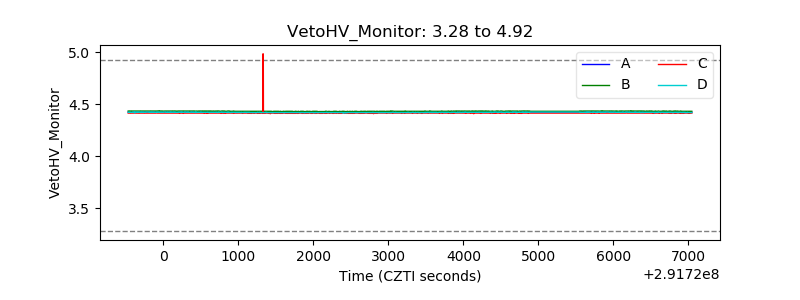 |
| Veto LLD |  |
| Alpha Counter |  |
| _CPM_Rate | 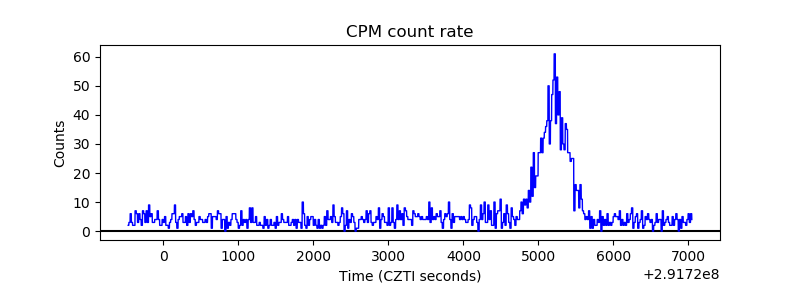 |
| CZT Counter | 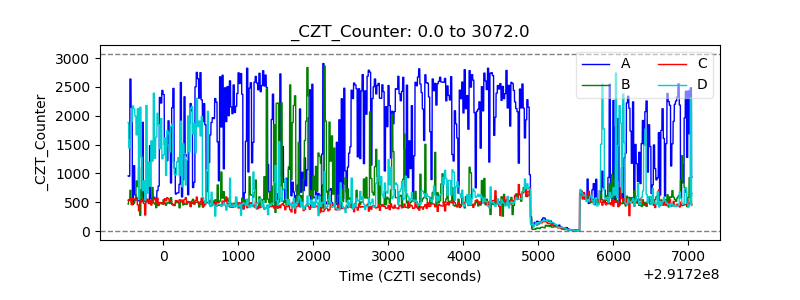 |
| +2.5 Volts monitor |  |
| +5 Volts monitor |  |
| _ROLL_ROT | 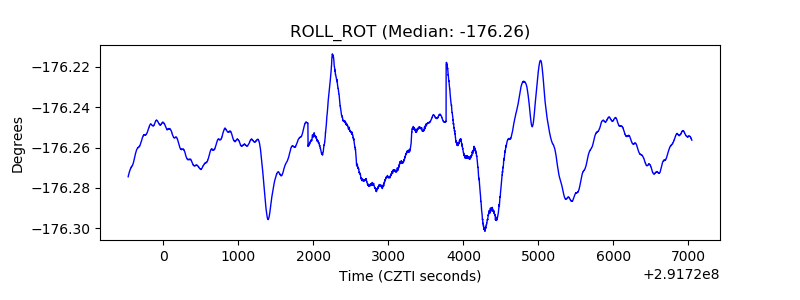 |
| _Roll_DEC | 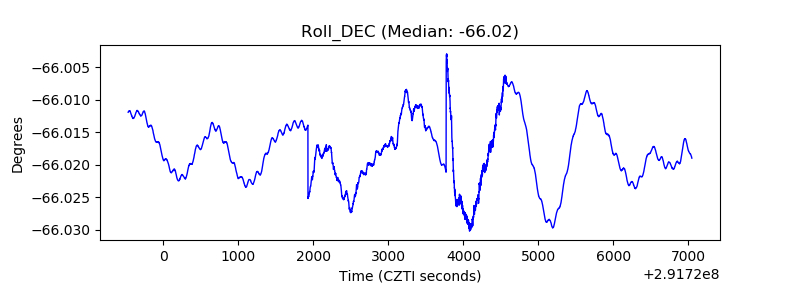 |
| _Roll_RA | 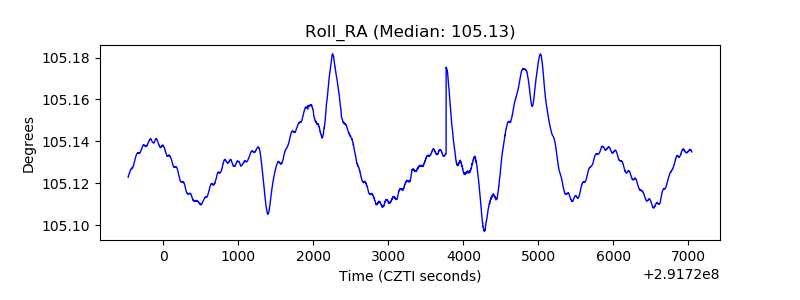 |
| Veto Counter | 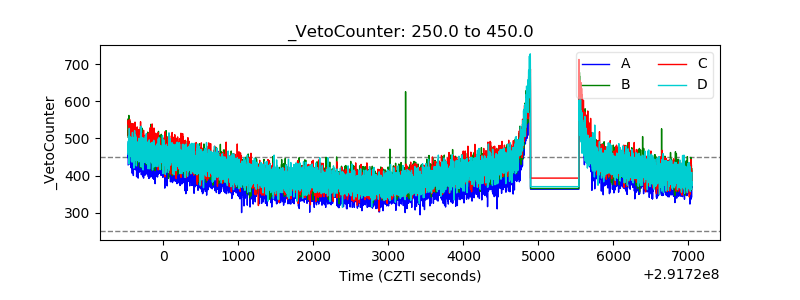 |