| Param | Original file | Final file |
|---|---|---|
| Filename | modeM0/AS1T03_090T01_9000002822_18951cztM0_level2.evt | modeM0/AS1T03_090T01_9000002822_18951cztM0_level2_quad_clean.evt |
| Size (bytes) | 230,803,200 | 43,047,360 |
| Size | 220.1 MB | 41.1 MB |
| Events in quadrant A | 2,874,826 | 257,872 |
| Events in quadrant B | 1,478,285 | 297,289 |
| Events in quadrant C | 1,048,113 | 292,534 |
| Events in quadrant D | 1,424,059 | 282,975 |
| Mode SS | |||
|---|---|---|---|
| Quadrant | BADHDUFLAG | Total packets | Discarded packets |
| A | 0 | 48 | 0 |
| B | 0 | 48 | 0 |
| C | 0 | 48 | 0 |
| D | 0 | 48 | 0 |
| Mode M0 | |||
|---|---|---|---|
| Quadrant | BADHDUFLAG | Total packets | Discarded packets |
| A | 0 | 10193 | 0 |
| B | 0 | 5926 | 0 |
| C | 0 | 4795 | 0 |
| D | 0 | 5863 | 0 |
| Quadrant | Total seconds | Saturated seconds | Saturation percentage |
|---|---|---|---|
| A | 2394 | 634 | 26.482874% |
| B | 2395 | 45 | 1.878914% |
| C | 2395 | 5 | 0.208768% |
| D | 2395 | 85 | 3.549061% |
Noise dominated data is calculated using 1-second bins in cleaned event files. If a bin has >2000 counts, and if more than 50% of those come from <1% of pixels, then it is considered to be noise-dominated and hence unusable.
| Quadrant | # 1 sec bins | Bins with >0 counts | Bins with >2000 counts | High rate bins dominated by noise | Noise dominated (total time) | Noise dominated (detector-on time) | Marked lightcurve |
|---|---|---|---|---|---|---|---|
| A | 2394 | 2394 | 419 | 419 | 17.50% | 17.50% | 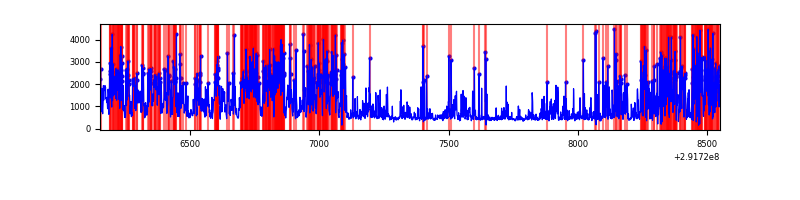 |
| B | 2395 | 2395 | 30 | 30 | 1.25% | 1.25% | 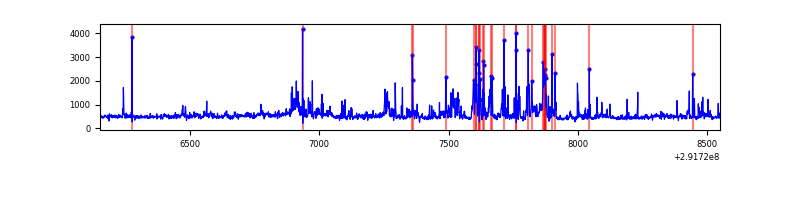 |
| C | 2395 | 2395 | 0 | 0 | 0.00% | 0.00% | 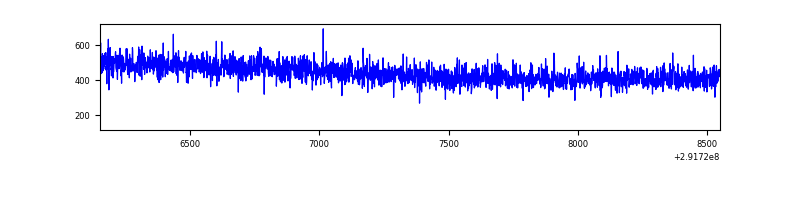 |
| D | 2395 | 2395 | 65 | 65 | 2.71% | 2.71% | 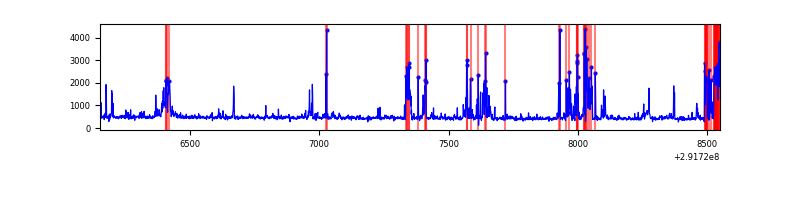 |
Top three noisy pixels from each quadrant. If the there are fewer than three noisy pixels in the level2.evt file, extra rows are filled as -1
| Pixel properties | Quadrant properties | ||||||
|---|---|---|---|---|---|---|---|
| Quadrant | DetID | PixID | Counts | Sigma | Mean | Median | Sigma |
| A | 14 | 235 | 1930972 | 37917.12 | 244 | 240 | 50.9 |
| A | 0 | 226 | 2148 | 37.47 | 244 | 240 | 50.9 |
| A | 12 | 194 | 1905 | 32.7 | 244 | 240 | 50.9 |
| B | 3 | 112 | 320901 | 6050.67 | 267 | 261 | 53.0 |
| B | 0 | 189 | 60726 | 1141.01 | 267 | 261 | 53.0 |
| B | 3 | 64 | 19598 | 364.9 | 267 | 261 | 53.0 |
| C | 14 | 238 | 39953 | 648.09 | 256 | 256 | 61.3 |
| C | 8 | 128 | 4410 | 67.82 | 256 | 256 | 61.3 |
| C | 8 | 112 | 2305 | 33.45 | 256 | 256 | 61.3 |
| D | 12 | 233 | 110850 | 1725.02 | 262 | 255 | 64.1 |
| D | 7 | 238 | 85281 | 1326.2 | 262 | 255 | 64.1 |
| D | 12 | 218 | 74386 | 1156.27 | 262 | 255 | 64.1 |
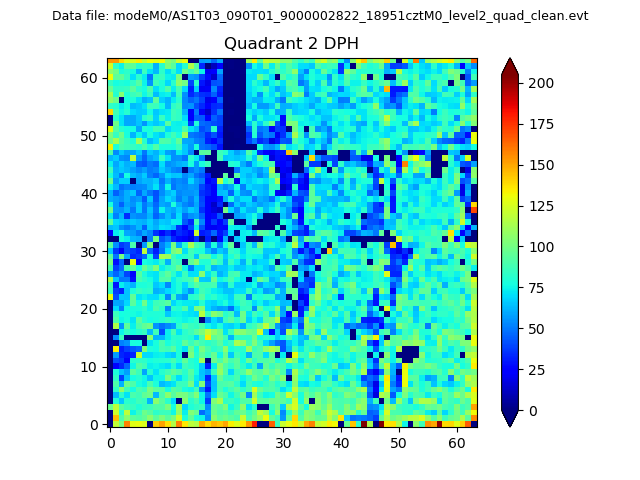
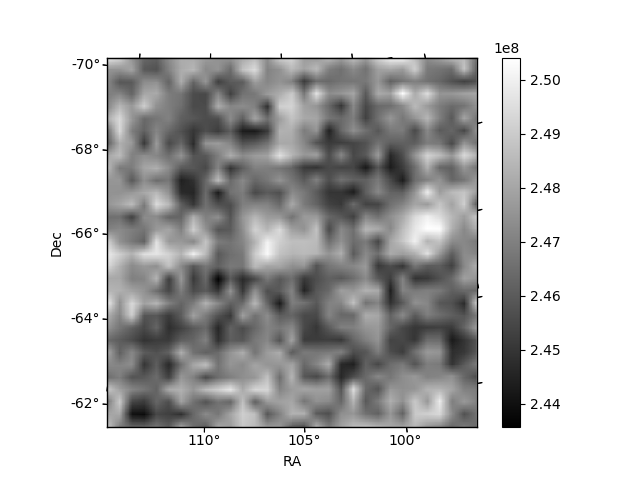
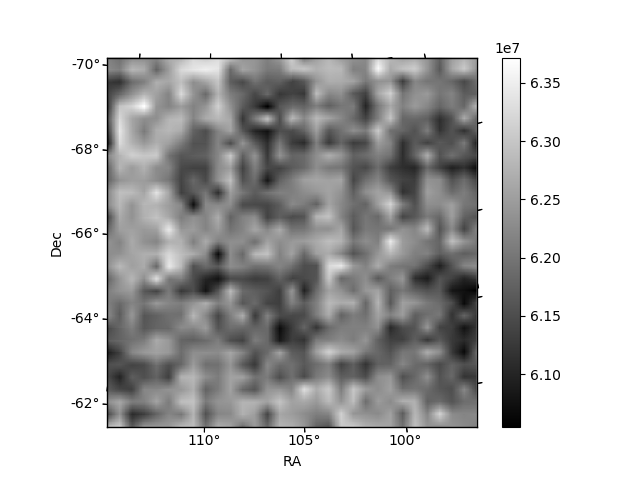
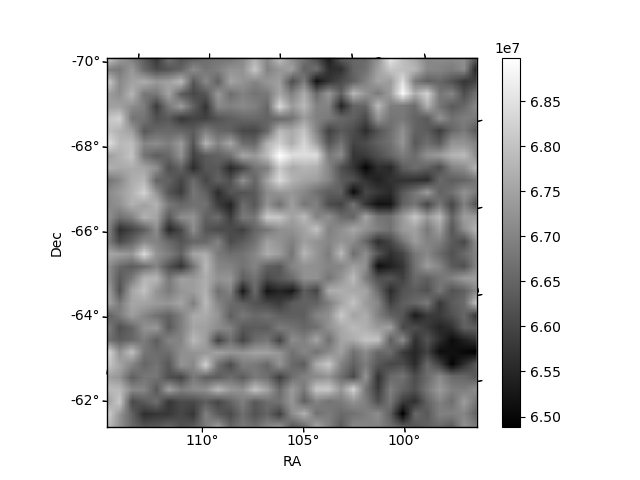
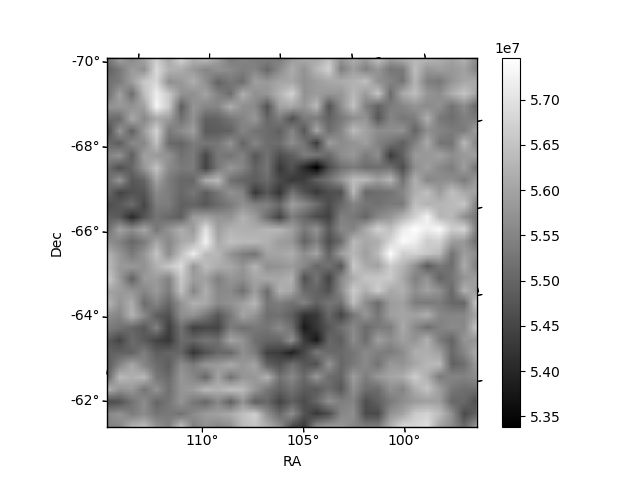
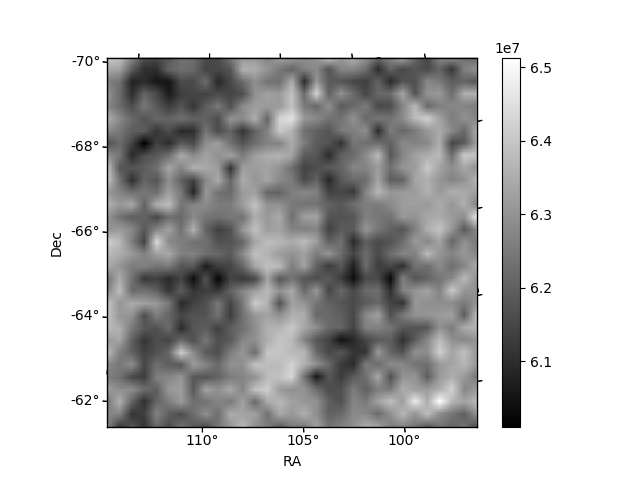
Histogram calculated using DETX and DETY for each event in the final _common_clean file
| Quadrant A | 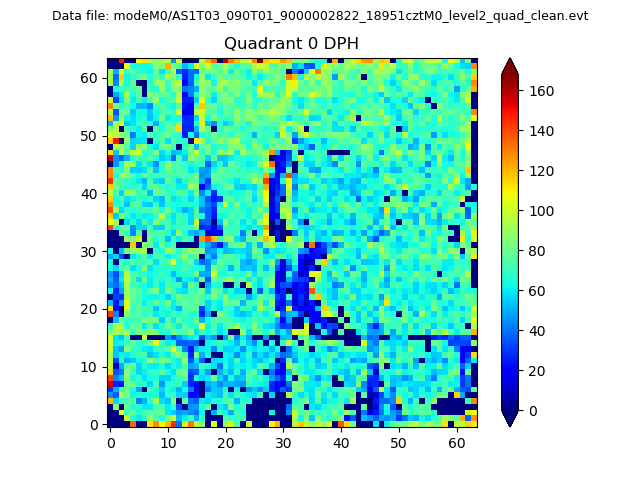 |
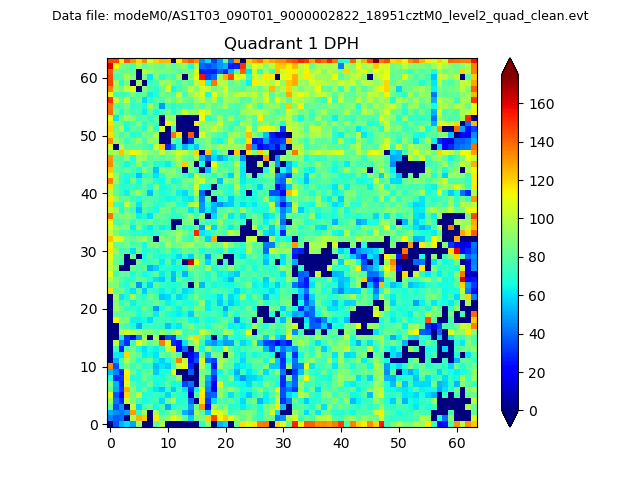 |
Quadrant B |
|---|---|---|---|
| Quadrant D | 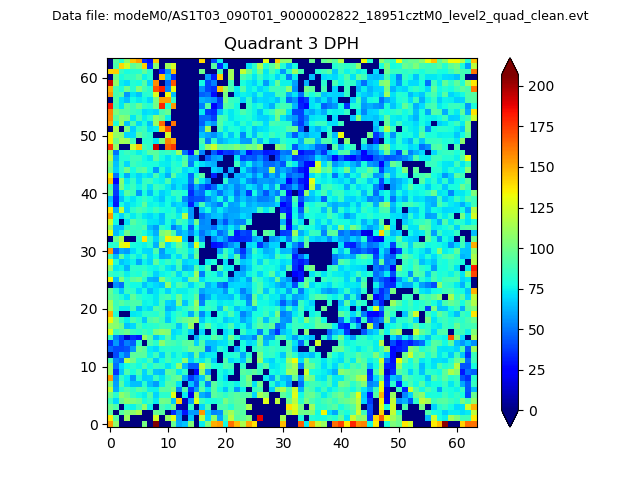 |
 |
Quadrant C |
| Plot type | Count rate plots | Images |
|---|---|---|
| Comparison with Poisson distribution Blue bars denote a histogram of data divided into 1 sec bins. Red curve is a Poisson curve with rate = median count rate of data. |
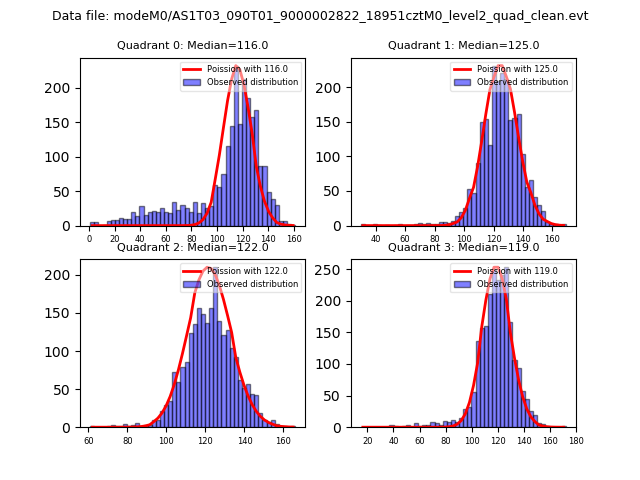 |
 |
| Quadrant-wise count rates Data is divided into 100 sec bins |
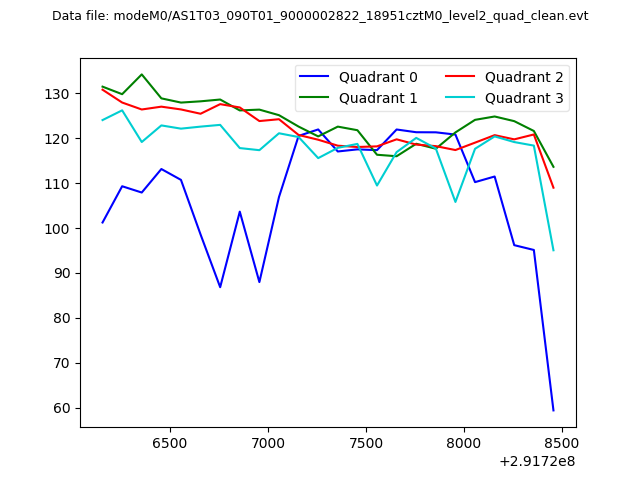 |
|
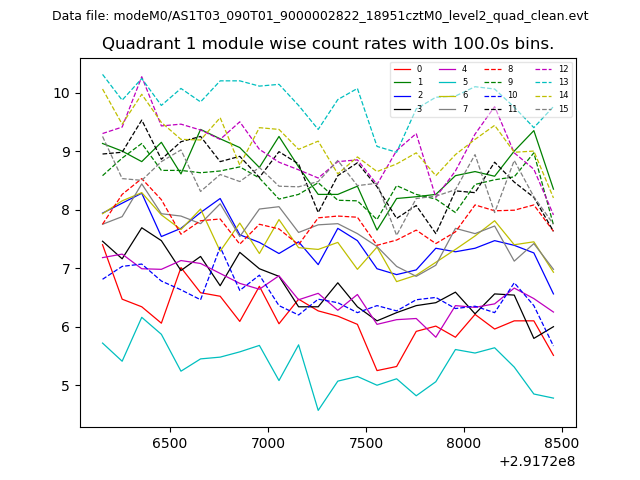
| Module-wise count rates for Quadrant A Data is divided into 100 sec bins |
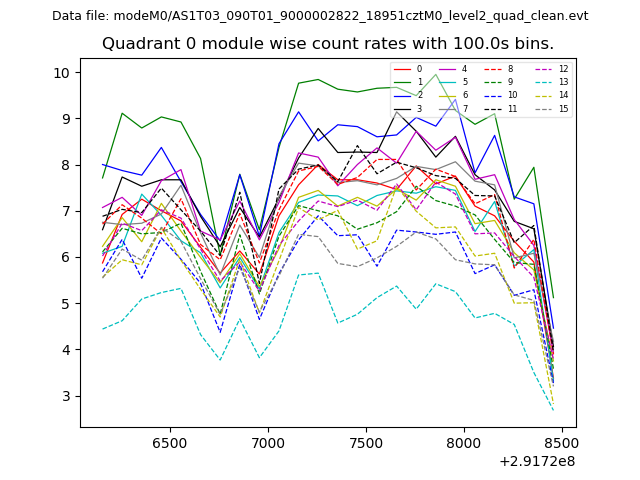 |
 |
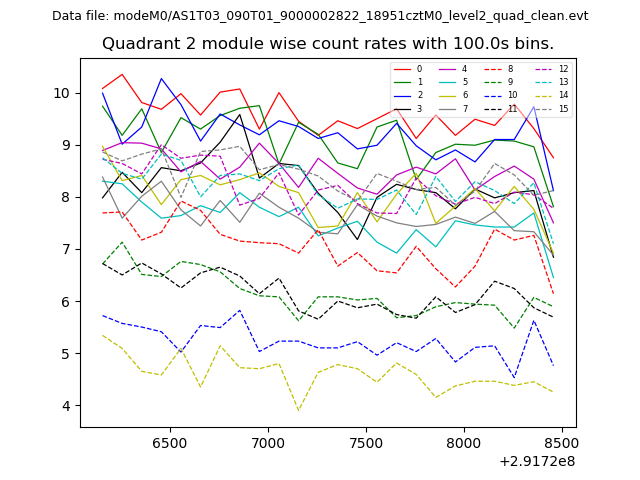
| Module-wise count rates for Quadrant B Data is divided into 100 sec bins |
 |
 |
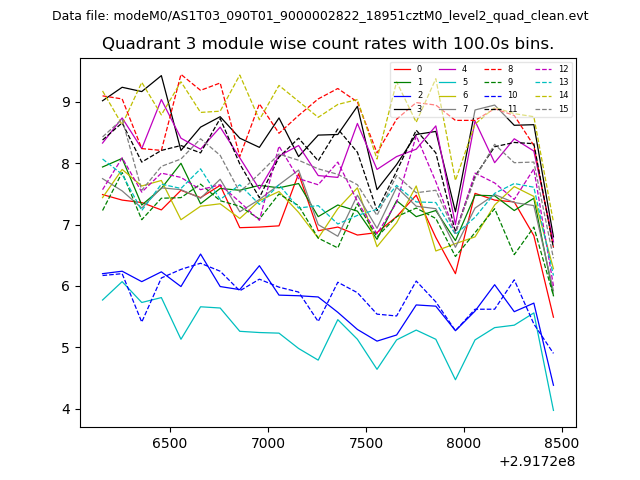
| Module-wise count rates for Quadrant C Data is divided into 100 sec bins |
 |
 |
| Module-wise count rates for Quadrant D Data is divided into 100 sec bins |
 |
 |
| Parameter | Plot |
|---|---|
| CZT HV Monitor | 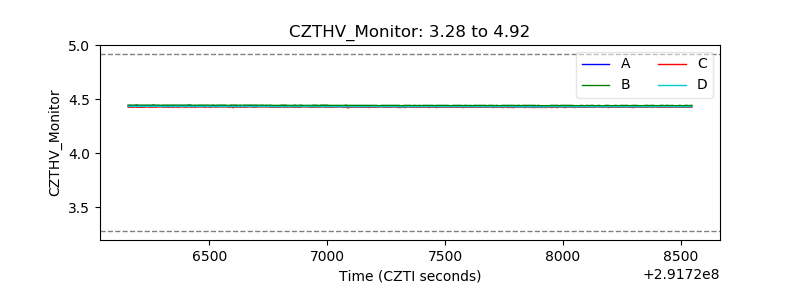 |
| D_VDD | 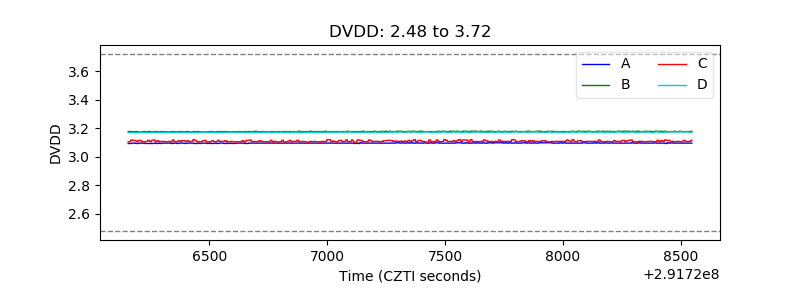 |
| Temperature 1 | 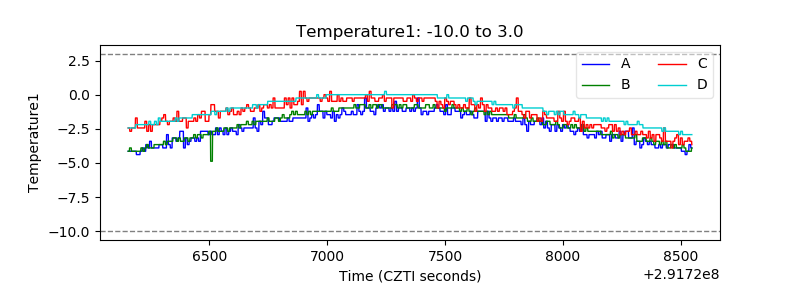 |
| Veto HV Monitor | 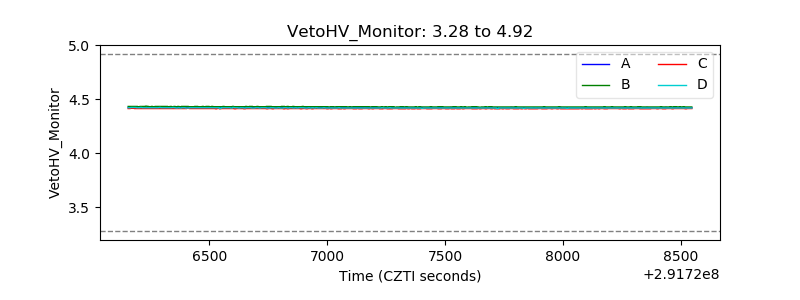 |
| Veto LLD | 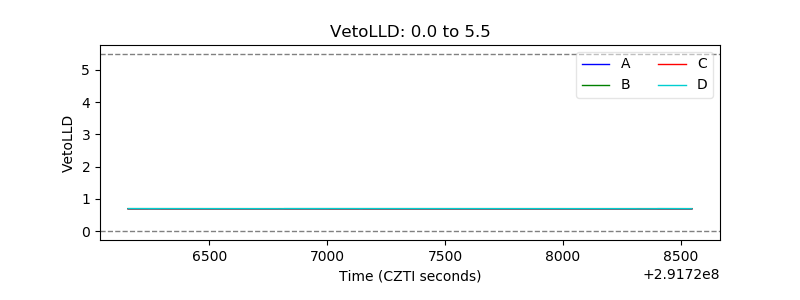 |
| Alpha Counter | 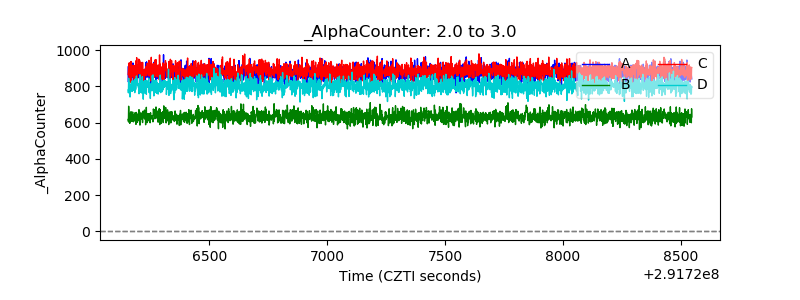 |
| _CPM_Rate | 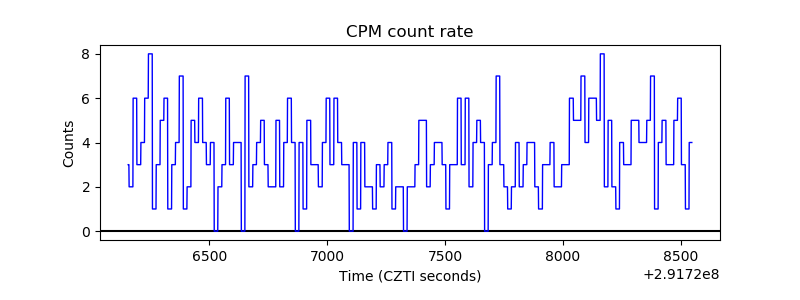 |
| CZT Counter | 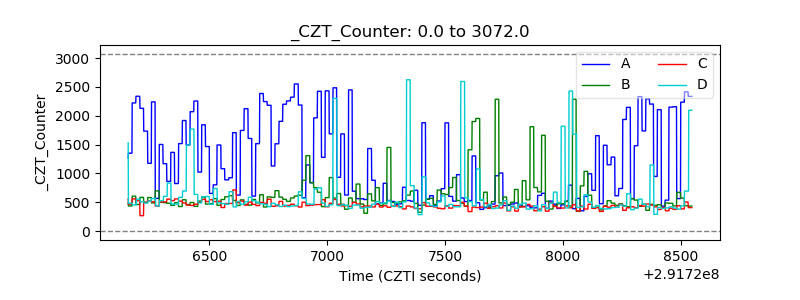 |
| +2.5 Volts monitor |  |
| +5 Volts monitor |  |
| _ROLL_ROT | 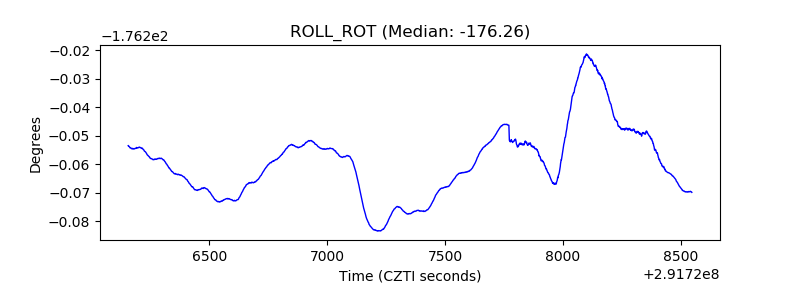 |
| _Roll_DEC | 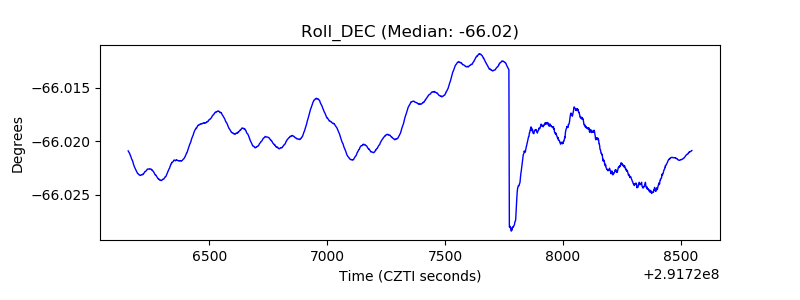 |
| _Roll_RA | 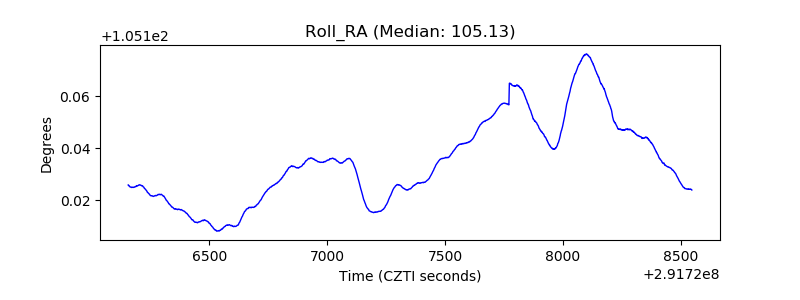 |
| Veto Counter |  |