| Param | Original file | Final file |
|---|---|---|
| Filename | modeM0/AS1A05_205T01_9000002824cztM0_level2.fits | modeM0/AS1A05_205T01_9000002824cztM0_level2_quad_clean.evt |
| Size (bytes) | 1,034,602,560 | 959,250,240 |
| Size | 986.7 MB | 914.8 MB |
| Events in quadrant A | 6,181,554 | 5,398,359 |
| Events in quadrant B | 5,986,216 | 5,713,298 |
| Events in quadrant C | 6,372,730 | 5,605,875 |
| Events in quadrant D | 5,318,566 | 4,869,094 |
| Mode M9 | |||
|---|---|---|---|
| Quadrant | BADHDUFLAG | Total packets | Discarded packets |
| A | 0 | 151 | 0 |
| B | 0 | 151 | 0 |
| C | 0 | 151 | 0 |
| D | 0 | 151 | 0 |
| Mode SS | |||
|---|---|---|---|
| Quadrant | BADHDUFLAG | Total packets | Discarded packets |
| A | 0 | 2220 | 0 |
| B | 0 | 2220 | 0 |
| C | 0 | 2220 | 0 |
| D | 0 | 2220 | 0 |
| Mode M0 | |||
|---|---|---|---|
| Quadrant | BADHDUFLAG | Total packets | Discarded packets |
| A | 0 | 280438 | 0 |
| B | 0 | 290102 | 0 |
| C | 0 | 226233 | 0 |
| D | 0 | 329982 | 0 |
| Quadrant | Total seconds | Saturated seconds | Saturation percentage |
|---|---|---|---|
| A | 108899 | 8392 | 7.706223% |
| B | 108899 | 7395 | 6.790696% |
| C | 108899 | 1659 | 1.523430% |
| D | 108899 | 9775 | 8.976207% |
Noise dominated data is calculated using 1-second bins in cleaned event files. If a bin has >2000 counts, and if more than 50% of those come from <1% of pixels, then it is considered to be noise-dominated and hence unusable.
| Quadrant | # 1 sec bins | Bins with >0 counts | Bins with >2000 counts | High rate bins dominated by noise | Noise dominated (total time) | Noise dominated (detector-on time) | Marked lightcurve |
|---|---|---|---|---|---|---|---|
| A | 124034 | 108473 | 0 | 0 | 0.00% | 0.00% |  |
| B | 124034 | 108837 | 0 | 0 | 0.00% | 0.00% |  |
| C | 124034 | 108899 | 0 | 0 | 0.00% | 0.00% |  |
| D | 124034 | 108771 | 0 | 0 | 0.00% | 0.00% |  |
Top three noisy pixels from each quadrant. If the there are fewer than three noisy pixels in the level2.evt file, extra rows are filled as -1
| Pixel properties | Quadrant properties | ||||||
|---|---|---|---|---|---|---|---|
| Quadrant | DetID | PixID | Counts | Sigma | Mean | Median | Sigma |
| A | 0 | 29 | 5094 | 9.1 | 1608 | 1503 | 394.4 |
| A | 7 | 110 | 4999 | 8.86 | 1608 | 1503 | 394.4 |
| A | 9 | 19 | 4619 | 7.9 | 1608 | 1503 | 394.4 |
| B | 2 | 9 | 4810 | 10.7 | 1585 | 1509 | 308.6 |
| B | 2 | 8 | 4035 | 8.19 | 1585 | 1509 | 308.6 |
| B | 14 | 254 | 4005 | 8.09 | 1585 | 1509 | 308.6 |
| C | 12 | 241 | 4511 | 6.8 | 1685 | 1574 | 431.9 |
| C | 2 | 191 | 4316 | 6.35 | 1685 | 1574 | 431.9 |
| C | 3 | 126 | 4247 | 6.19 | 1685 | 1574 | 431.9 |
| D | 10 | 190 | 3999 | 6.58 | 1519 | 1387 | 396.9 |
| D | 3 | 14 | 3786 | 6.04 | 1519 | 1387 | 396.9 |
| D | 6 | 231 | 3730 | 5.9 | 1519 | 1387 | 396.9 |
Histogram calculated using DETX and DETY for each event in the final _common_clean file
| Quadrant A | 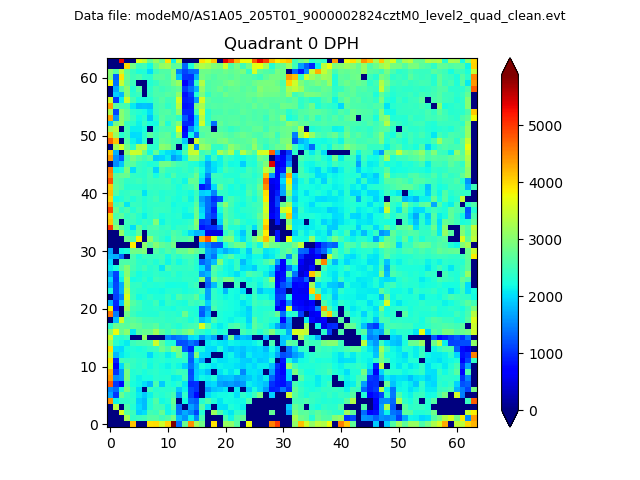 |
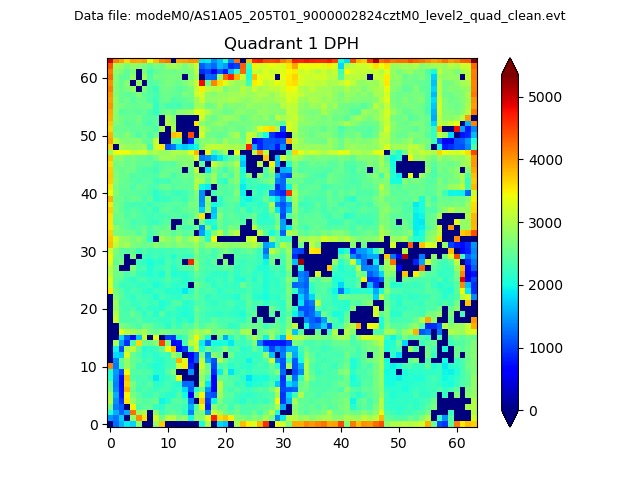 |
Quadrant B |
|---|---|---|---|
| Quadrant D | 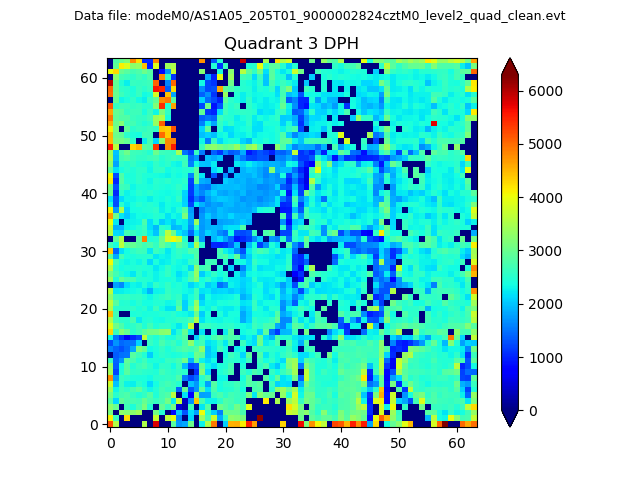 |
 |
Quadrant C |
| Plot type | Count rate plots | Images |
|---|---|---|
| Comparison with Poisson distribution Blue bars denote a histogram of data divided into 1 sec bins. Red curve is a Poisson curve with rate = median count rate of data. |
 |
 |
| Quadrant-wise count rates Data is divided into 100 sec bins |
 |
|
| Module-wise count rates for Quadrant A Data is divided into 100 sec bins |
 |
 |
| Module-wise count rates for Quadrant B Data is divided into 100 sec bins |
 |
 |
| Module-wise count rates for Quadrant C Data is divided into 100 sec bins |
 |
 |
| Module-wise count rates for Quadrant D Data is divided into 100 sec bins |
 |
 |
| Parameter | Plot |
|---|---|
| CZT HV Monitor |  |
| D_VDD |  |
| Temperature 1 |  |
| Veto HV Monitor |  |
| Veto LLD |  |
| Alpha Counter |  |
| _CPM_Rate |  |
| CZT Counter |  |
| +2.5 Volts monitor |  |
| +5 Volts monitor |  |
| _ROLL_ROT |  |
| _Roll_DEC | 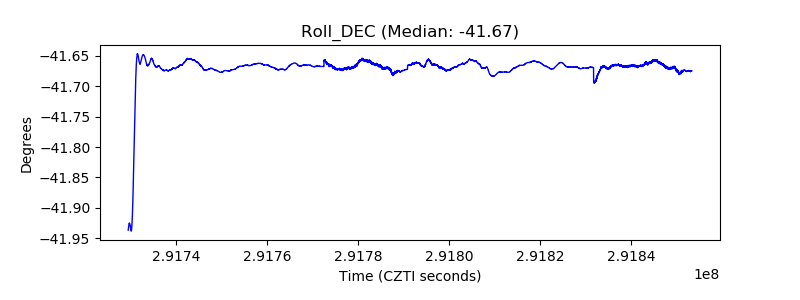 |
| _Roll_RA |  |
| Veto Counter |  |