| Param | Original file | Final file |
|---|---|---|
| Filename | modeM0/AS1A05_205T01_9000002824_18951cztM0_level2.evt | modeM0/AS1A05_205T01_9000002824_18951cztM0_level2_quad_clean.evt |
| Size (bytes) | 507,623,040 | 45,800,640 |
| Size | 484.1 MB | 43.7 MB |
| Events in quadrant A | 6,261,633 | 159,560 |
| Events in quadrant B | 2,979,711 | 325,294 |
| Events in quadrant C | 2,182,817 | 315,814 |
| Events in quadrant D | 3,676,187 | 300,941 |
| Mode M9 | |||
|---|---|---|---|
| Quadrant | BADHDUFLAG | Total packets | Discarded packets |
| A | 0 | 1 | 0 |
| B | 0 | 1 | 0 |
| C | 0 | 1 | 0 |
| D | 0 | 1 | 0 |
| Mode SS | |||
|---|---|---|---|
| Quadrant | BADHDUFLAG | Total packets | Discarded packets |
| A | 0 | 84 | 0 |
| B | 0 | 84 | 0 |
| C | 0 | 84 | 0 |
| D | 0 | 84 | 0 |
| Mode M0 | |||
|---|---|---|---|
| Quadrant | BADHDUFLAG | Total packets | Discarded packets |
| A | 0 | 21314 | 1 |
| B | 0 | 11436 | 1 |
| C | 0 | 8864 | 1 |
| D | 0 | 13650 | 1 |
| Quadrant | Total seconds | Saturated seconds | Saturation percentage |
|---|---|---|---|
| A | 4016 | 2061 | 51.319721% |
| B | 4016 | 419 | 10.433267% |
| C | 4016 | 226 | 5.627490% |
| D | 4016 | 475 | 11.827689% |
Noise dominated data is calculated using 1-second bins in cleaned event files. If a bin has >2000 counts, and if more than 50% of those come from <1% of pixels, then it is considered to be noise-dominated and hence unusable.
| Quadrant | # 1 sec bins | Bins with >0 counts | Bins with >2000 counts | High rate bins dominated by noise | Noise dominated (total time) | Noise dominated (detector-on time) | Marked lightcurve |
|---|---|---|---|---|---|---|---|
| A | 4151 | 4016 | 1449 | 1449 | 34.91% | 36.08% | 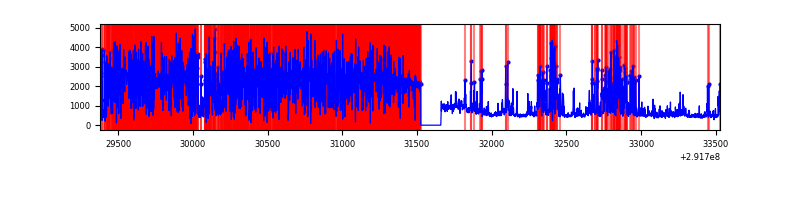 |
| B | 4151 | 4017 | 114 | 114 | 2.75% | 2.84% | 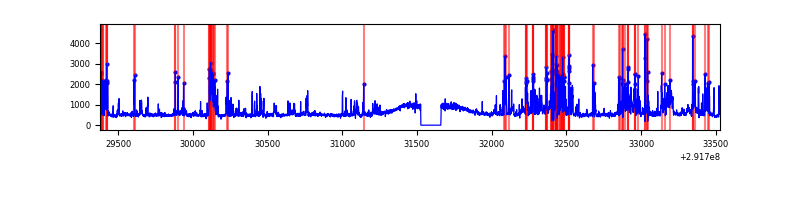 |
| C | 4151 | 4017 | 0 | 0 | 0.00% | 0.00% | 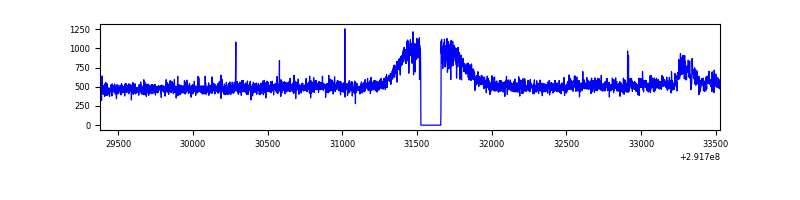 |
| D | 4151 | 4017 | 188 | 188 | 4.53% | 4.68% | 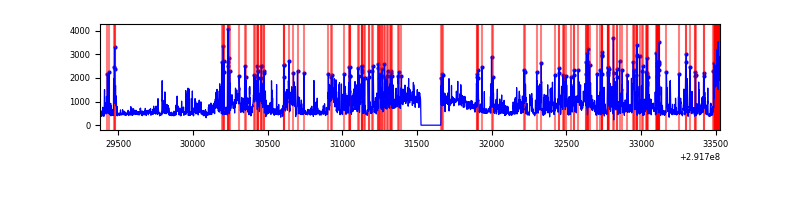 |
Top three noisy pixels from each quadrant. If the there are fewer than three noisy pixels in the level2.evt file, extra rows are filled as -1
| Pixel properties | Quadrant properties | ||||||
|---|---|---|---|---|---|---|---|
| Quadrant | DetID | PixID | Counts | Sigma | Mean | Median | Sigma |
| A | 14 | 235 | 4843853 | 64006.65 | 367 | 359 | 75.7 |
| A | 0 | 226 | 3127 | 36.58 | 367 | 359 | 75.7 |
| A | 3 | 137 | 2930 | 33.98 | 367 | 359 | 75.7 |
| B | 3 | 112 | 879711 | 8436.71 | 518 | 504 | 104.2 |
| B | 0 | 189 | 32843 | 310.32 | 518 | 504 | 104.2 |
| B | 12 | 111 | 12243 | 112.65 | 518 | 504 | 104.2 |
| C | 3 | 233 | 98676 | 793.23 | 512 | 514 | 123.8 |
| C | 14 | 238 | 76986 | 617.95 | 512 | 514 | 123.8 |
| C | 8 | 128 | 3953 | 27.79 | 512 | 514 | 123.8 |
| D | 7 | 238 | 1531424 | 11998.6 | 509 | 494 | 127.6 |
| D | 1 | 52 | 114700 | 895.08 | 509 | 494 | 127.6 |
| D | 12 | 218 | 43783 | 339.28 | 509 | 494 | 127.6 |
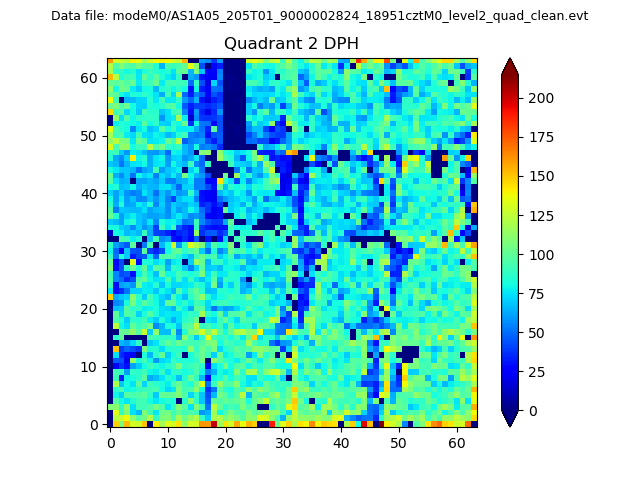
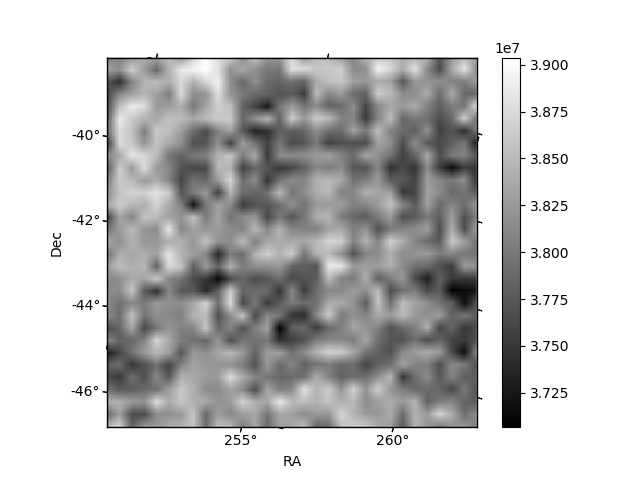
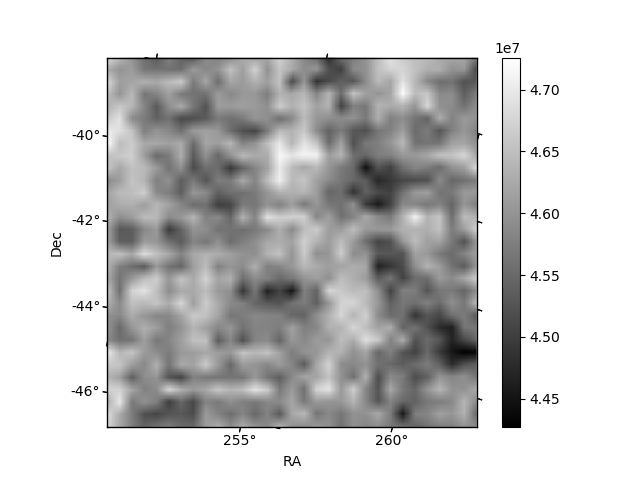
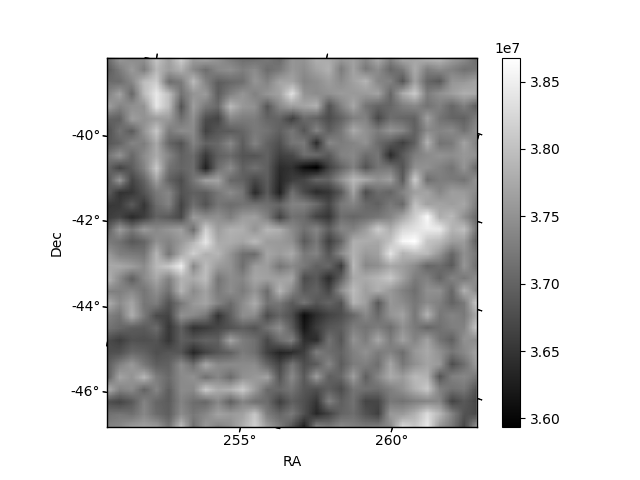
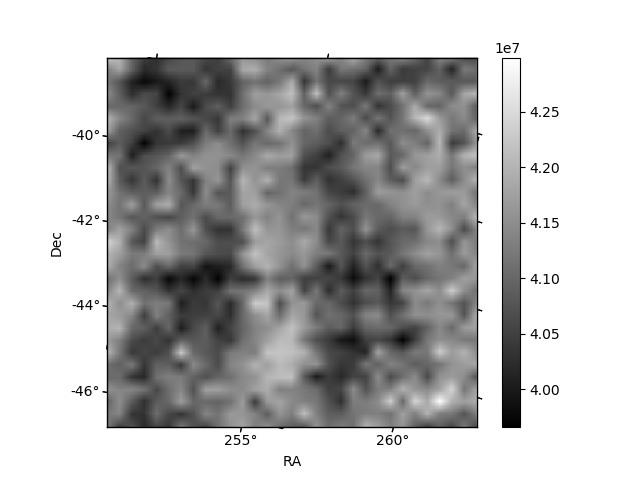
Histogram calculated using DETX and DETY for each event in the final _common_clean file
| Quadrant A |  |
 |
Quadrant B |
|---|---|---|---|
| Quadrant D | 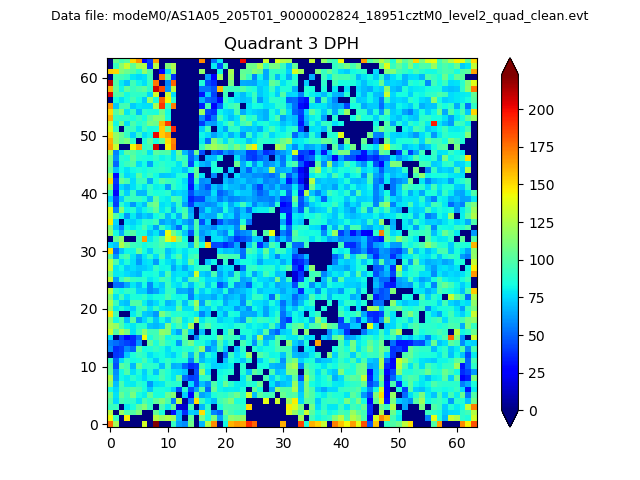 |
 |
Quadrant C |
| Plot type | Count rate plots | Images |
|---|---|---|
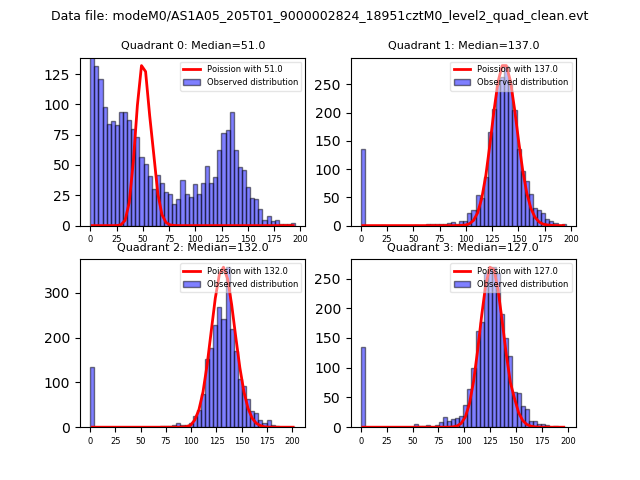
| Comparison with Poisson distribution Blue bars denote a histogram of data divided into 1 sec bins. Red curve is a Poisson curve with rate = median count rate of data. |
 |
 |
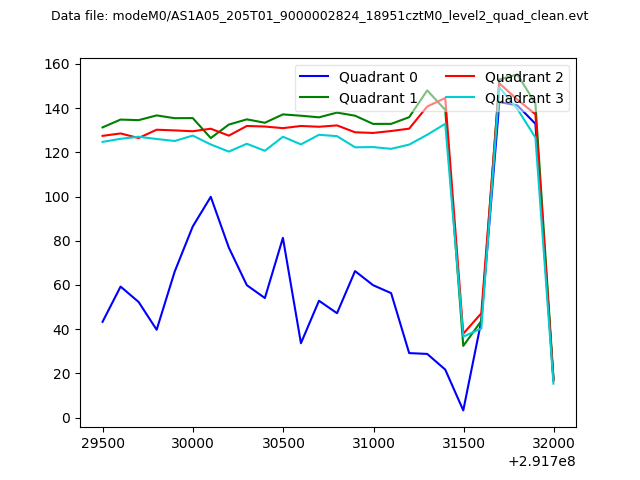
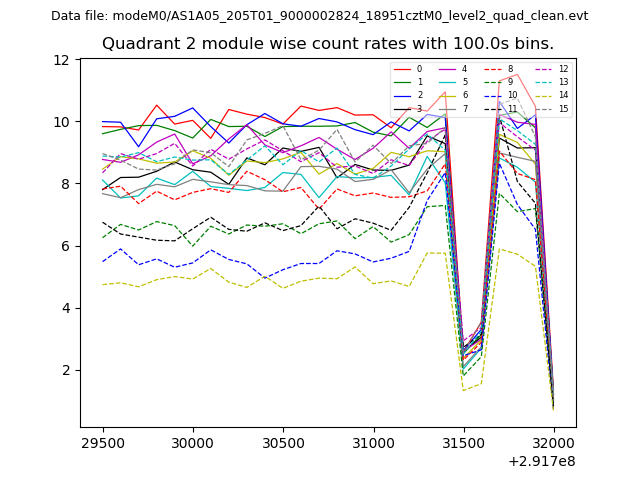
| Quadrant-wise count rates Data is divided into 100 sec bins |
 |
|
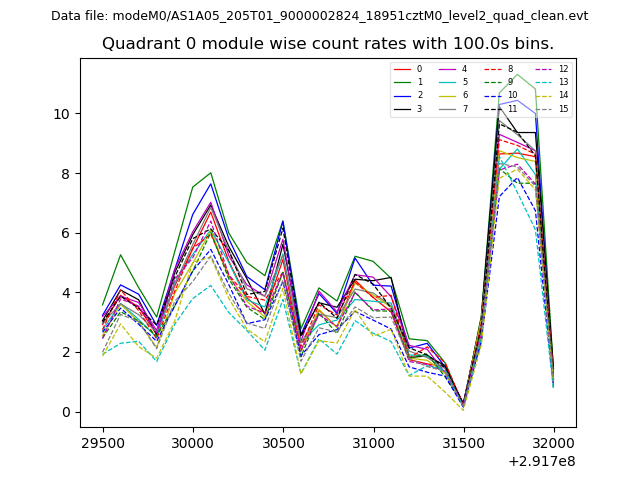
| Module-wise count rates for Quadrant A Data is divided into 100 sec bins |
 |
 |
| Module-wise count rates for Quadrant B Data is divided into 100 sec bins |
 |
 |
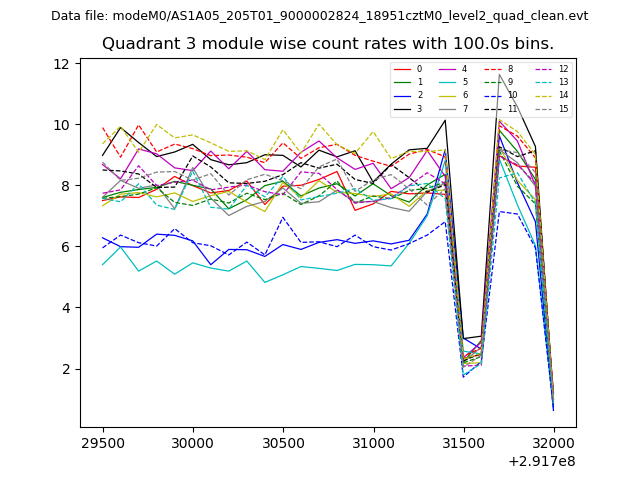
| Module-wise count rates for Quadrant C Data is divided into 100 sec bins |
 |
 |
| Module-wise count rates for Quadrant D Data is divided into 100 sec bins |
 |
 |
| Parameter | Plot |
|---|---|
| CZT HV Monitor | 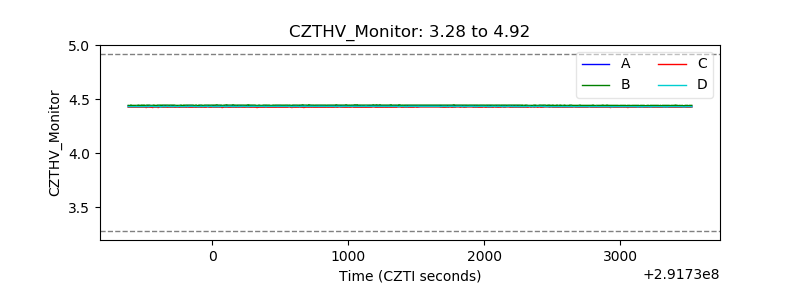 |
| D_VDD | 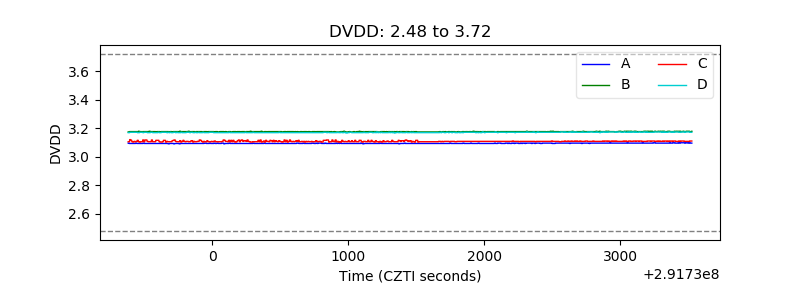 |
| Temperature 1 | 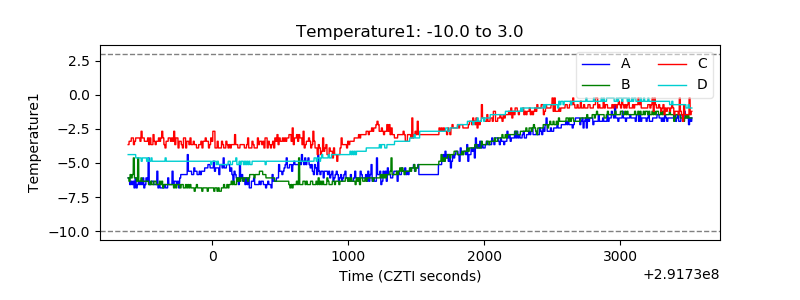 |
| Veto HV Monitor | 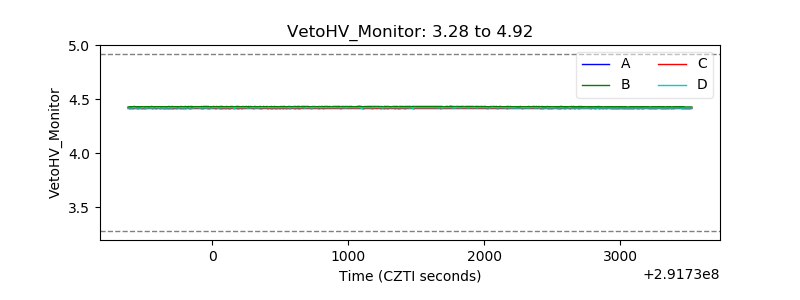 |
| Veto LLD | 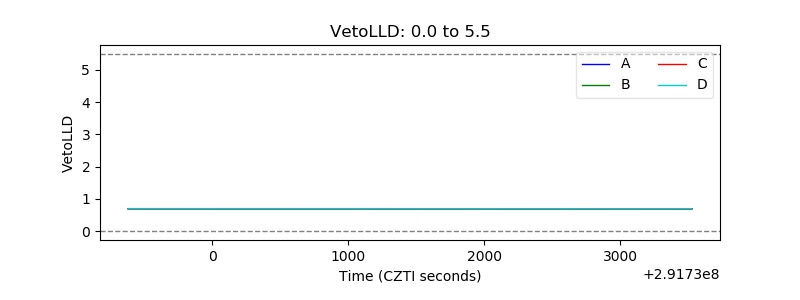 |
| Alpha Counter | 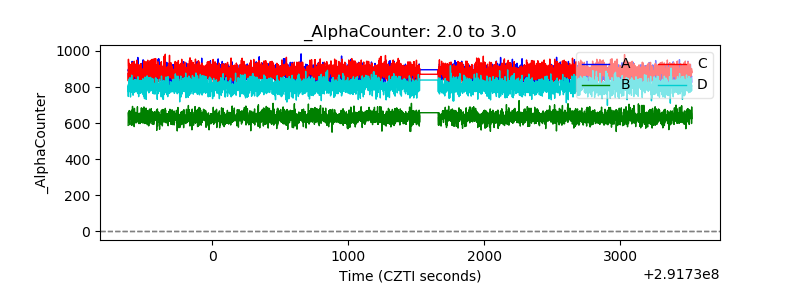 |
| _CPM_Rate | 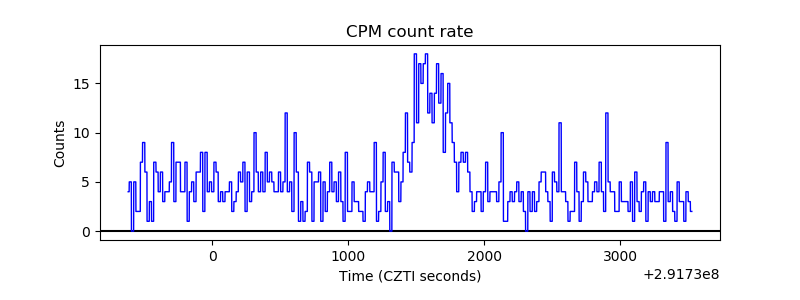 |
| CZT Counter | 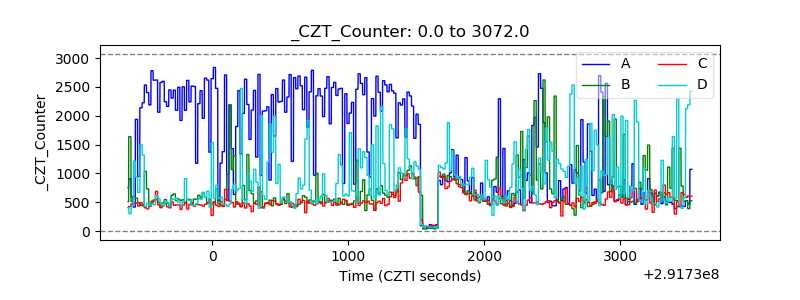 |
| +2.5 Volts monitor |  |
| +5 Volts monitor |  |
| _ROLL_ROT | 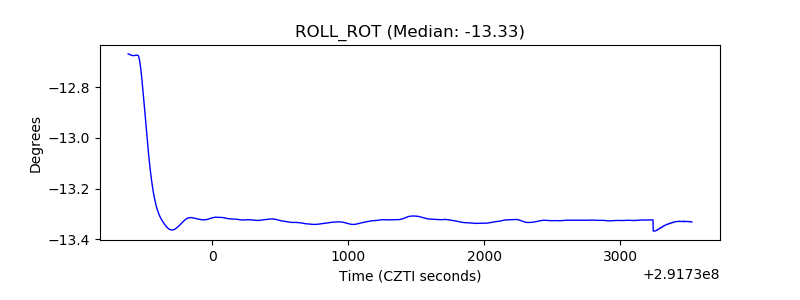 |
| _Roll_DEC | 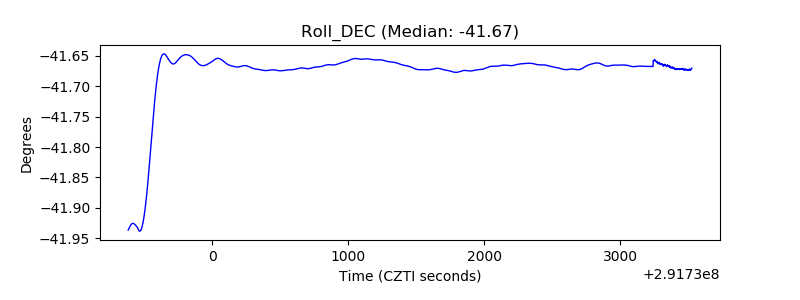 |
| _Roll_RA | 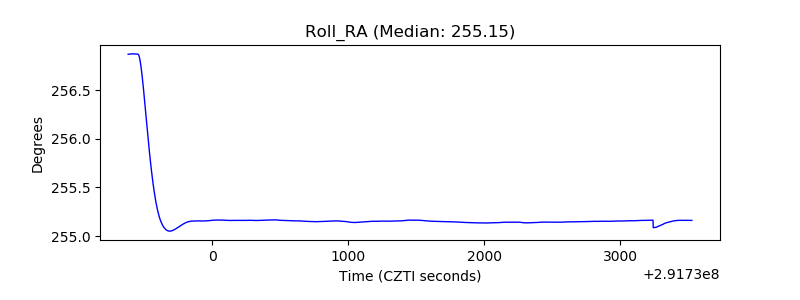 |
| Veto Counter | 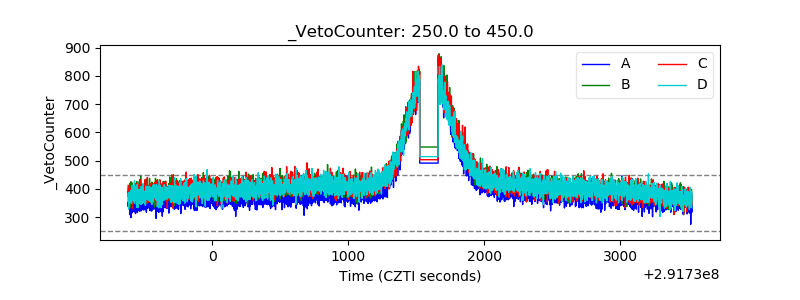 |