| Param | Original file | Final file |
|---|---|---|
| Filename | modeM0/AS1A05_205T01_9000002824_18953cztM0_level2.evt | modeM0/AS1A05_205T01_9000002824_18953cztM0_level2_quad_clean.evt |
| Size (bytes) | 820,422,720 | 82,615,680 |
| Size | 782.4 MB | 78.8 MB |
| Events in quadrant A | 9,176,002 | 408,773 |
| Events in quadrant B | 6,549,934 | 521,708 |
| Events in quadrant C | 3,803,954 | 521,228 |
| Events in quadrant D | 4,790,987 | 508,112 |
| Mode M9 | |||
|---|---|---|---|
| Quadrant | BADHDUFLAG | Total packets | Discarded packets |
| A | 0 | 6 | 0 |
| B | 0 | 6 | 0 |
| C | 0 | 6 | 0 |
| D | 0 | 6 | 0 |
| Mode SS | |||
|---|---|---|---|
| Quadrant | BADHDUFLAG | Total packets | Discarded packets |
| A | 0 | 162 | 0 |
| B | 0 | 162 | 0 |
| C | 0 | 162 | 0 |
| D | 0 | 162 | 0 |
| Mode M0 | |||
|---|---|---|---|
| Quadrant | BADHDUFLAG | Total packets | Discarded packets |
| A | 0 | 32428 | 2 |
| B | 0 | 24598 | 2 |
| C | 0 | 16311 | 2 |
| D | 0 | 19551 | 2 |
| Quadrant | Total seconds | Saturated seconds | Saturation percentage |
|---|---|---|---|
| A | 7776 | 2098 | 26.980453% |
| B | 7776 | 1184 | 15.226337% |
| C | 7777 | 185 | 2.378809% |
| D | 7777 | 231 | 2.970297% |
Noise dominated data is calculated using 1-second bins in cleaned event files. If a bin has >2000 counts, and if more than 50% of those come from <1% of pixels, then it is considered to be noise-dominated and hence unusable.
| Quadrant | # 1 sec bins | Bins with >0 counts | Bins with >2000 counts | High rate bins dominated by noise | Noise dominated (total time) | Noise dominated (detector-on time) | Marked lightcurve |
|---|---|---|---|---|---|---|---|
| A | 8366 | 7778 | 1481 | 1481 | 17.70% | 19.04% | 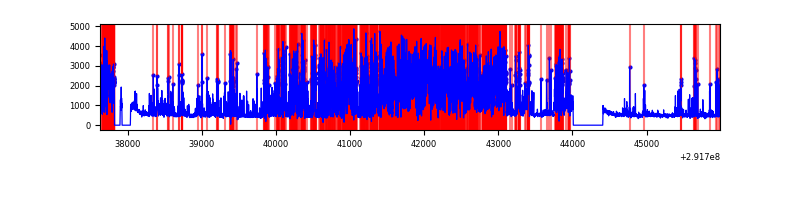 |
| B | 8366 | 7779 | 579 | 579 | 6.92% | 7.44% | 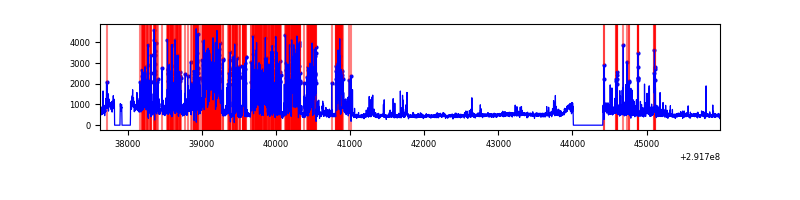 |
| C | 8367 | 7780 | 1 | 1 | 0.01% | 0.01% | 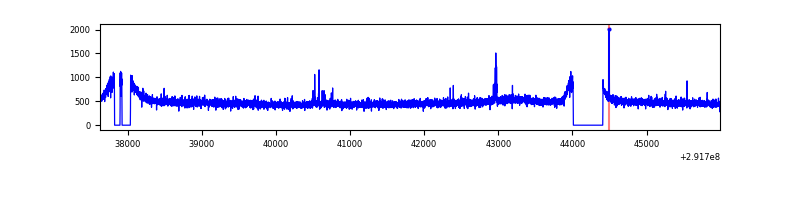 |
| D | 8367 | 7780 | 74 | 74 | 0.88% | 0.95% | 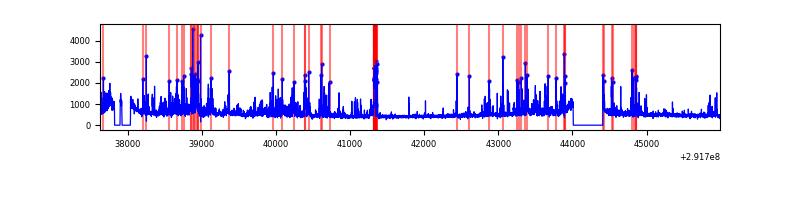 |
Top three noisy pixels from each quadrant. If the there are fewer than three noisy pixels in the level2.evt file, extra rows are filled as -1
| Pixel properties | Quadrant properties | ||||||
|---|---|---|---|---|---|---|---|
| Quadrant | DetID | PixID | Counts | Sigma | Mean | Median | Sigma |
| A | 14 | 235 | 5813638 | 33035.91 | 854 | 834 | 176.0 |
| A | 6 | 16 | 64831 | 363.71 | 854 | 834 | 176.0 |
| A | 13 | 254 | 7470 | 37.71 | 854 | 834 | 176.0 |
| B | 3 | 112 | 2544114 | 14190.2 | 918 | 893 | 179.2 |
| B | 7 | 220 | 206026 | 1144.56 | 918 | 893 | 179.2 |
| B | 0 | 189 | 93409 | 516.2 | 918 | 893 | 179.2 |
| C | 14 | 238 | 142017 | 644.59 | 926 | 931 | 218.9 |
| C | 6 | 96 | 40058 | 178.76 | 926 | 931 | 218.9 |
| C | 3 | 233 | 14541 | 62.18 | 926 | 931 | 218.9 |
| D | 7 | 238 | 334228 | 1445.55 | 939 | 909 | 230.6 |
| D | 12 | 218 | 325864 | 1409.28 | 939 | 909 | 230.6 |
| D | 12 | 233 | 270729 | 1170.17 | 939 | 909 | 230.6 |
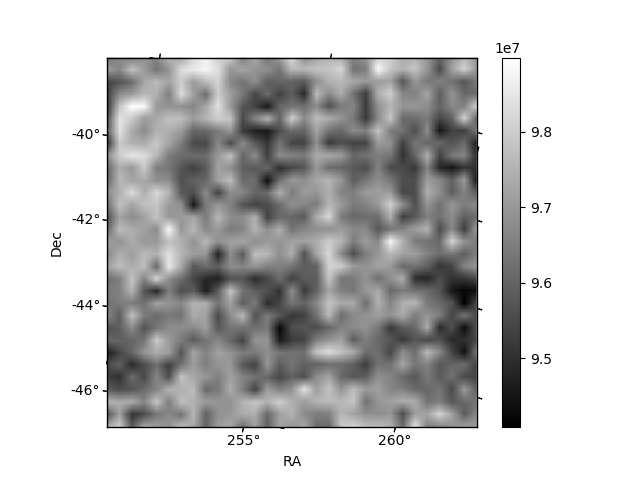
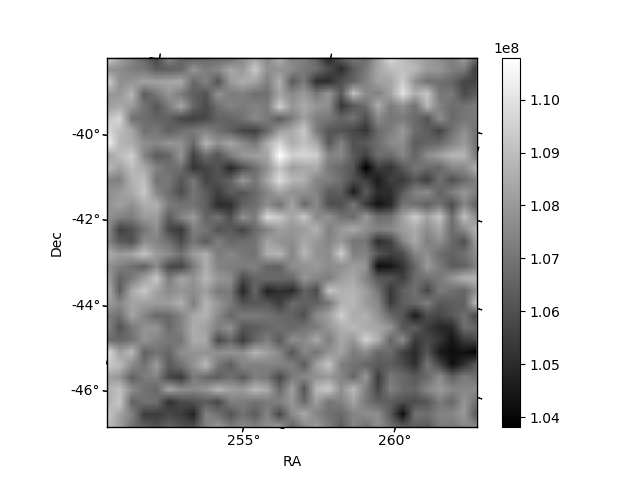
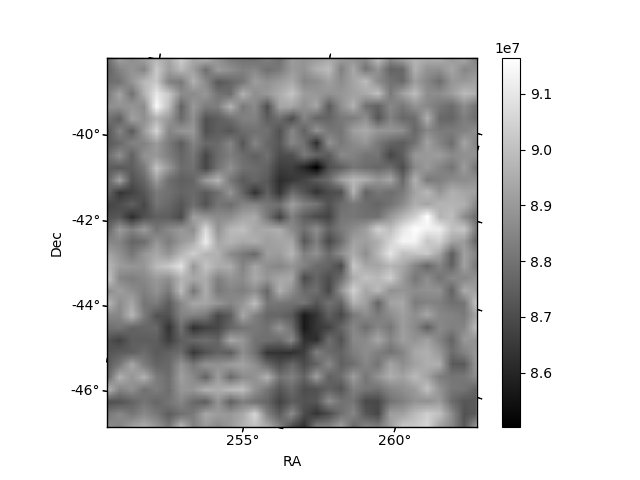
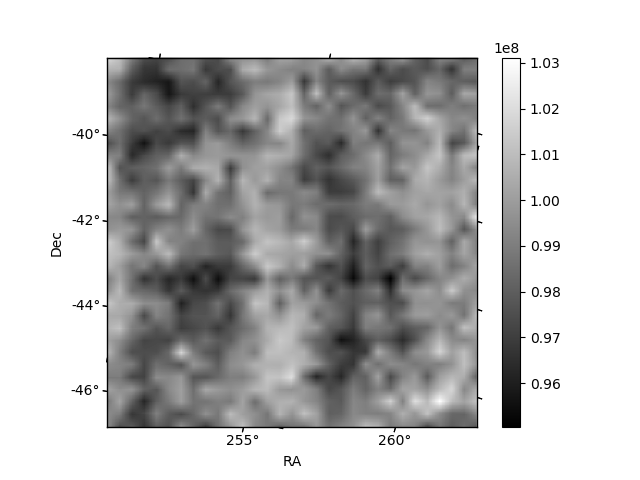
Histogram calculated using DETX and DETY for each event in the final _common_clean file
| Quadrant A | 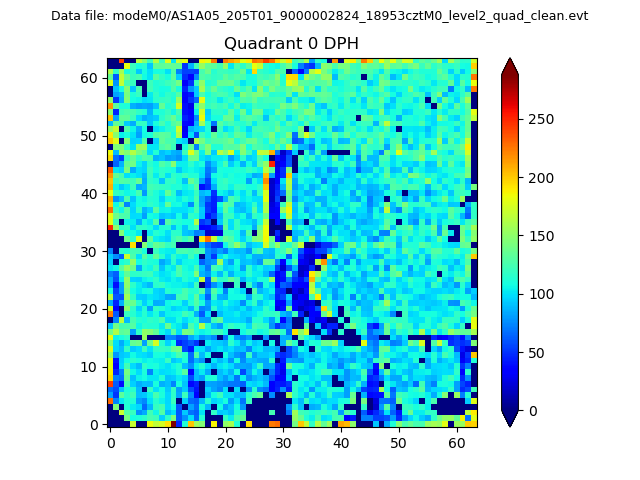 |
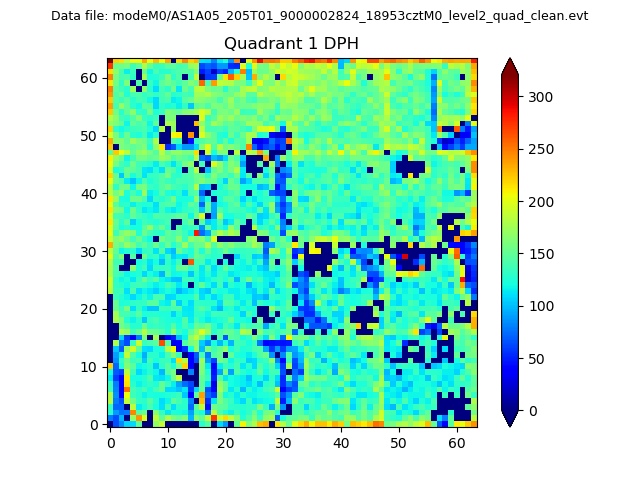 |
Quadrant B |
|---|---|---|---|
| Quadrant D | 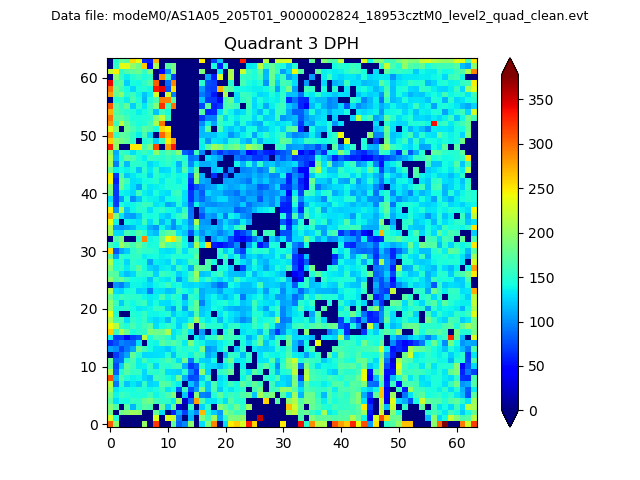 |
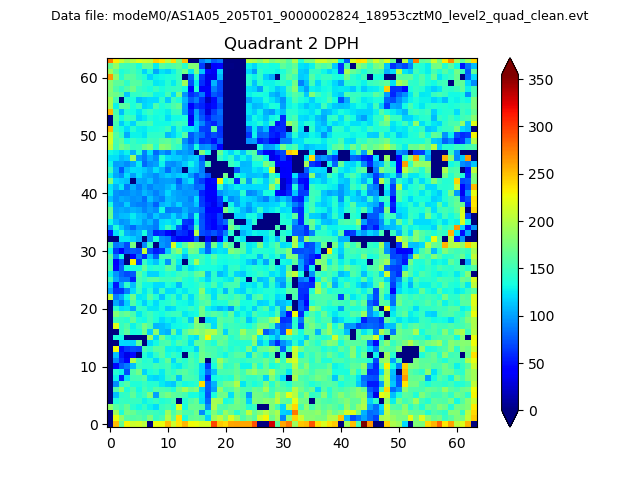 |
Quadrant C |
| Plot type | Count rate plots | Images |
|---|---|---|
| Comparison with Poisson distribution Blue bars denote a histogram of data divided into 1 sec bins. Red curve is a Poisson curve with rate = median count rate of data. |
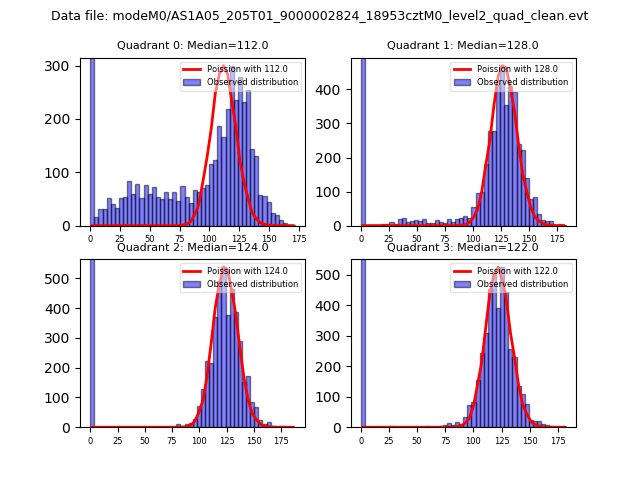 |
 |
| Quadrant-wise count rates Data is divided into 100 sec bins |
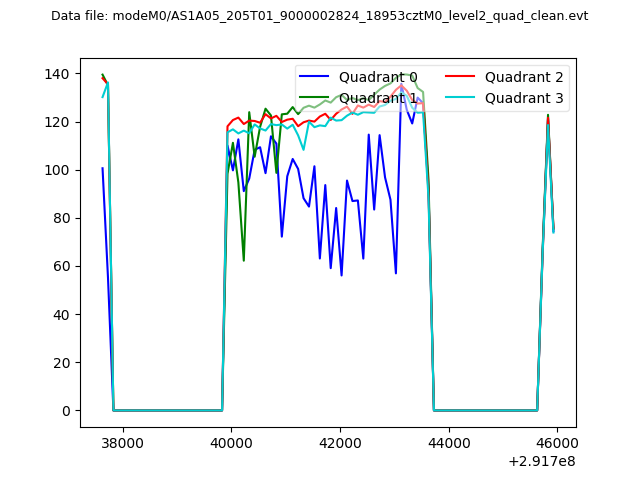 |
|
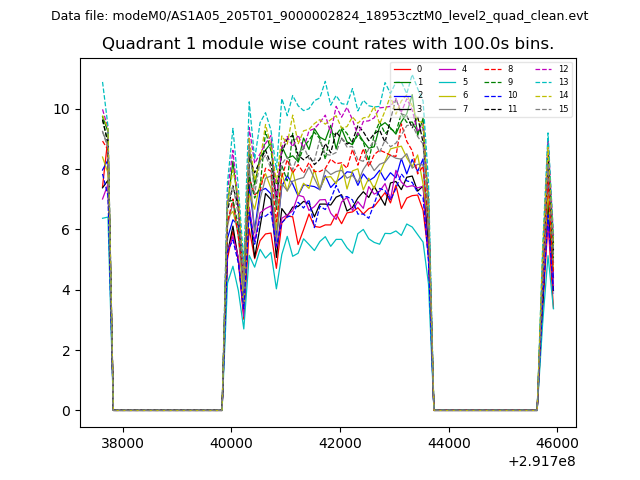
| Module-wise count rates for Quadrant A Data is divided into 100 sec bins |
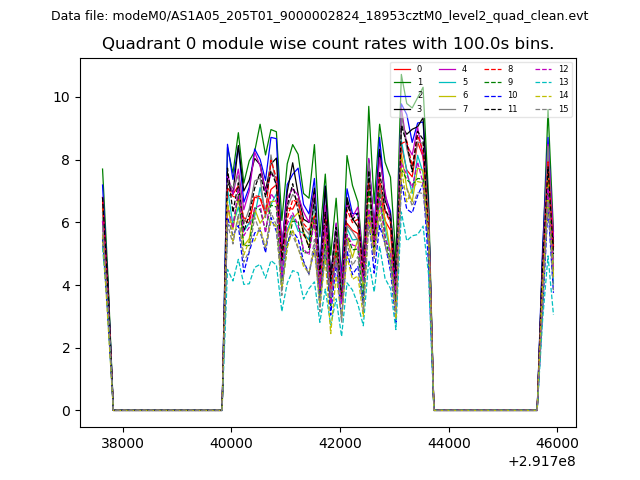 |
 |
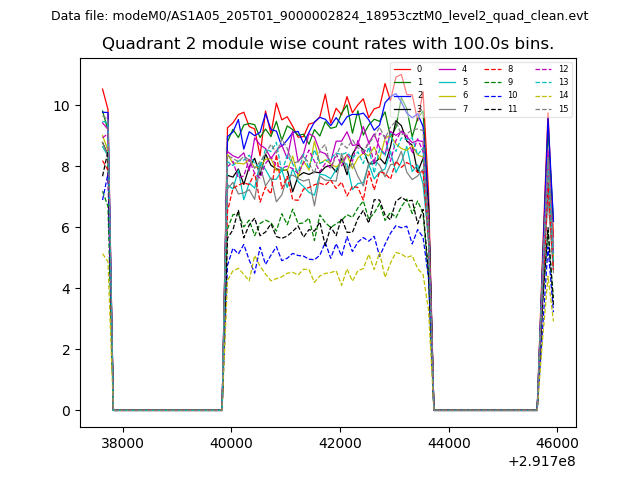
| Module-wise count rates for Quadrant B Data is divided into 100 sec bins |
 |
 |
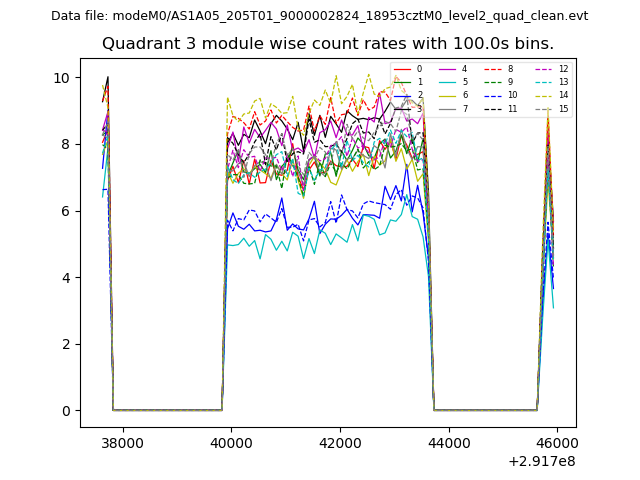
| Module-wise count rates for Quadrant C Data is divided into 100 sec bins |
 |
 |
| Module-wise count rates for Quadrant D Data is divided into 100 sec bins |
 |
 |
| Parameter | Plot |
|---|---|
| CZT HV Monitor | 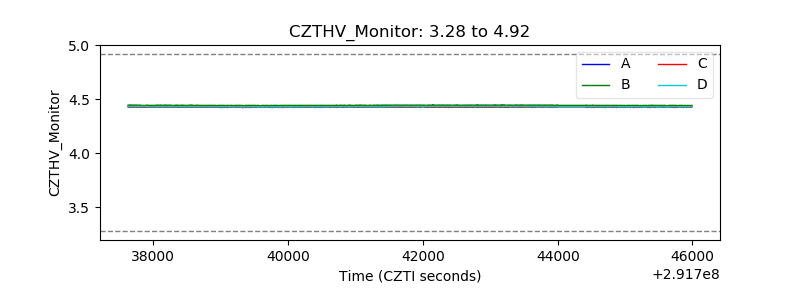 |
| D_VDD | 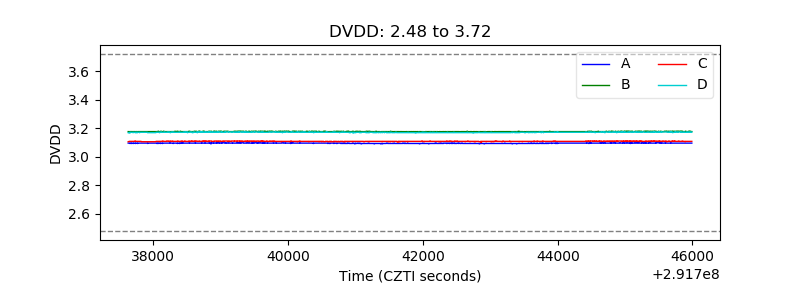 |
| Temperature 1 | 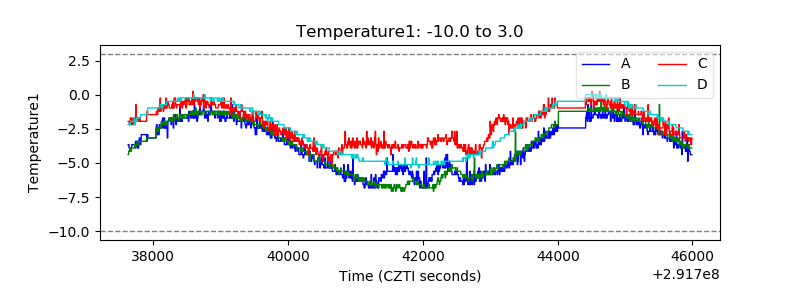 |
| Veto HV Monitor | 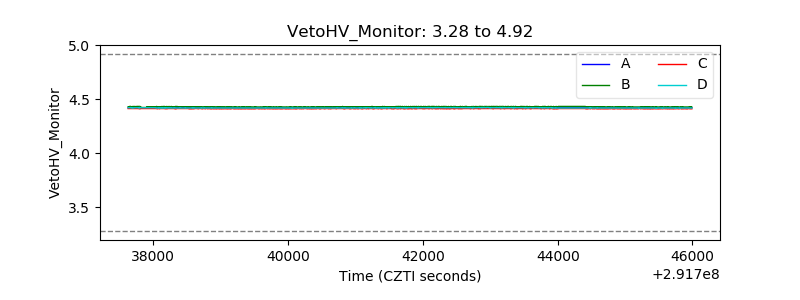 |
| Veto LLD | 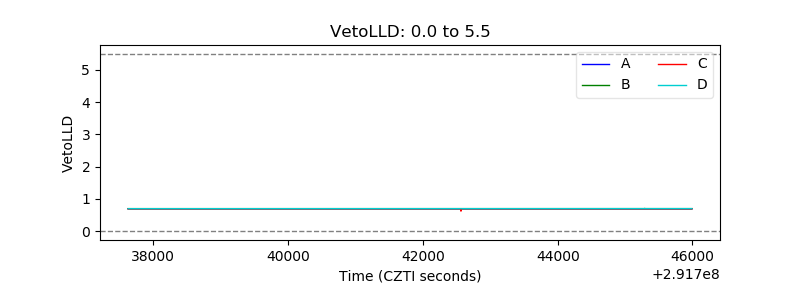 |
| Alpha Counter |  |
| _CPM_Rate |  |
| CZT Counter | 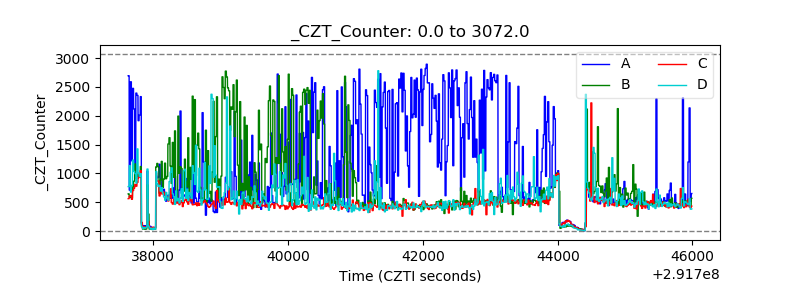 |
| +2.5 Volts monitor |  |
| +5 Volts monitor |  |
| _ROLL_ROT | 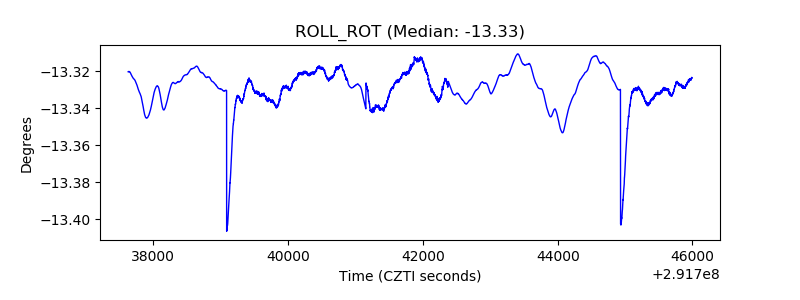 |
| _Roll_DEC | 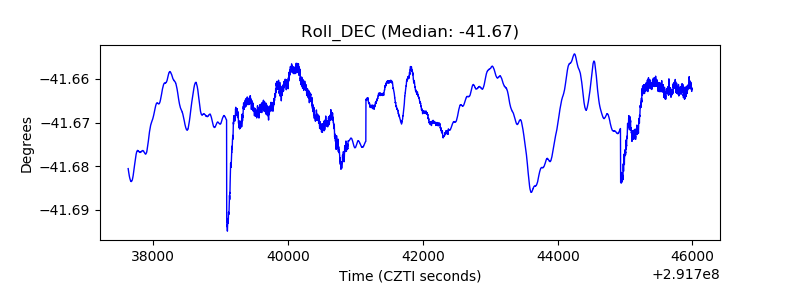 |
| _Roll_RA | 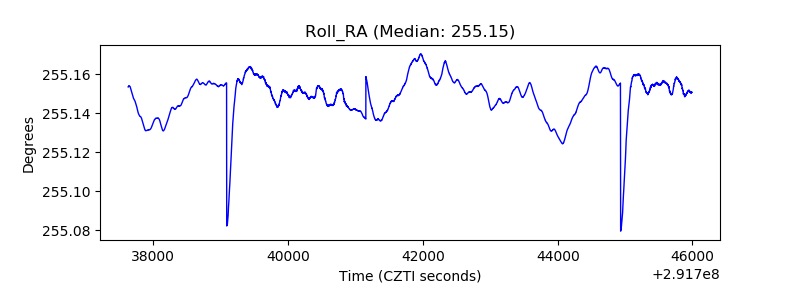 |
| Veto Counter | 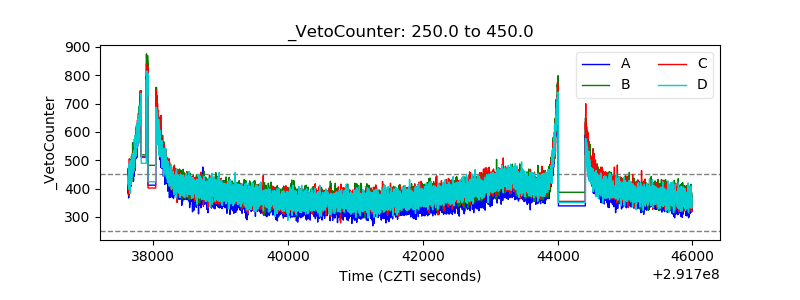 |