| Param | Original file | Final file |
|---|---|---|
| Filename | modeM0/AS1A05_205T01_9000002824_18956cztM0_level2.evt | modeM0/AS1A05_205T01_9000002824_18956cztM0_level2_quad_clean.evt |
| Size (bytes) | 553,680,000 | 98,985,600 |
| Size | 528.0 MB | 94.4 MB |
| Events in quadrant A | 3,559,620 | 649,574 |
| Events in quadrant B | 5,990,316 | 628,361 |
| Events in quadrant C | 3,153,177 | 638,424 |
| Events in quadrant D | 3,612,714 | 616,174 |
| Mode M9 | |||
|---|---|---|---|
| Quadrant | BADHDUFLAG | Total packets | Discarded packets |
| A | 0 | 13 | 0 |
| B | 0 | 14 | 0 |
| C | 0 | 14 | 0 |
| D | 0 | 14 | 0 |
| Mode SS | |||
|---|---|---|---|
| Quadrant | BADHDUFLAG | Total packets | Discarded packets |
| A | 0 | 136 | 0 |
| B | 0 | 136 | 0 |
| C | 0 | 136 | 0 |
| D | 0 | 136 | 0 |
| Mode M0 | |||
|---|---|---|---|
| Quadrant | BADHDUFLAG | Total packets | Discarded packets |
| A | 0 | 14845 | 2 |
| B | 0 | 22196 | 2 |
| C | 0 | 13545 | 2 |
| D | 0 | 15316 | 2 |
| Quadrant | Total seconds | Saturated seconds | Saturation percentage |
|---|---|---|---|
| A | 6667 | 113 | 1.694915% |
| B | 6667 | 961 | 14.414279% |
| C | 6667 | 38 | 0.569972% |
| D | 6667 | 68 | 1.019949% |
Noise dominated data is calculated using 1-second bins in cleaned event files. If a bin has >2000 counts, and if more than 50% of those come from <1% of pixels, then it is considered to be noise-dominated and hence unusable.
| Quadrant | # 1 sec bins | Bins with >0 counts | Bins with >2000 counts | High rate bins dominated by noise | Noise dominated (total time) | Noise dominated (detector-on time) | Marked lightcurve |
|---|---|---|---|---|---|---|---|
| A | 7627 | 6668 | 78 | 78 | 1.02% | 1.17% | 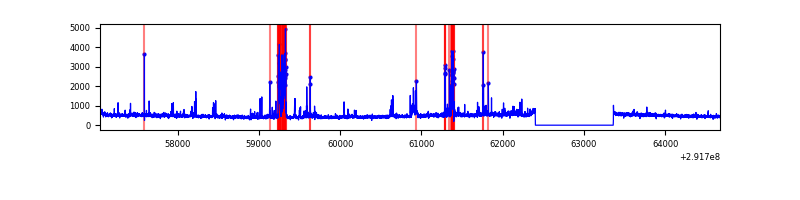 |
| B | 7627 | 6668 | 537 | 537 | 7.04% | 8.05% | 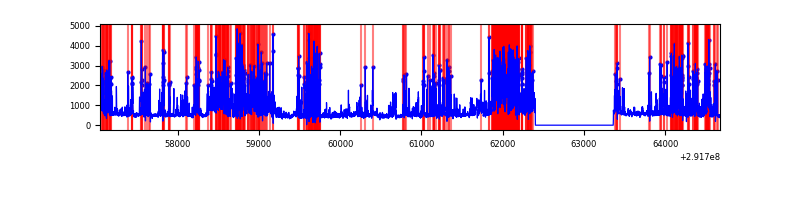 |
| C | 7627 | 6668 | 0 | 0 | 0.00% | 0.00% | 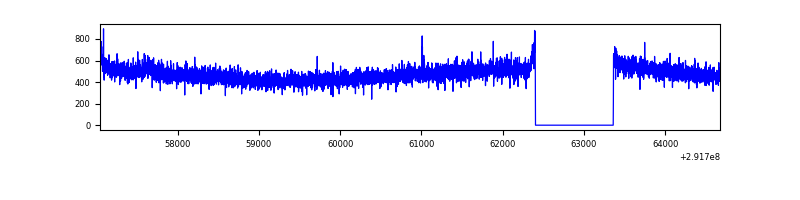 |
| D | 7627 | 6668 | 51 | 51 | 0.67% | 0.76% | 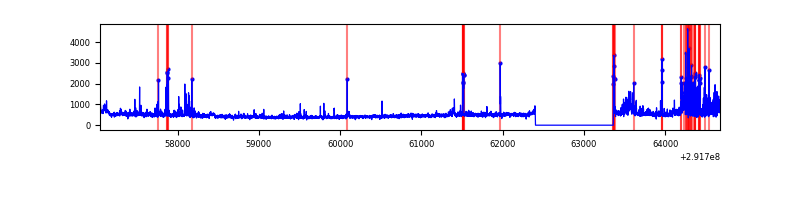 |
Top three noisy pixels from each quadrant. If the there are fewer than three noisy pixels in the level2.evt file, extra rows are filled as -1
| Pixel properties | Quadrant properties | ||||||
|---|---|---|---|---|---|---|---|
| Quadrant | DetID | PixID | Counts | Sigma | Mean | Median | Sigma |
| A | 14 | 235 | 482103 | 2961.31 | 798 | 781 | 162.5 |
| A | 13 | 254 | 8374 | 46.71 | 798 | 781 | 162.5 |
| A | 0 | 226 | 6785 | 36.94 | 798 | 781 | 162.5 |
| B | 3 | 112 | 2811554 | 19044.28 | 760 | 739 | 147.6 |
| B | 0 | 189 | 94504 | 635.29 | 760 | 739 | 147.6 |
| B | 7 | 220 | 78029 | 523.67 | 760 | 739 | 147.6 |
| C | 14 | 238 | 120517 | 655.57 | 773 | 778 | 182.6 |
| C | 3 | 233 | 15237 | 79.16 | 773 | 778 | 182.6 |
| C | 13 | 61 | 5503 | 25.87 | 773 | 778 | 182.6 |
| D | 7 | 238 | 382552 | 1996.4 | 776 | 754 | 191.2 |
| D | 12 | 218 | 131028 | 681.2 | 776 | 754 | 191.2 |
| D | 1 | 52 | 56229 | 290.08 | 776 | 754 | 191.2 |
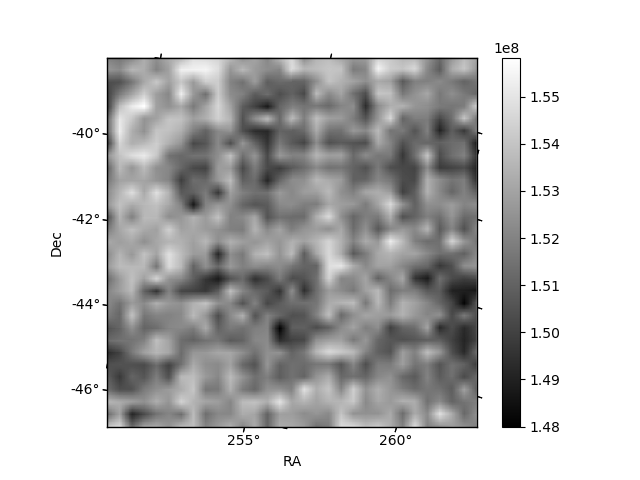
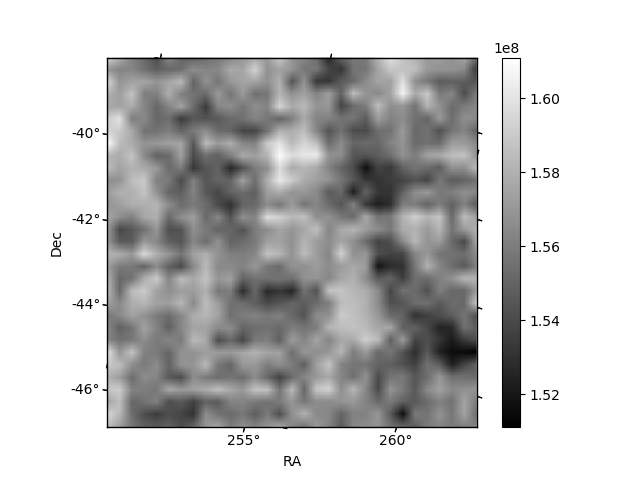
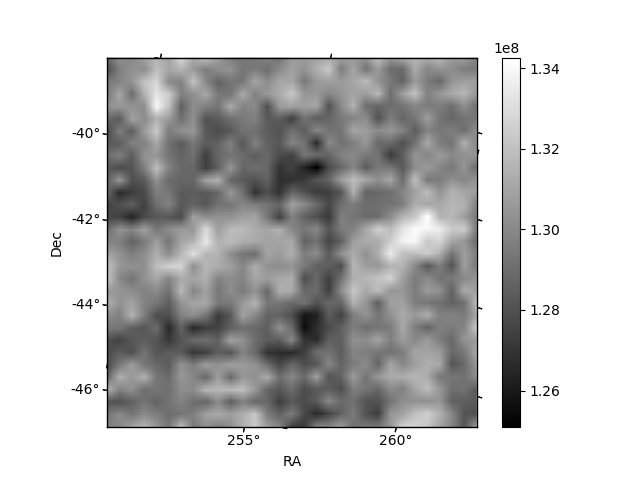
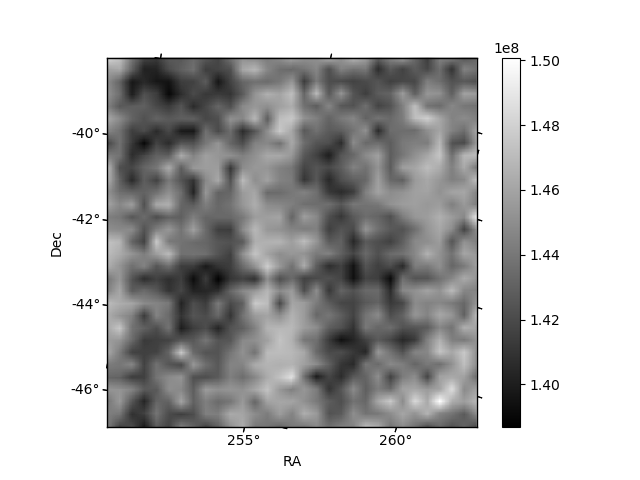
Histogram calculated using DETX and DETY for each event in the final _common_clean file
| Quadrant A | 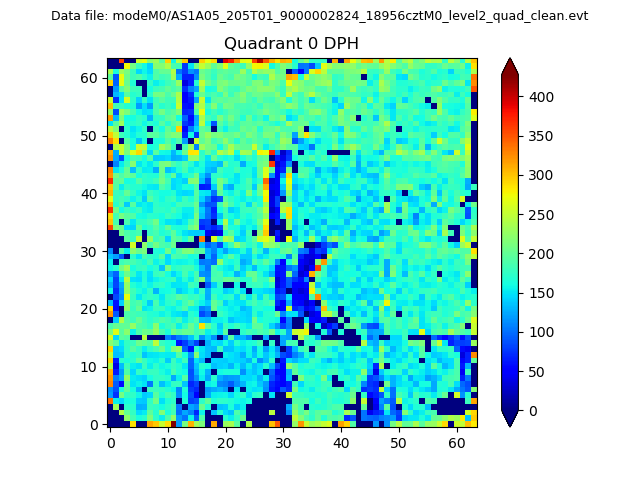 |
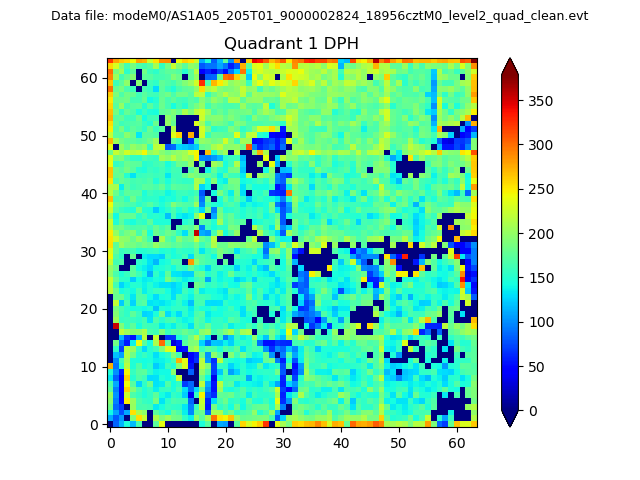 |
Quadrant B |
|---|---|---|---|
| Quadrant D | 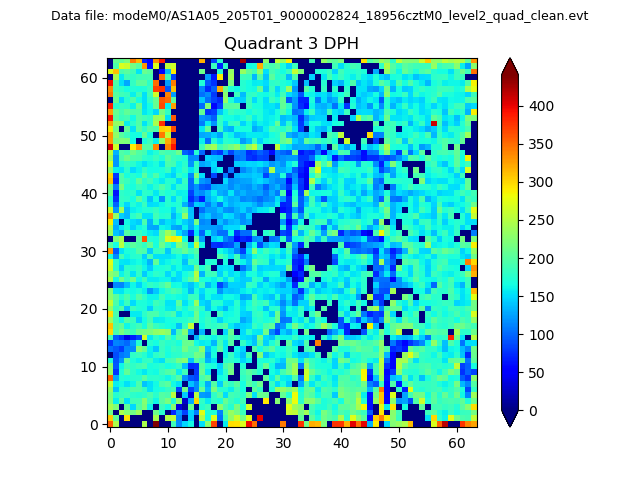 |
 |
Quadrant C |
| Plot type | Count rate plots | Images |
|---|---|---|
| Comparison with Poisson distribution Blue bars denote a histogram of data divided into 1 sec bins. Red curve is a Poisson curve with rate = median count rate of data. |
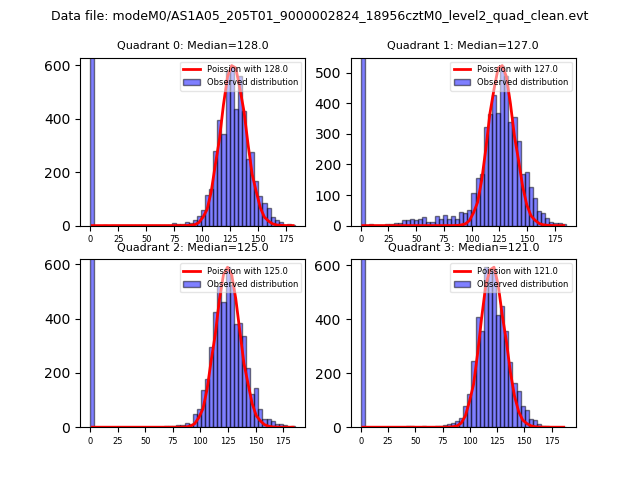 |
 |
| Quadrant-wise count rates Data is divided into 100 sec bins |
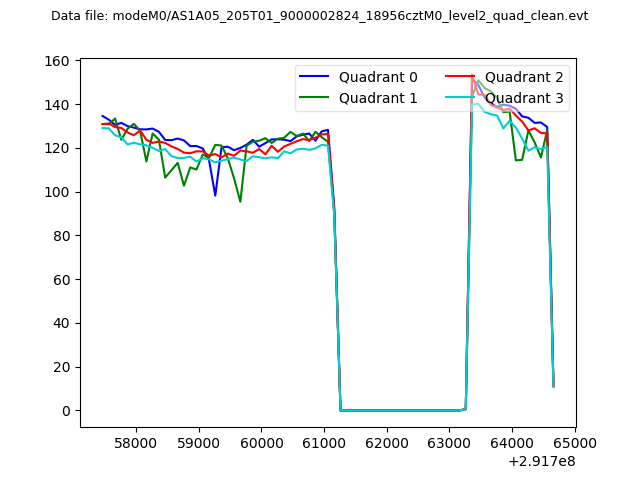 |
|
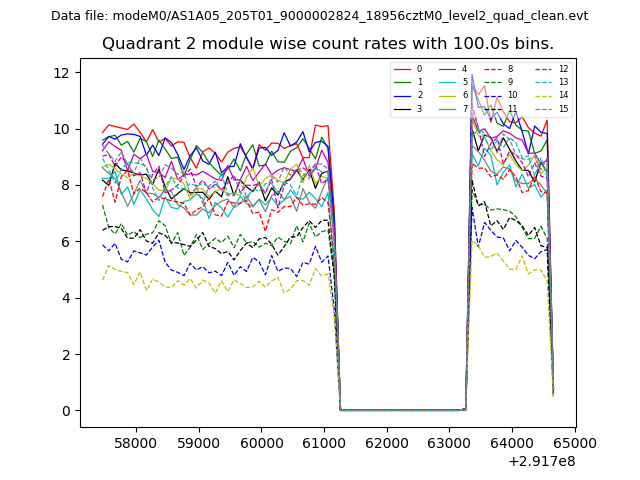
| Module-wise count rates for Quadrant A Data is divided into 100 sec bins |
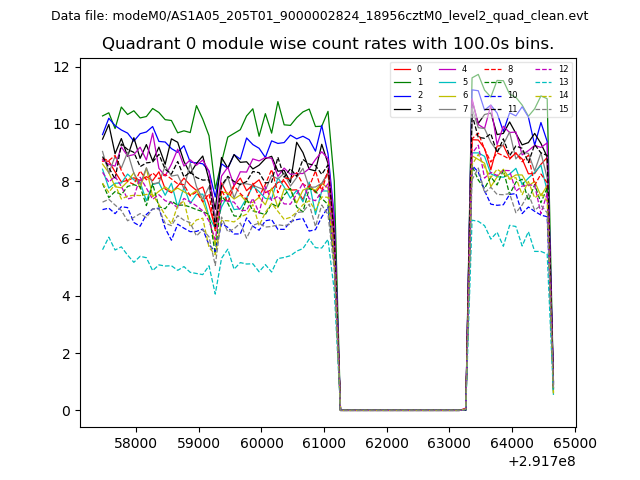 |
 |
| Module-wise count rates for Quadrant B Data is divided into 100 sec bins |
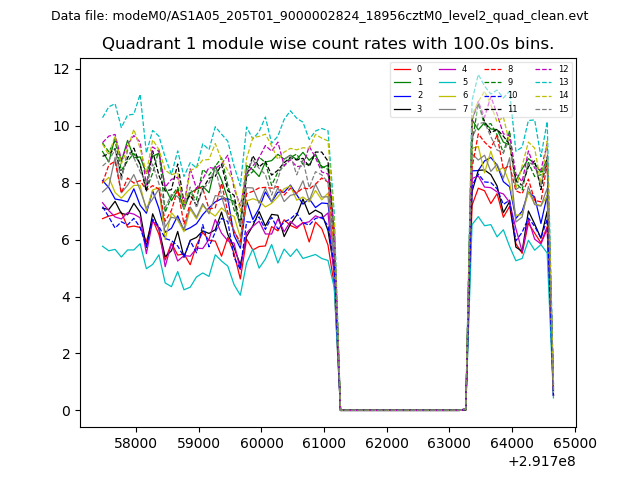 |
 |
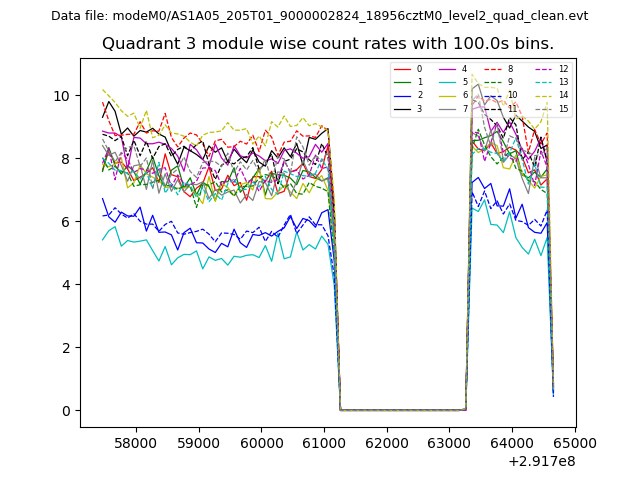
| Module-wise count rates for Quadrant C Data is divided into 100 sec bins |
 |
 |
| Module-wise count rates for Quadrant D Data is divided into 100 sec bins |
 |
 |
| Parameter | Plot |
|---|---|
| CZT HV Monitor | 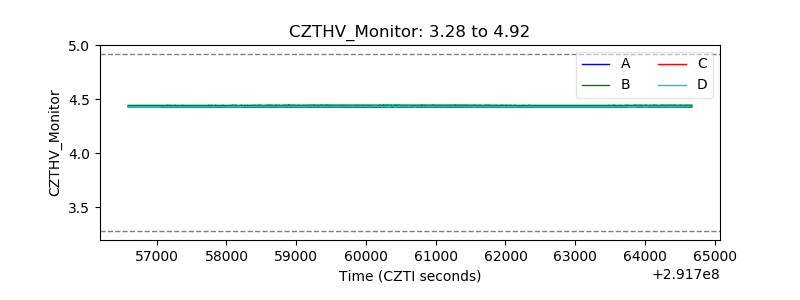 |
| D_VDD | 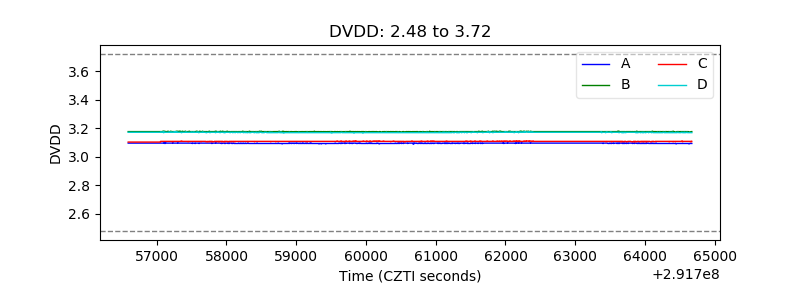 |
| Temperature 1 | 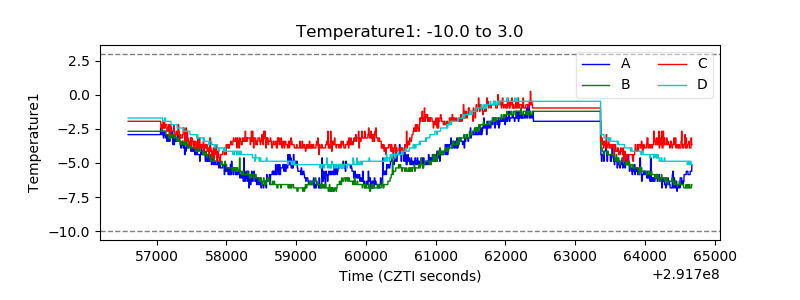 |
| Veto HV Monitor | 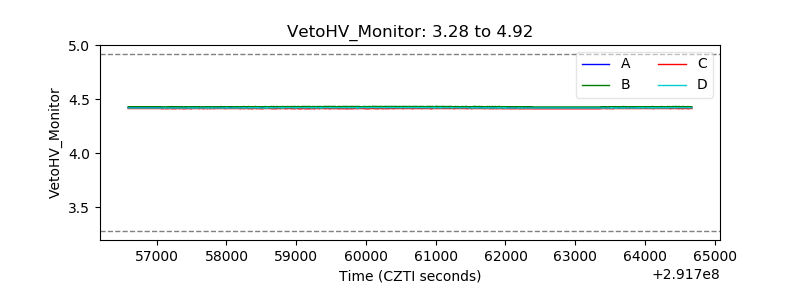 |
| Veto LLD | 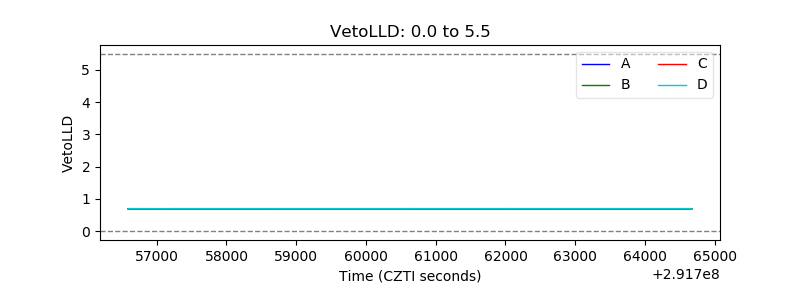 |
| Alpha Counter | 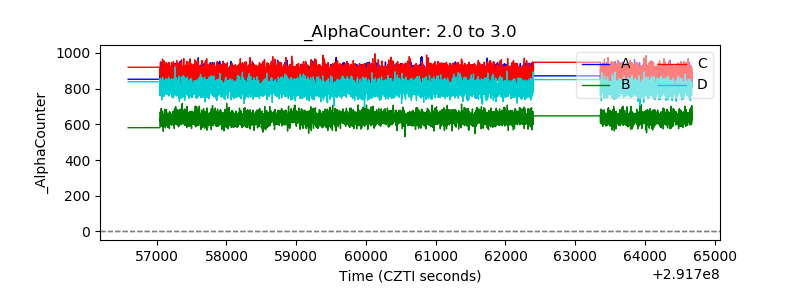 |
| _CPM_Rate | 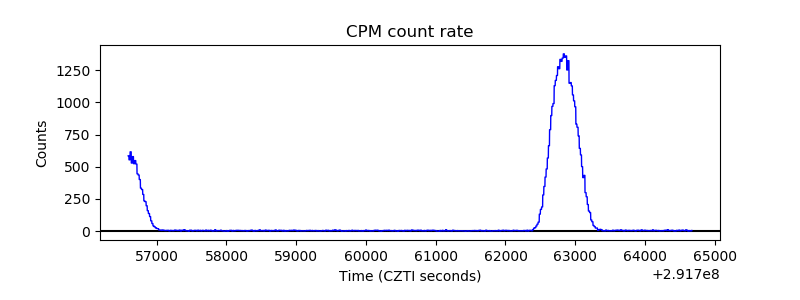 |
| CZT Counter | 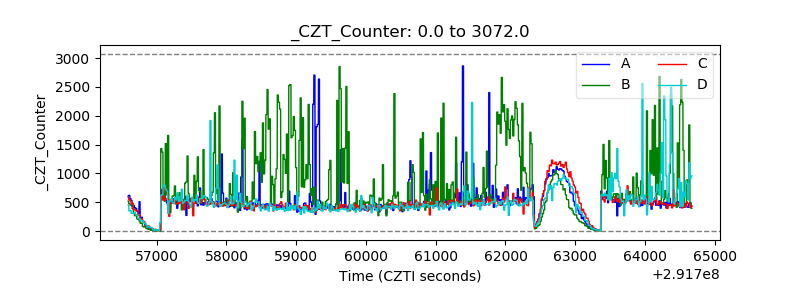 |
| +2.5 Volts monitor |  |
| +5 Volts monitor | 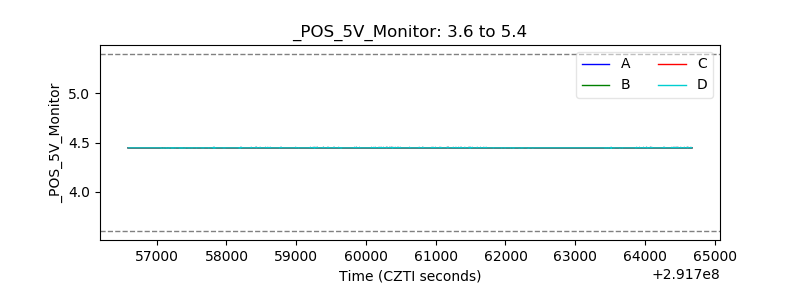 |
| _ROLL_ROT | 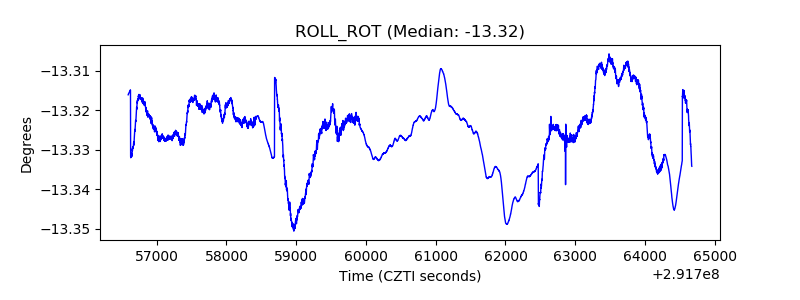 |
| _Roll_DEC | 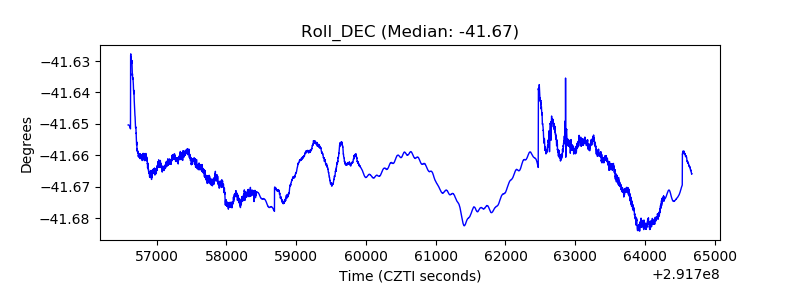 |
| _Roll_RA | 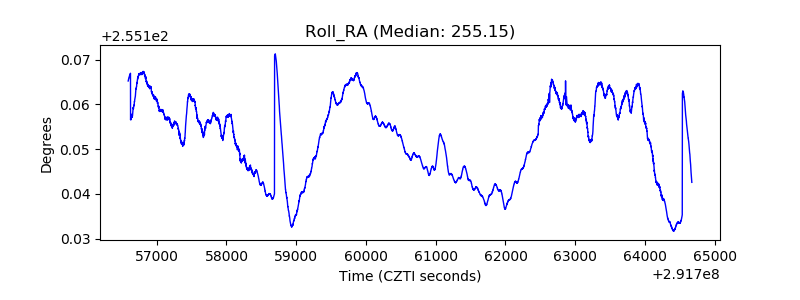 |
| Veto Counter | 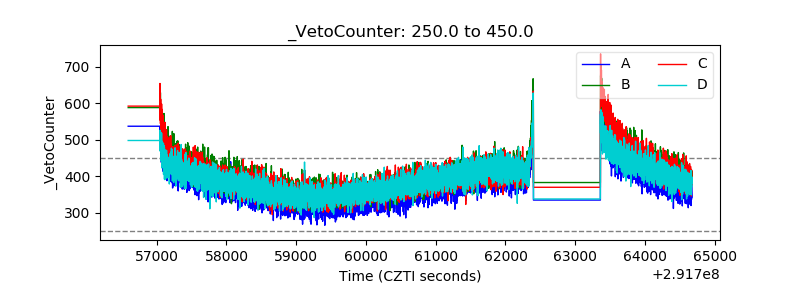 |