| Param | Original file | Final file |
|---|---|---|
| Filename | modeM0/AS1A05_205T01_9000002824_18957cztM0_level2.evt | modeM0/AS1A05_205T01_9000002824_18957cztM0_level2_quad_clean.evt |
| Size (bytes) | 561,723,840 | 100,077,120 |
| Size | 535.7 MB | 95.4 MB |
| Events in quadrant A | 3,096,938 | 665,952 |
| Events in quadrant B | 5,169,244 | 639,678 |
| Events in quadrant C | 3,089,722 | 656,817 |
| Events in quadrant D | 5,222,151 | 621,504 |
| Mode M9 | |||
|---|---|---|---|
| Quadrant | BADHDUFLAG | Total packets | Discarded packets |
| A | 0 | 16 | 0 |
| B | 0 | 17 | 0 |
| C | 0 | 17 | 0 |
| D | 0 | 17 | 0 |
| Mode SS | |||
|---|---|---|---|
| Quadrant | BADHDUFLAG | Total packets | Discarded packets |
| A | 0 | 130 | 0 |
| B | 0 | 130 | 0 |
| C | 0 | 130 | 0 |
| D | 0 | 130 | 0 |
| Mode M0 | |||
|---|---|---|---|
| Quadrant | BADHDUFLAG | Total packets | Discarded packets |
| A | 0 | 13285 | 2 |
| B | 0 | 19574 | 2 |
| C | 0 | 13158 | 2 |
| D | 0 | 19839 | 2 |
| Quadrant | Total seconds | Saturated seconds | Saturation percentage |
|---|---|---|---|
| A | 6400 | 20 | 0.312500% |
| B | 6400 | 630 | 9.843750% |
| C | 6400 | 33 | 0.515625% |
| D | 6400 | 441 | 6.890625% |
Noise dominated data is calculated using 1-second bins in cleaned event files. If a bin has >2000 counts, and if more than 50% of those come from <1% of pixels, then it is considered to be noise-dominated and hence unusable.
| Quadrant | # 1 sec bins | Bins with >0 counts | Bins with >2000 counts | High rate bins dominated by noise | Noise dominated (total time) | Noise dominated (detector-on time) | Marked lightcurve |
|---|---|---|---|---|---|---|---|
| A | 7505 | 6401 | 2 | 2 | 0.03% | 0.03% | 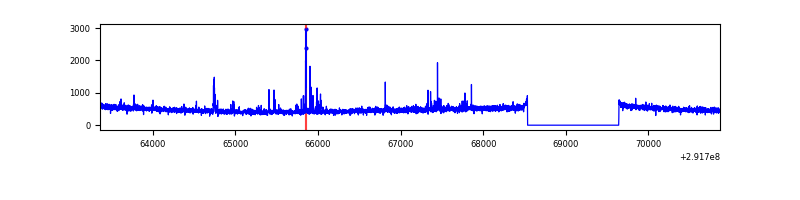 |
| B | 7505 | 6401 | 350 | 350 | 4.66% | 5.47% | 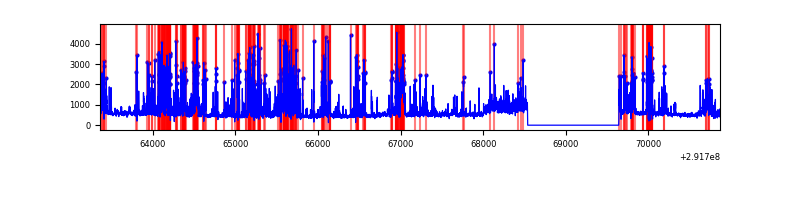 |
| C | 7505 | 6401 | 0 | 0 | 0.00% | 0.00% | 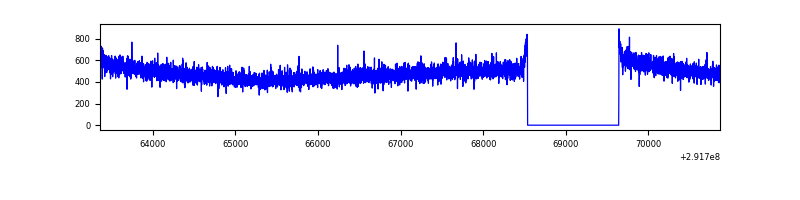 |
| D | 7505 | 6401 | 317 | 317 | 4.22% | 4.95% | 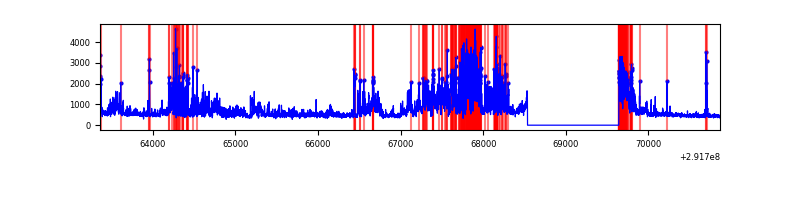 |
Top three noisy pixels from each quadrant. If the there are fewer than three noisy pixels in the level2.evt file, extra rows are filled as -1
| Pixel properties | Quadrant properties | ||||||
|---|---|---|---|---|---|---|---|
| Quadrant | DetID | PixID | Counts | Sigma | Mean | Median | Sigma |
| A | 14 | 235 | 89222 | 556.57 | 781 | 764 | 158.9 |
| A | 13 | 254 | 6783 | 37.87 | 781 | 764 | 158.9 |
| A | 0 | 226 | 6614 | 36.81 | 781 | 764 | 158.9 |
| B | 3 | 112 | 1922489 | 13287.75 | 754 | 734 | 144.6 |
| B | 0 | 189 | 160021 | 1101.37 | 754 | 734 | 144.6 |
| B | 7 | 220 | 93680 | 642.66 | 754 | 734 | 144.6 |
| C | 14 | 238 | 118046 | 654.48 | 761 | 766 | 179.2 |
| C | 13 | 61 | 5302 | 25.31 | 761 | 766 | 179.2 |
| C | 3 | 233 | 4354 | 20.02 | 761 | 766 | 179.2 |
| D | 7 | 238 | 2267538 | 12640.71 | 736 | 717 | 179.3 |
| D | 1 | 52 | 73284 | 404.66 | 736 | 717 | 179.3 |
| D | 12 | 218 | 46892 | 257.49 | 736 | 717 | 179.3 |
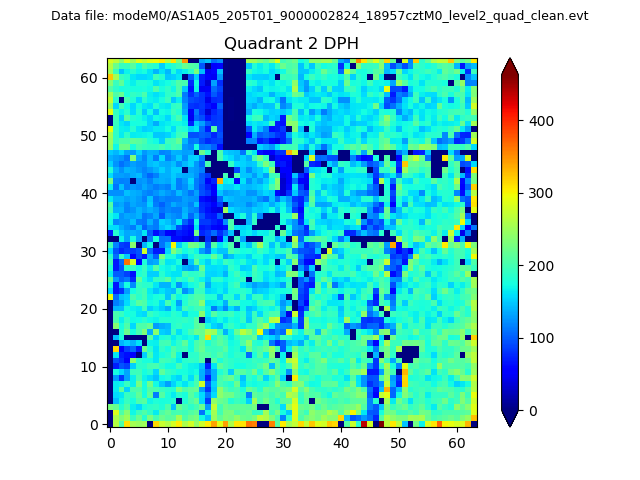
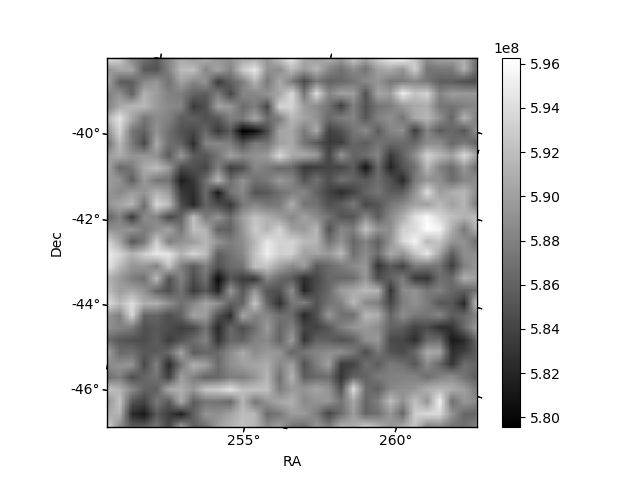
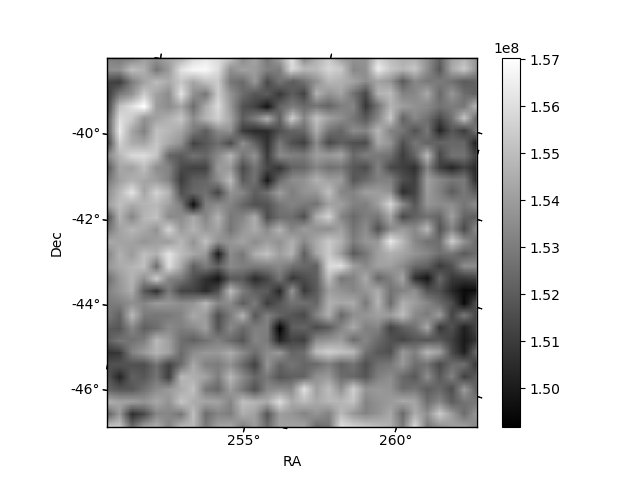
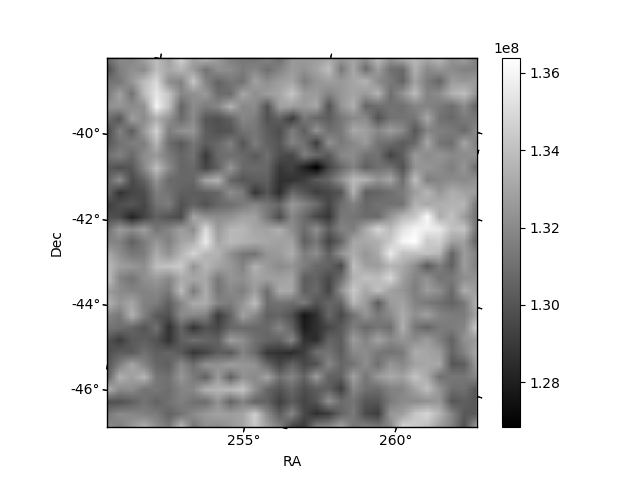
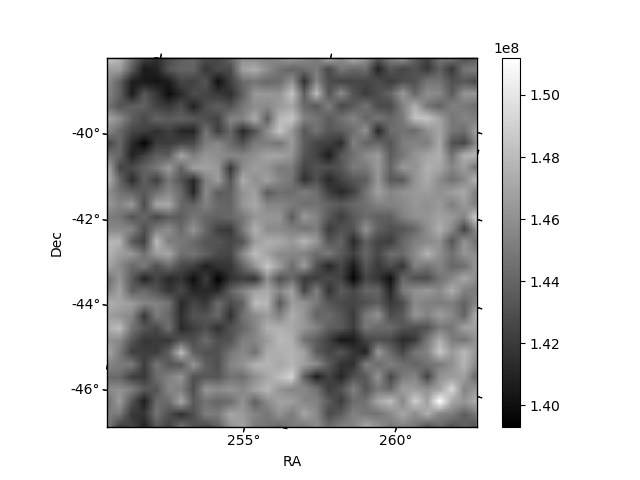
Histogram calculated using DETX and DETY for each event in the final _common_clean file
| Quadrant A | 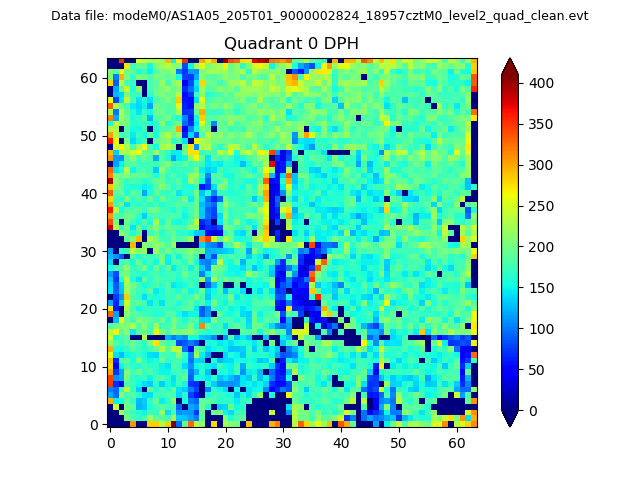 |
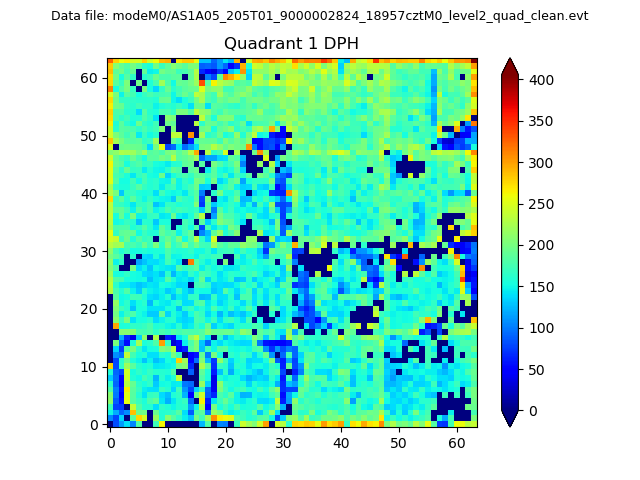 |
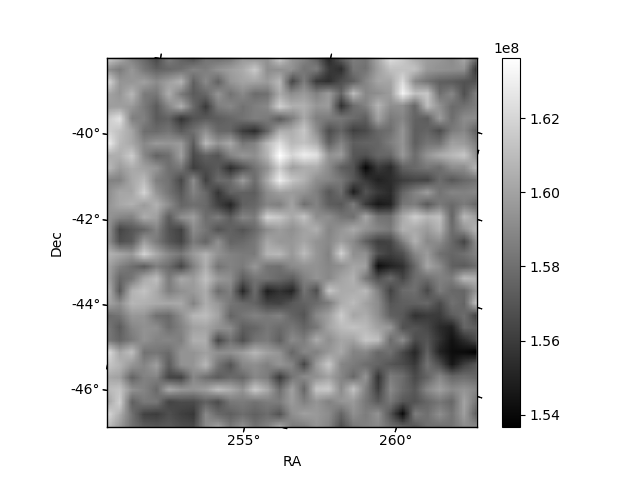
Quadrant B |
|---|---|---|---|
| Quadrant D | 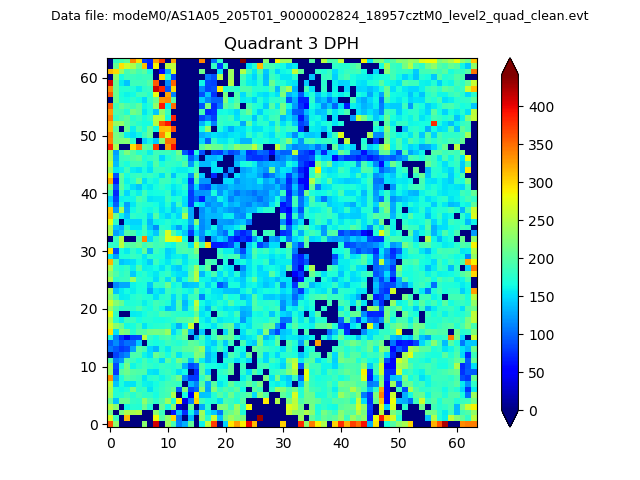 |
 |
Quadrant C |
| Plot type | Count rate plots | Images |
|---|---|---|
| Comparison with Poisson distribution Blue bars denote a histogram of data divided into 1 sec bins. Red curve is a Poisson curve with rate = median count rate of data. |
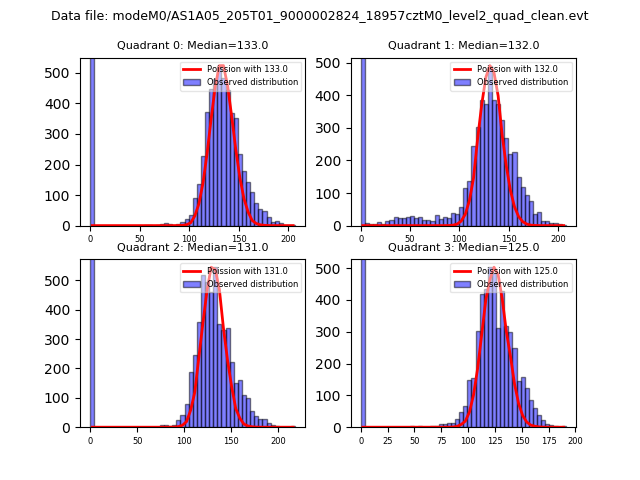 |
 |
| Quadrant-wise count rates Data is divided into 100 sec bins |
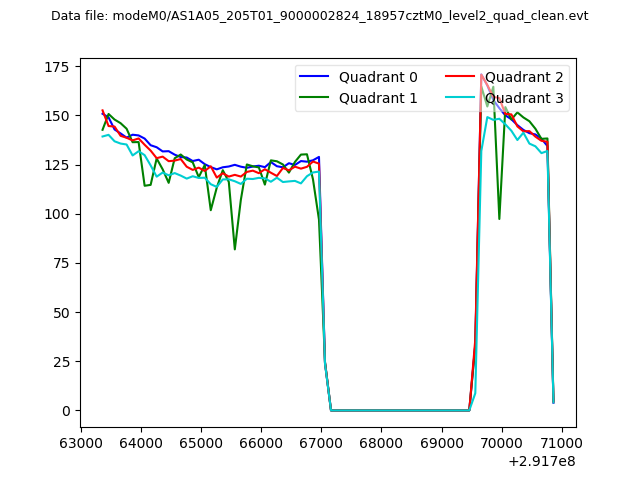 |
|
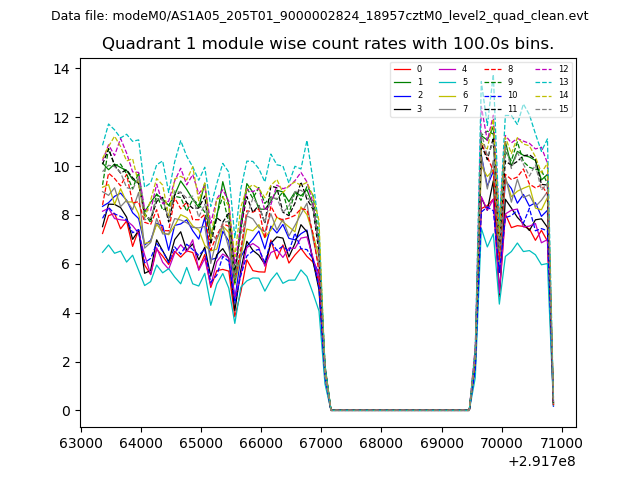
| Module-wise count rates for Quadrant A Data is divided into 100 sec bins |
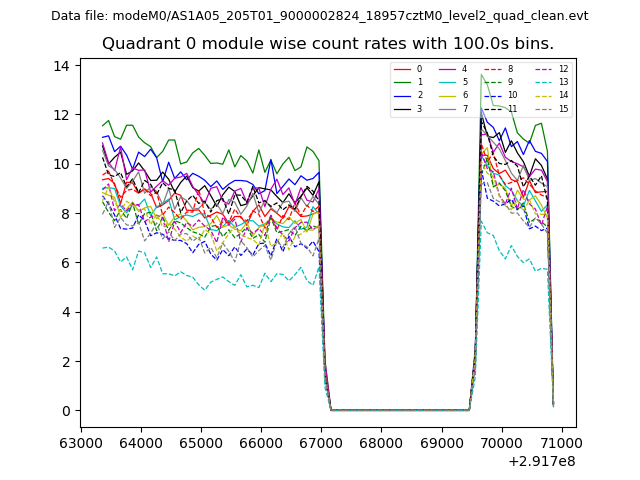 |
 |
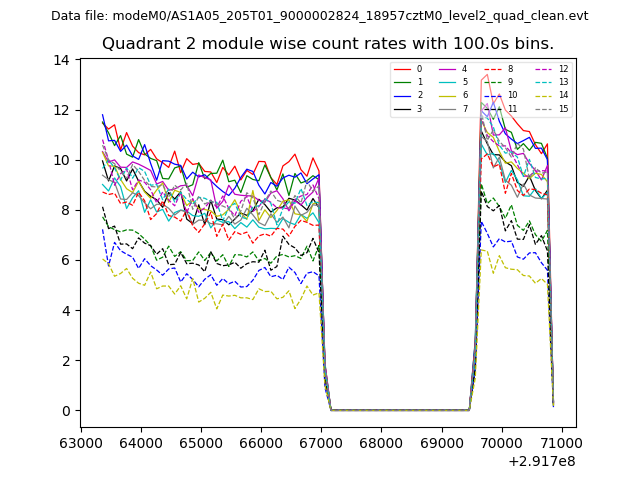
| Module-wise count rates for Quadrant B Data is divided into 100 sec bins |
 |
 |
| Module-wise count rates for Quadrant C Data is divided into 100 sec bins |
 |
 |
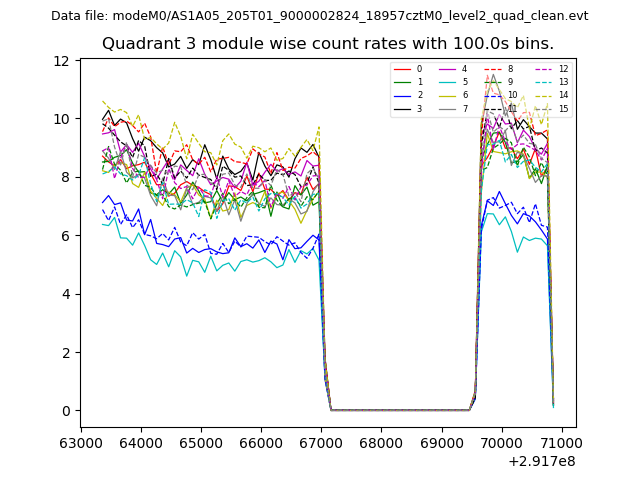
| Module-wise count rates for Quadrant D Data is divided into 100 sec bins |
 |
 |
| Parameter | Plot |
|---|---|
| CZT HV Monitor | 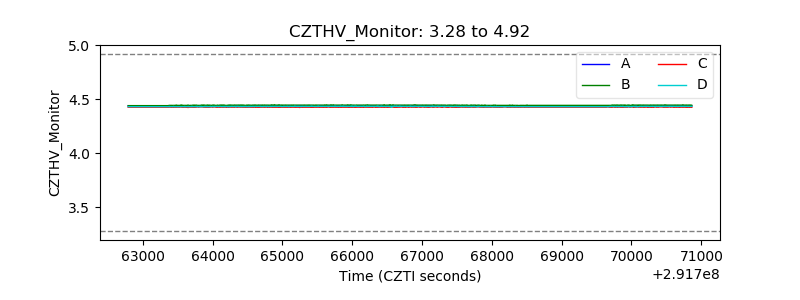 |
| D_VDD | 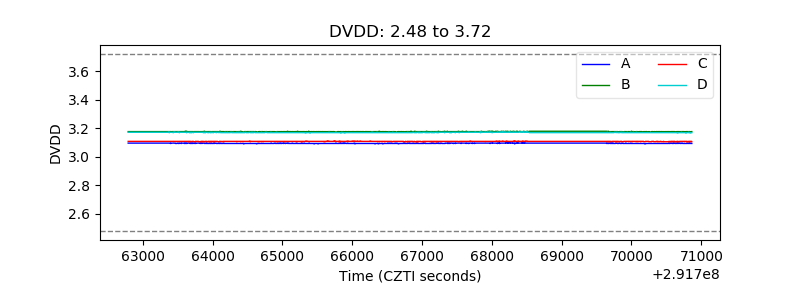 |
| Temperature 1 | 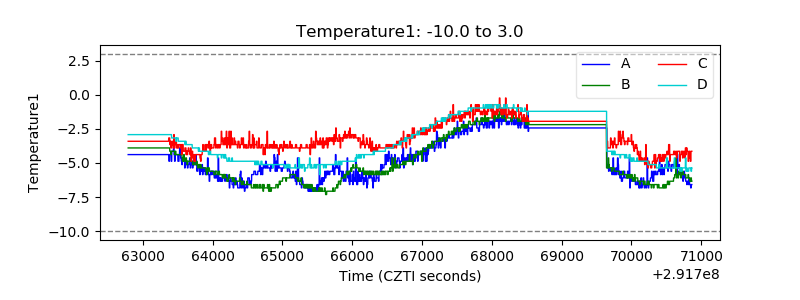 |
| Veto HV Monitor | 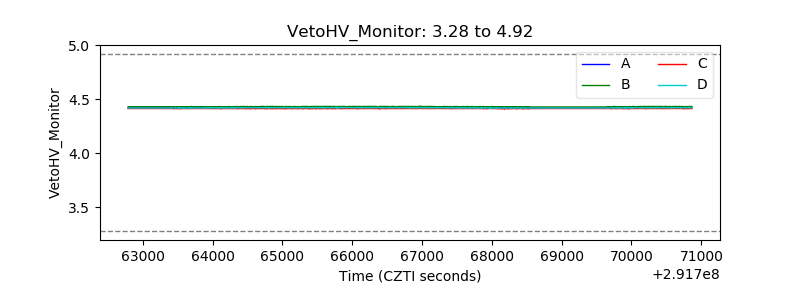 |
| Veto LLD | 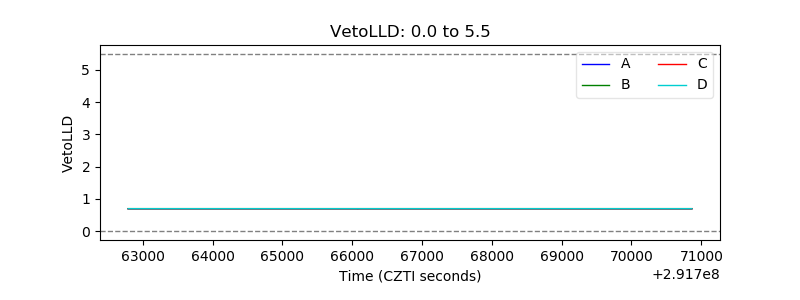 |
| Alpha Counter | 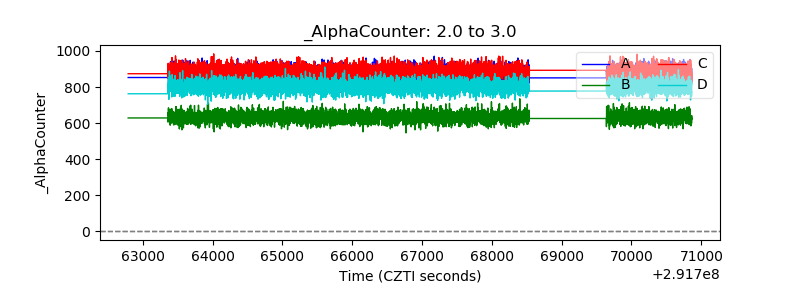 |
| _CPM_Rate | 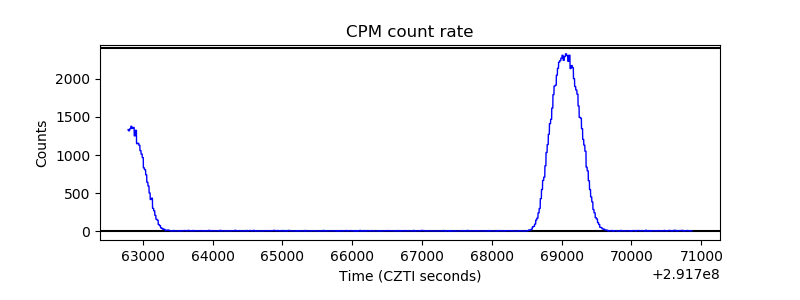 |
| CZT Counter | 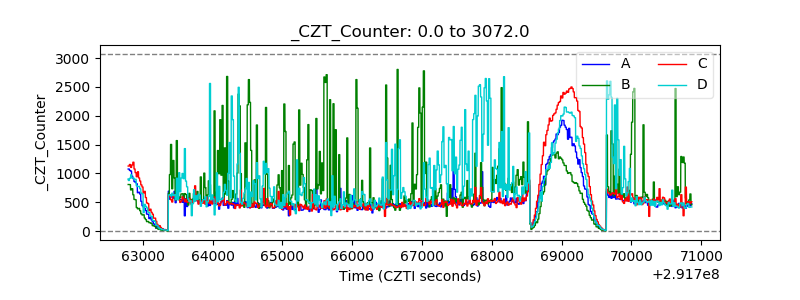 |
| +2.5 Volts monitor |  |
| +5 Volts monitor |  |
| _ROLL_ROT | 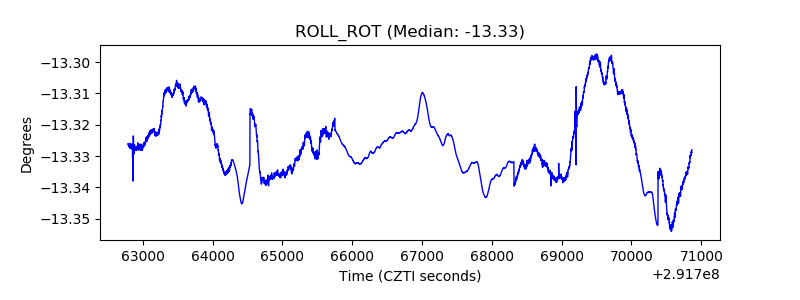 |
| _Roll_DEC | 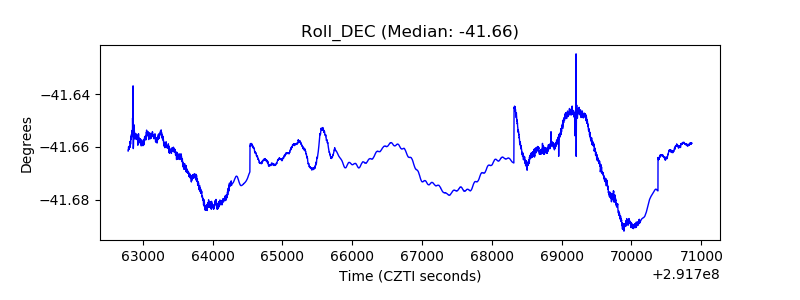 |
| _Roll_RA | 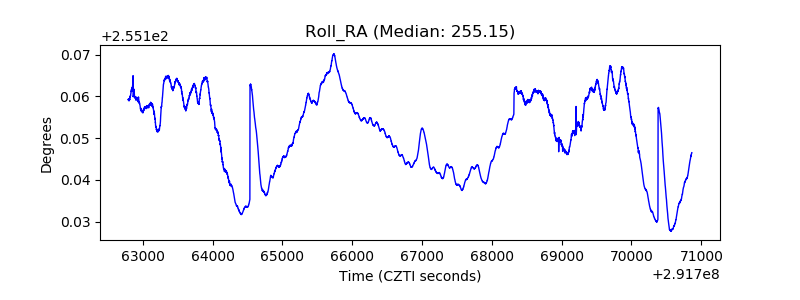 |
| Veto Counter | 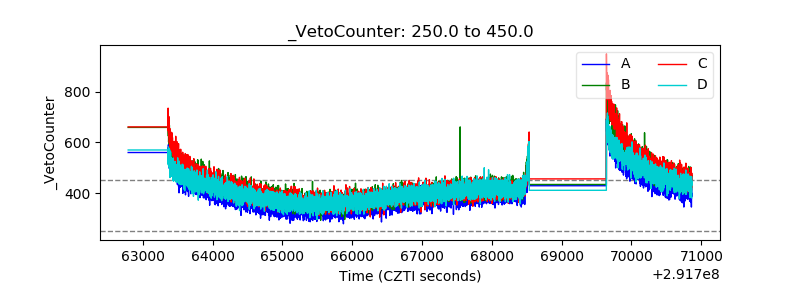 |