| Param | Original file | Final file |
|---|---|---|
| Filename | modeM0/AS1A05_205T01_9000002824_18959cztM0_level2.evt | modeM0/AS1A05_205T01_9000002824_18959cztM0_level2_quad_clean.evt |
| Size (bytes) | 519,310,080 | 106,211,520 |
| Size | 495.3 MB | 101.3 MB |
| Events in quadrant A | 3,238,210 | 698,735 |
| Events in quadrant B | 4,457,200 | 700,642 |
| Events in quadrant C | 3,305,650 | 699,953 |
| Events in quadrant D | 4,278,570 | 657,139 |
| Mode M9 | |||
|---|---|---|---|
| Quadrant | BADHDUFLAG | Total packets | Discarded packets |
| A | 0 | 22 | 0 |
| B | 0 | 23 | 0 |
| C | 0 | 23 | 0 |
| D | 0 | 23 | 0 |
| Mode SS | |||
|---|---|---|---|
| Quadrant | BADHDUFLAG | Total packets | Discarded packets |
| A | 0 | 132 | 0 |
| B | 0 | 132 | 0 |
| C | 0 | 132 | 0 |
| D | 0 | 132 | 0 |
| Mode M0 | |||
|---|---|---|---|
| Quadrant | BADHDUFLAG | Total packets | Discarded packets |
| A | 0 | 13801 | 2 |
| B | 0 | 17554 | 3 |
| C | 0 | 13888 | 2 |
| D | 0 | 17010 | 2 |
| Quadrant | Total seconds | Saturated seconds | Saturation percentage |
|---|---|---|---|
| A | 6605 | 21 | 0.317941% |
| B | 6604 | 342 | 5.178680% |
| C | 6604 | 48 | 0.726832% |
| D | 6604 | 202 | 3.058752% |
Noise dominated data is calculated using 1-second bins in cleaned event files. If a bin has >2000 counts, and if more than 50% of those come from <1% of pixels, then it is considered to be noise-dominated and hence unusable.
| Quadrant | # 1 sec bins | Bins with >0 counts | Bins with >2000 counts | High rate bins dominated by noise | Noise dominated (total time) | Noise dominated (detector-on time) | Marked lightcurve |
|---|---|---|---|---|---|---|---|
| A | 7830 | 6606 | 3 | 3 | 0.04% | 0.05% |  |
| B | 7829 | 6605 | 200 | 200 | 2.55% | 3.03% |  |
| C | 7829 | 6605 | 0 | 0 | 0.00% | 0.00% |  |
| D | 7829 | 6605 | 153 | 153 | 1.95% | 2.32% |  |
Top three noisy pixels from each quadrant. If the there are fewer than three noisy pixels in the level2.evt file, extra rows are filled as -1
| Pixel properties | Quadrant properties | ||||||
|---|---|---|---|---|---|---|---|
| Quadrant | DetID | PixID | Counts | Sigma | Mean | Median | Sigma |
| A | 14 | 235 | 66057 | 393.79 | 824 | 807 | 165.7 |
| A | 0 | 226 | 6967 | 37.18 | 824 | 807 | 165.7 |
| A | 13 | 254 | 6470 | 34.18 | 824 | 807 | 165.7 |
| B | 3 | 112 | 1141235 | 7437.45 | 815 | 794 | 153.3 |
| B | 0 | 189 | 87118 | 562.97 | 815 | 794 | 153.3 |
| B | 7 | 220 | 26559 | 168.03 | 815 | 794 | 153.3 |
| C | 14 | 238 | 128156 | 670.13 | 814 | 820 | 190.0 |
| C | 13 | 61 | 5584 | 25.07 | 814 | 820 | 190.0 |
| C | 6 | 96 | 3589 | 14.57 | 814 | 820 | 190.0 |
| D | 7 | 238 | 886242 | 4583.39 | 798 | 776 | 193.2 |
| D | 1 | 52 | 252529 | 1303.14 | 798 | 776 | 193.2 |
| D | 12 | 218 | 57833 | 295.34 | 798 | 776 | 193.2 |
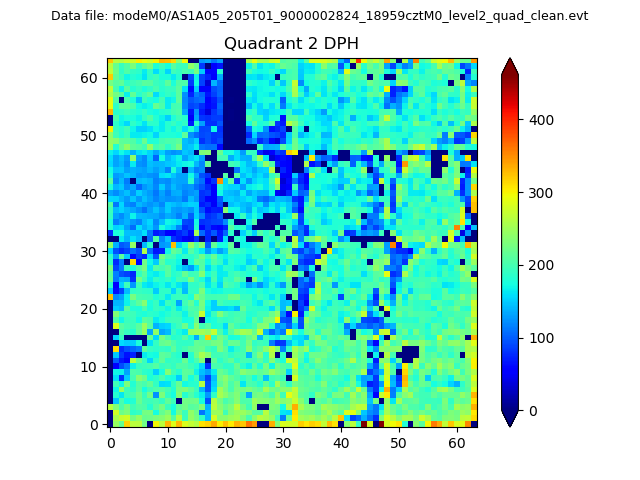
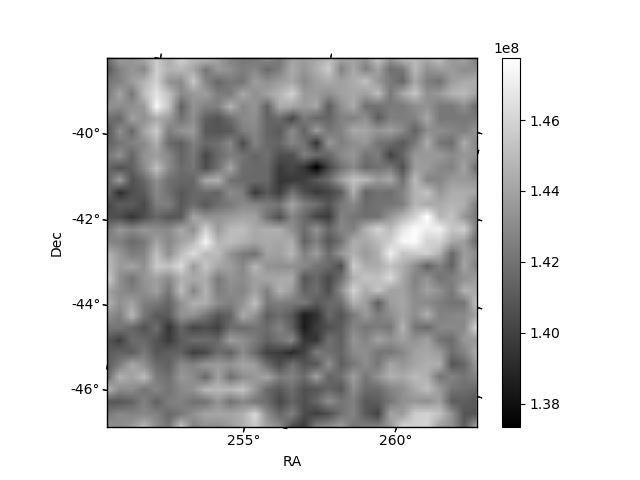
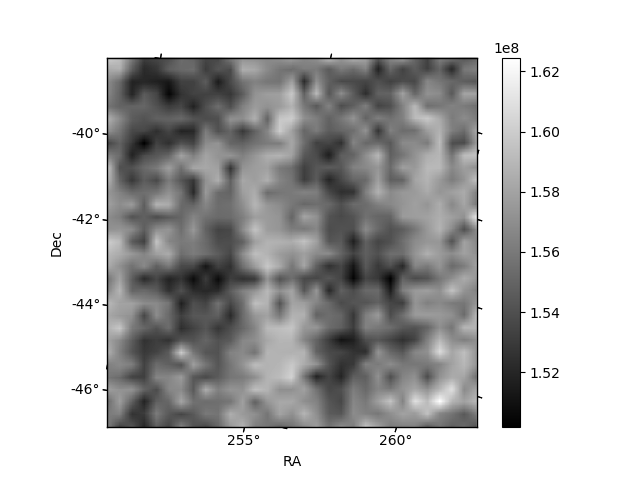
Histogram calculated using DETX and DETY for each event in the final _common_clean file
| Quadrant A |  |
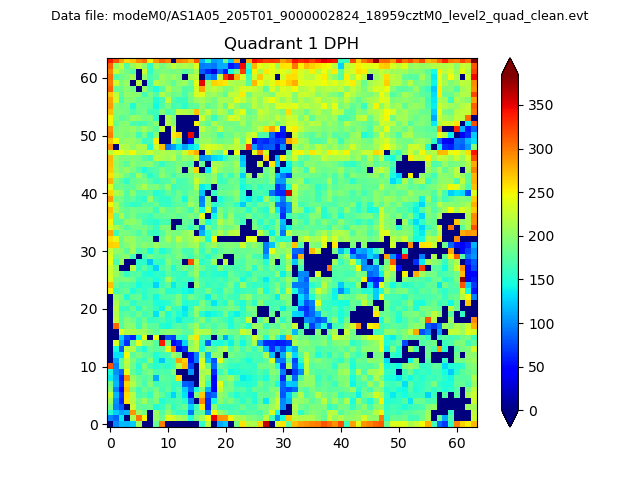 |
Quadrant B |
|---|---|---|---|
| Quadrant D |  |
 |
Quadrant C |
| Plot type | Count rate plots | Images |
|---|---|---|
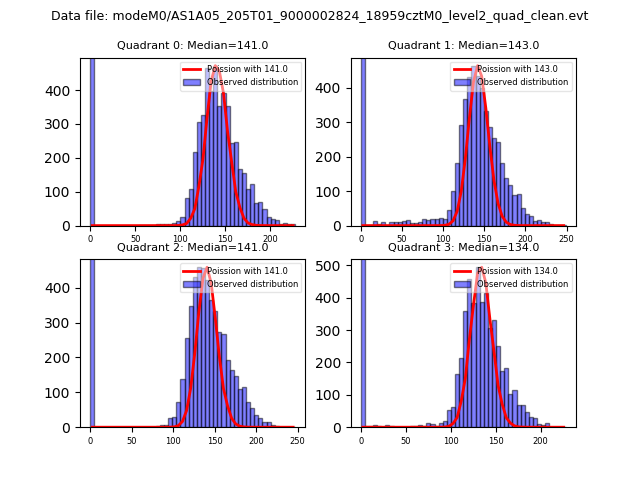
| Comparison with Poisson distribution Blue bars denote a histogram of data divided into 1 sec bins. Red curve is a Poisson curve with rate = median count rate of data. |
 |
 |
| Quadrant-wise count rates Data is divided into 100 sec bins |
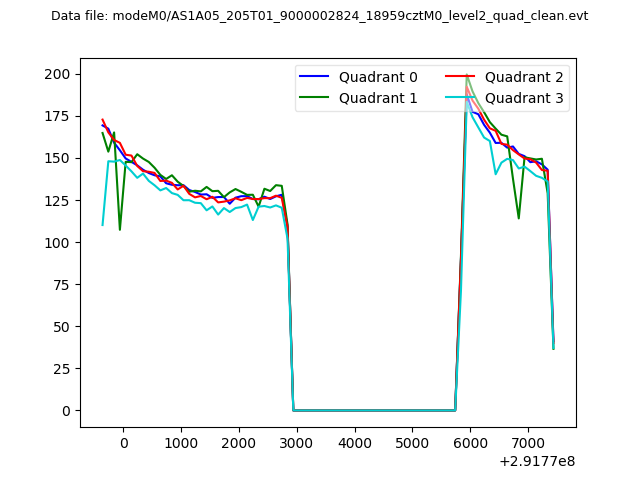 |
|
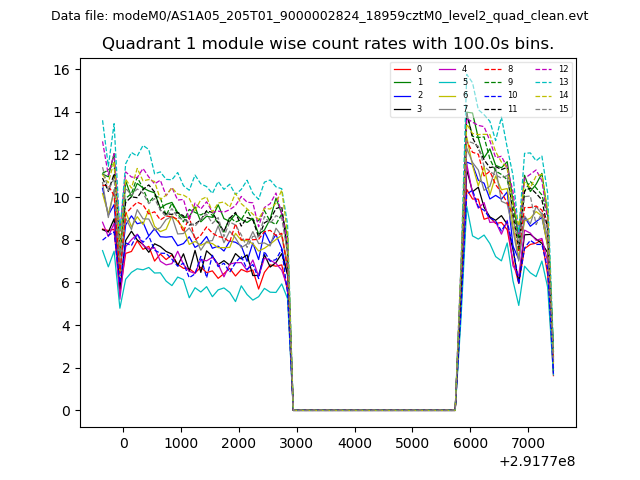
| Module-wise count rates for Quadrant A Data is divided into 100 sec bins |
 |
 |
| Module-wise count rates for Quadrant B Data is divided into 100 sec bins |
 |
 |
| Module-wise count rates for Quadrant C Data is divided into 100 sec bins |
 |
 |
| Module-wise count rates for Quadrant D Data is divided into 100 sec bins |
 |
 |
| Parameter | Plot |
|---|---|
| CZT HV Monitor |  |
| D_VDD | 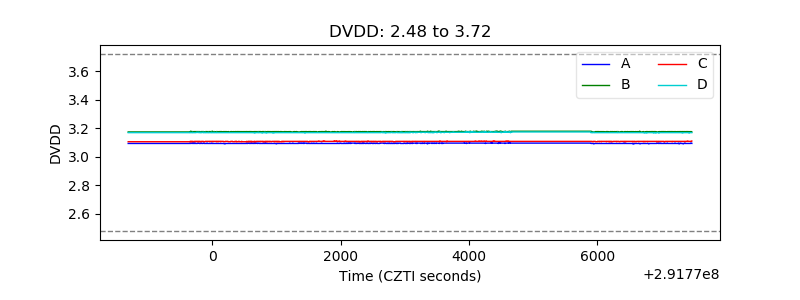 |
| Temperature 1 | 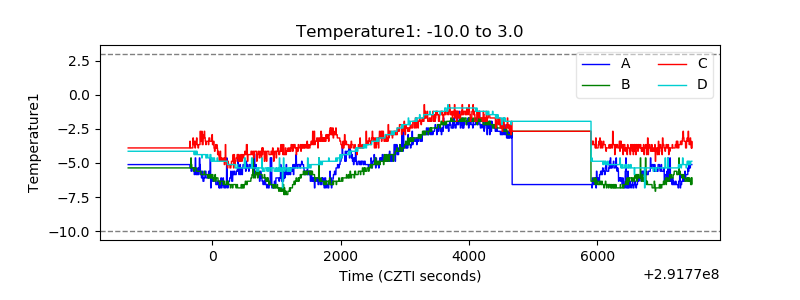 |
| Veto HV Monitor | 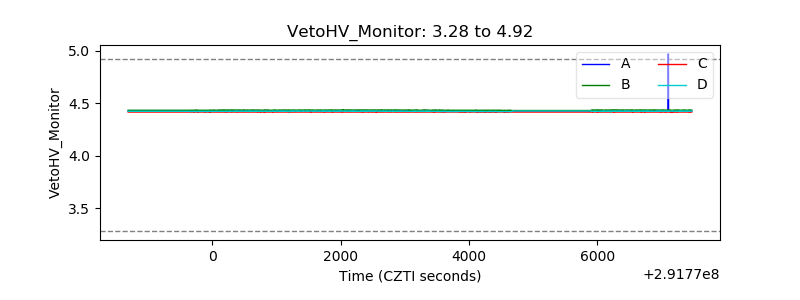 |
| Veto LLD |  |
| Alpha Counter | 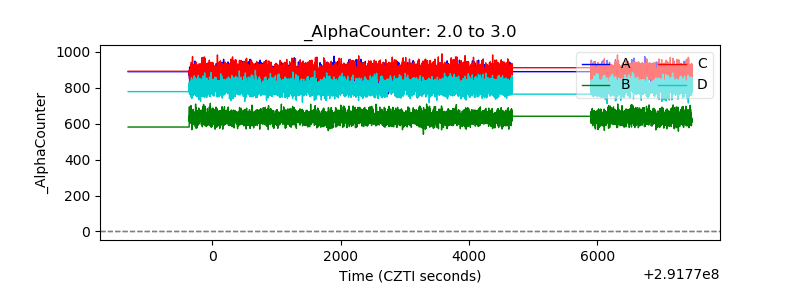 |
| _CPM_Rate | 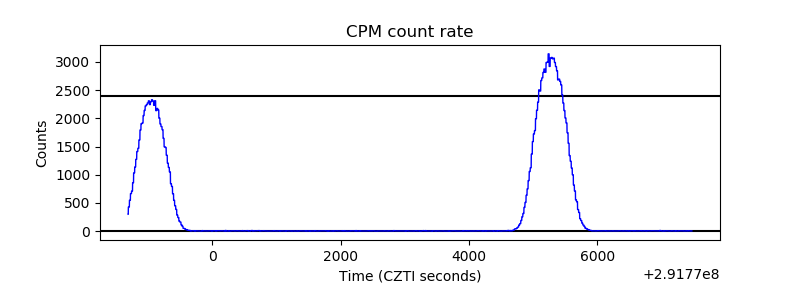 |
| CZT Counter | 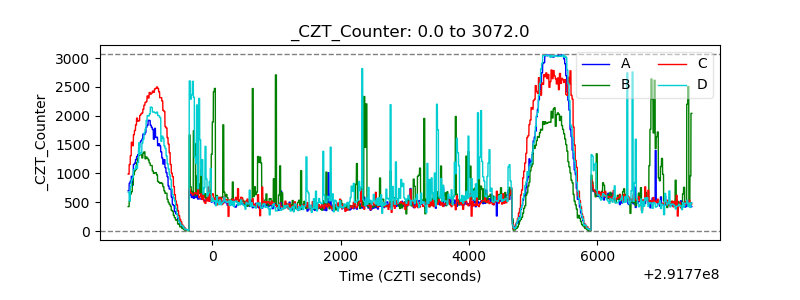 |
| +2.5 Volts monitor |  |
| +5 Volts monitor |  |
| _ROLL_ROT | 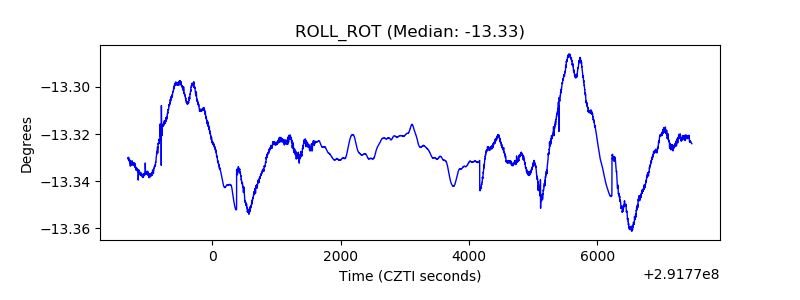 |
| _Roll_DEC | 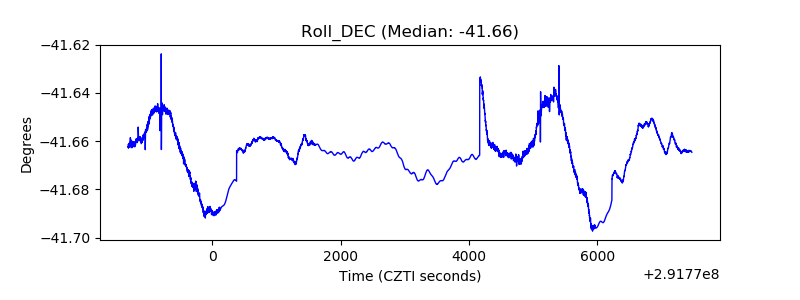 |
| _Roll_RA | 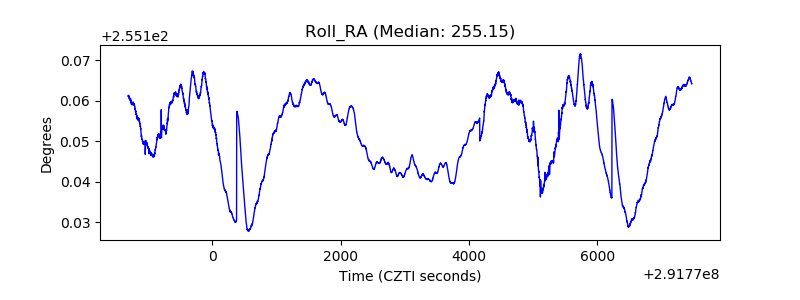 |
| Veto Counter | 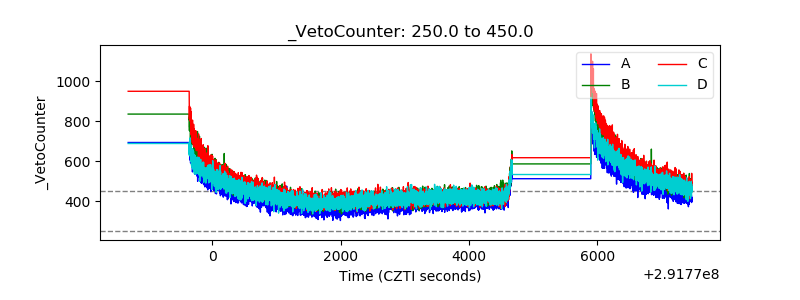 |