| Param | Original file | Final file |
|---|---|---|
| Filename | modeM0/AS1A05_205T01_9000002824_18960cztM0_level2.evt | modeM0/AS1A05_205T01_9000002824_18960cztM0_level2_quad_clean.evt |
| Size (bytes) | 573,785,280 | 105,327,360 |
| Size | 547.2 MB | 100.4 MB |
| Events in quadrant A | 3,328,641 | 696,885 |
| Events in quadrant B | 6,369,509 | 672,580 |
| Events in quadrant C | 3,447,523 | 701,065 |
| Events in quadrant D | 3,789,292 | 663,923 |
| Mode M9 | |||
|---|---|---|---|
| Quadrant | BADHDUFLAG | Total packets | Discarded packets |
| A | 0 | 15 | 0 |
| B | 0 | 16 | 0 |
| C | 0 | 16 | 0 |
| D | 0 | 16 | 0 |
| Mode SS | |||
|---|---|---|---|
| Quadrant | BADHDUFLAG | Total packets | Discarded packets |
| A | 0 | 132 | 0 |
| B | 0 | 132 | 0 |
| C | 0 | 132 | 0 |
| D | 0 | 132 | 0 |
| Mode M0 | |||
|---|---|---|---|
| Quadrant | BADHDUFLAG | Total packets | Discarded packets |
| A | 0 | 13821 | 2 |
| B | 0 | 23323 | 2 |
| C | 0 | 14158 | 2 |
| D | 0 | 15368 | 2 |
| Quadrant | Total seconds | Saturated seconds | Saturation percentage |
|---|---|---|---|
| A | 6528 | 34 | 0.520833% |
| B | 6528 | 1030 | 15.778186% |
| C | 6528 | 71 | 1.087623% |
| D | 6527 | 112 | 1.715949% |
Noise dominated data is calculated using 1-second bins in cleaned event files. If a bin has >2000 counts, and if more than 50% of those come from <1% of pixels, then it is considered to be noise-dominated and hence unusable.
| Quadrant | # 1 sec bins | Bins with >0 counts | Bins with >2000 counts | High rate bins dominated by noise | Noise dominated (total time) | Noise dominated (detector-on time) | Marked lightcurve |
|---|---|---|---|---|---|---|---|
| A | 7798 | 6529 | 0 | 0 | 0.00% | 0.00% | 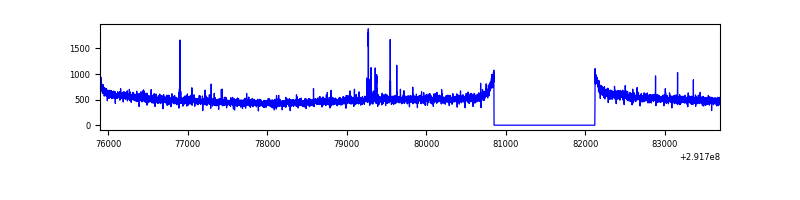 |
| B | 7798 | 6529 | 669 | 669 | 8.58% | 10.25% | 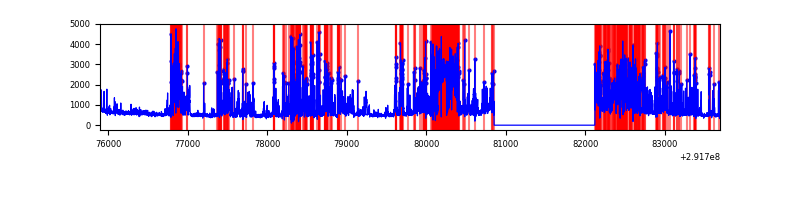 |
| C | 7798 | 6529 | 0 | 0 | 0.00% | 0.00% | 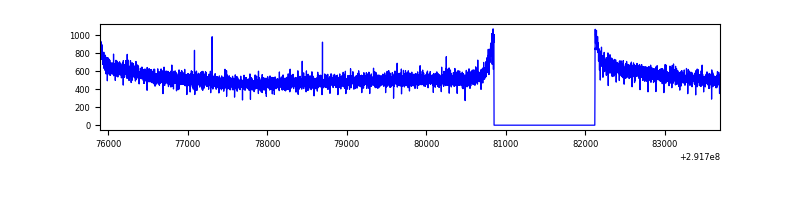 |
| D | 7797 | 6528 | 65 | 65 | 0.83% | 1.00% | 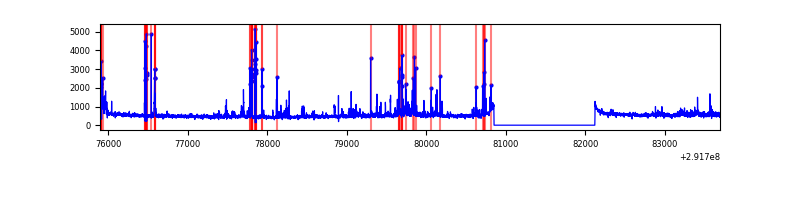 |
Top three noisy pixels from each quadrant. If the there are fewer than three noisy pixels in the level2.evt file, extra rows are filled as -1
| Pixel properties | Quadrant properties | ||||||
|---|---|---|---|---|---|---|---|
| Quadrant | DetID | PixID | Counts | Sigma | Mean | Median | Sigma |
| A | 14 | 235 | 36332 | 207.56 | 853 | 835 | 171.0 |
| A | 0 | 226 | 7316 | 37.9 | 853 | 835 | 171.0 |
| A | 3 | 137 | 6180 | 31.25 | 853 | 835 | 171.0 |
| B | 3 | 112 | 3059619 | 20584.18 | 801 | 781 | 148.6 |
| B | 0 | 189 | 89246 | 595.32 | 801 | 781 | 148.6 |
| B | 7 | 220 | 70216 | 467.26 | 801 | 781 | 148.6 |
| C | 14 | 238 | 129762 | 650.44 | 850 | 860 | 198.2 |
| C | 13 | 61 | 5960 | 25.73 | 850 | 860 | 198.2 |
| C | 6 | 96 | 2568 | 8.62 | 850 | 860 | 198.2 |
| D | 1 | 52 | 250467 | 1237.16 | 840 | 819 | 201.8 |
| D | 12 | 218 | 158835 | 783.07 | 840 | 819 | 201.8 |
| D | 7 | 238 | 150341 | 740.97 | 840 | 819 | 201.8 |
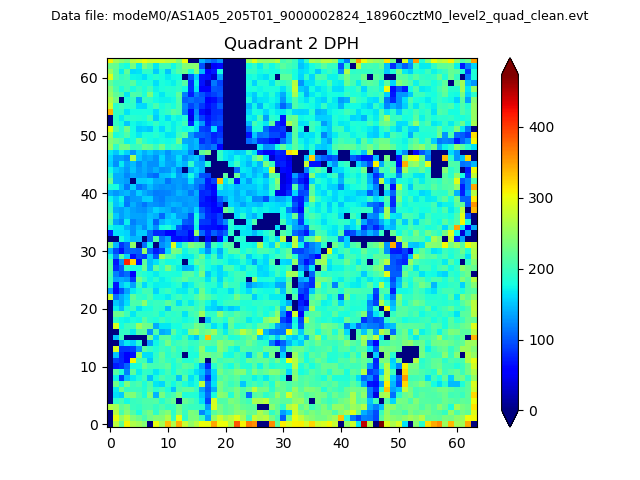
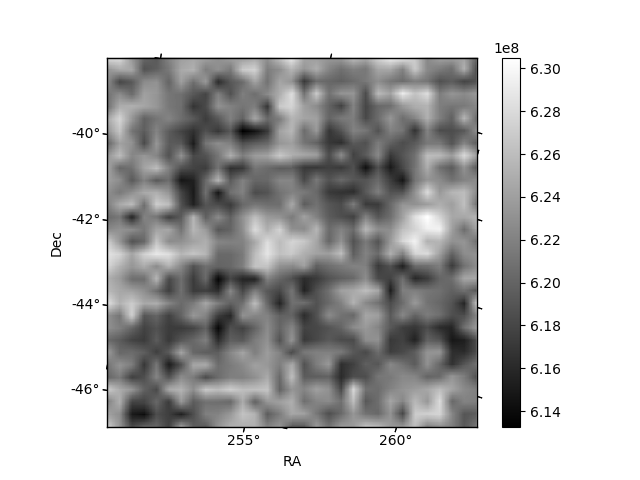
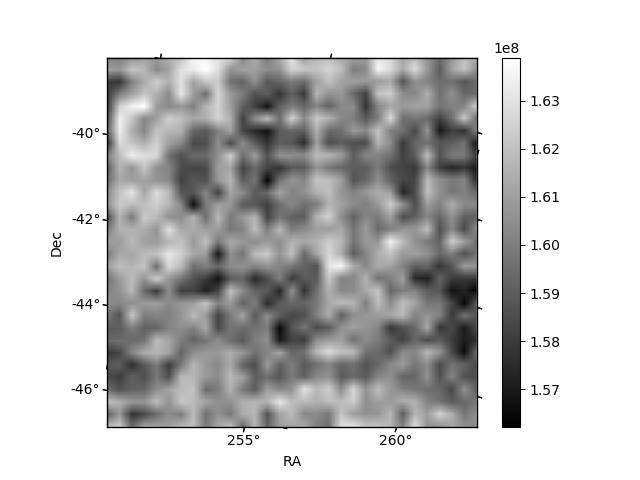
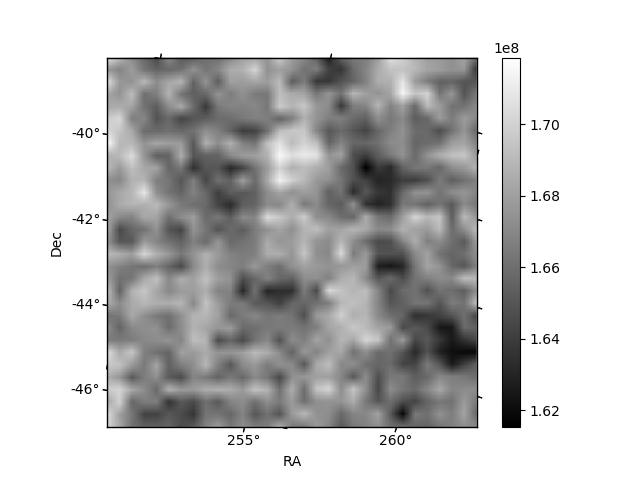
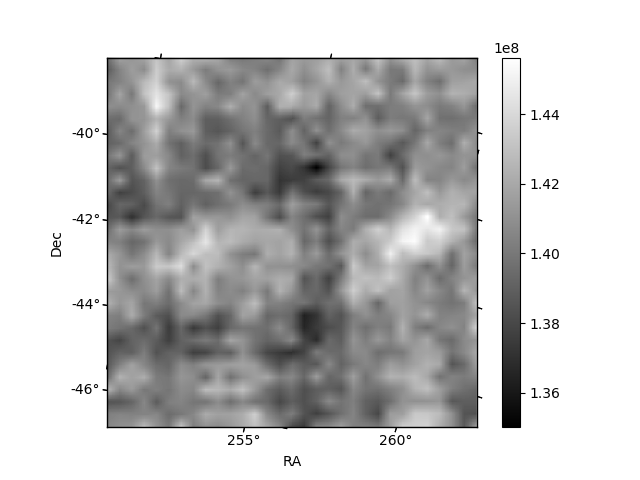
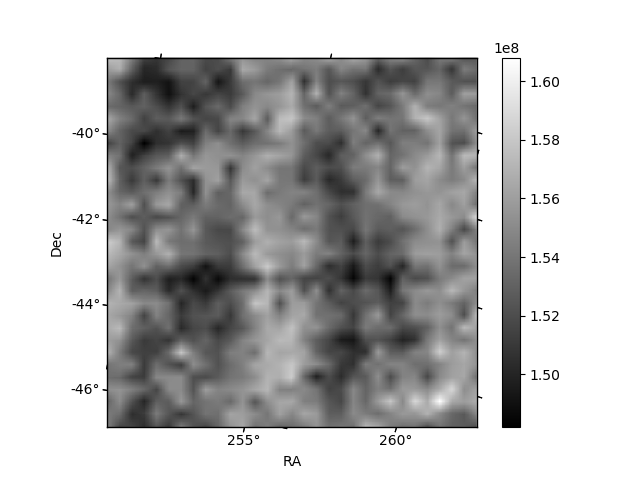
Histogram calculated using DETX and DETY for each event in the final _common_clean file
| Quadrant A | 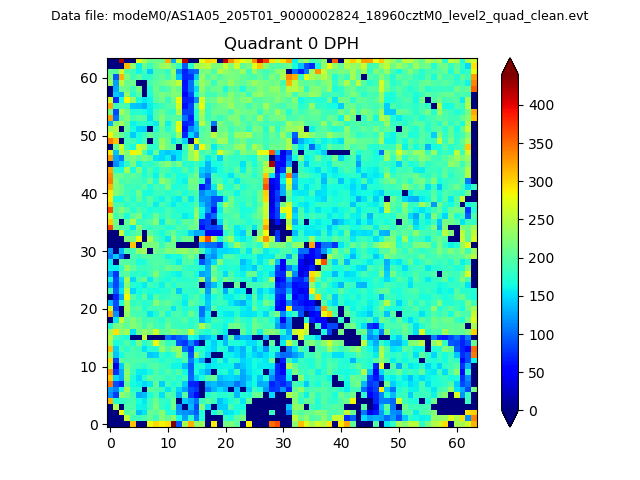 |
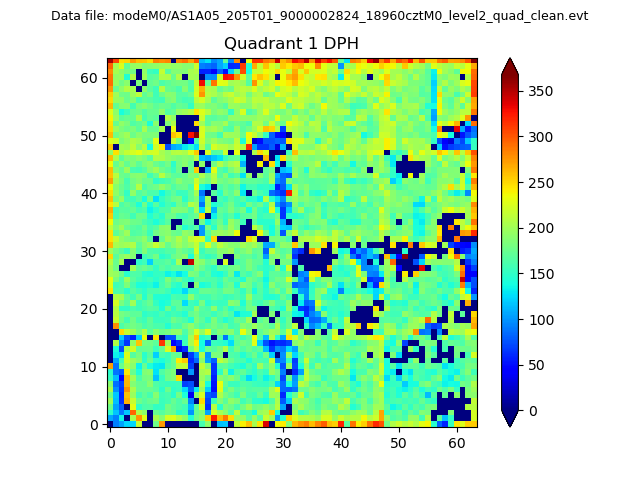 |
Quadrant B |
|---|---|---|---|
| Quadrant D | 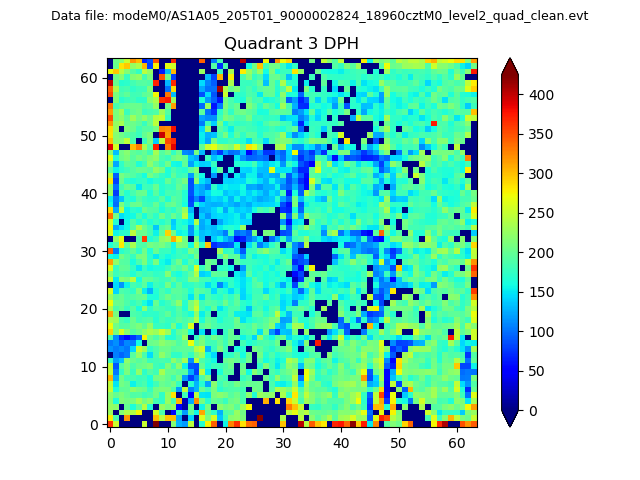 |
 |
Quadrant C |
| Plot type | Count rate plots | Images |
|---|---|---|
| Comparison with Poisson distribution Blue bars denote a histogram of data divided into 1 sec bins. Red curve is a Poisson curve with rate = median count rate of data. |
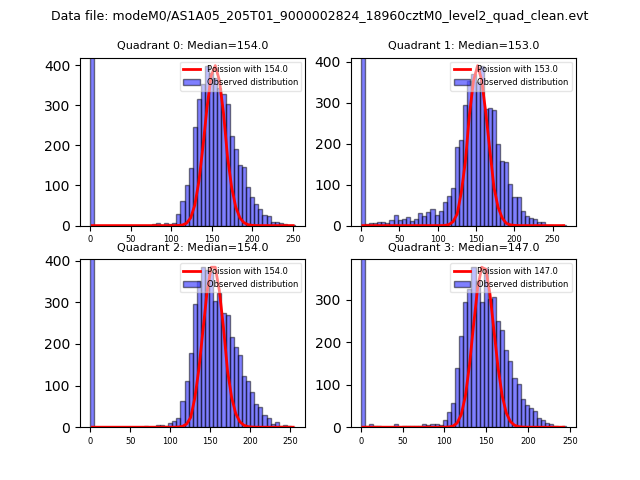 |
 |
| Quadrant-wise count rates Data is divided into 100 sec bins |
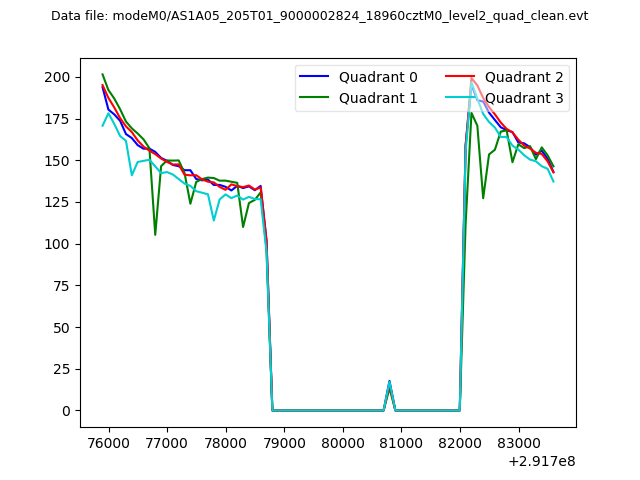 |
|
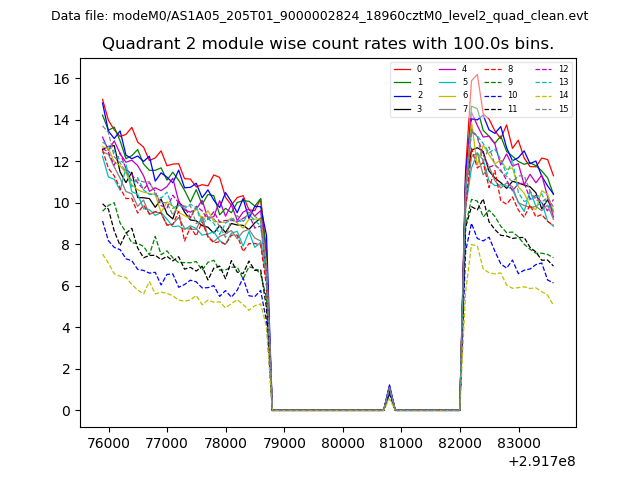
| Module-wise count rates for Quadrant A Data is divided into 100 sec bins |
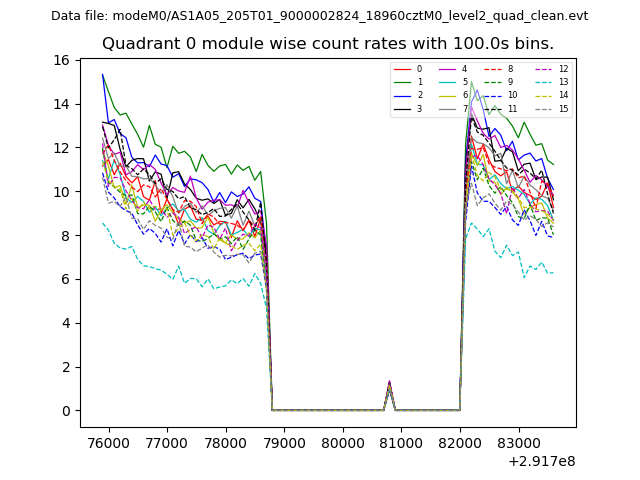 |
 |
| Module-wise count rates for Quadrant B Data is divided into 100 sec bins |
 |
 |
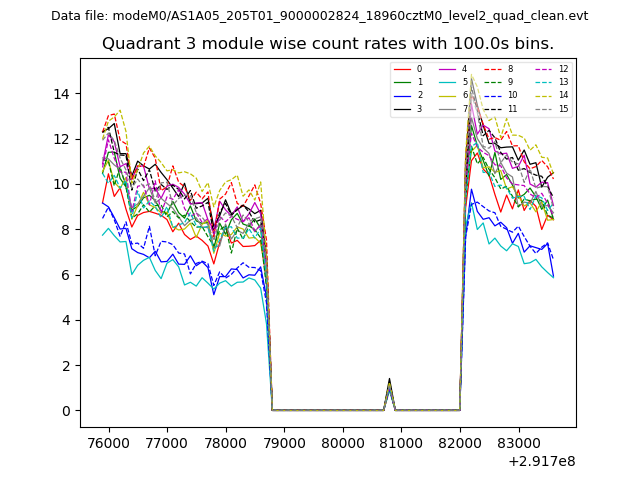
| Module-wise count rates for Quadrant C Data is divided into 100 sec bins |
 |
 |
| Module-wise count rates for Quadrant D Data is divided into 100 sec bins |
 |
 |
| Parameter | Plot |
|---|---|
| CZT HV Monitor | 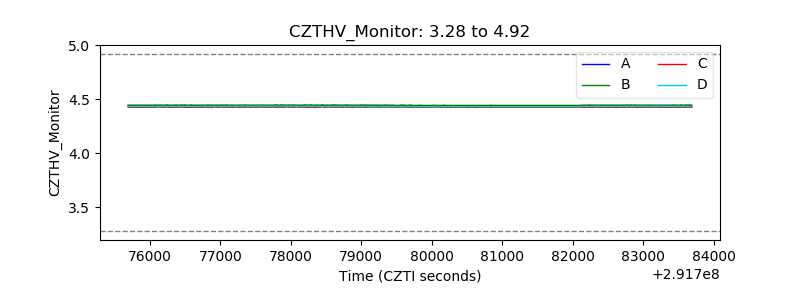 |
| D_VDD | 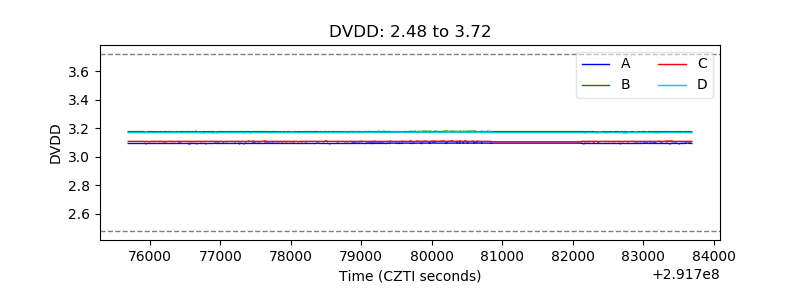 |
| Temperature 1 | 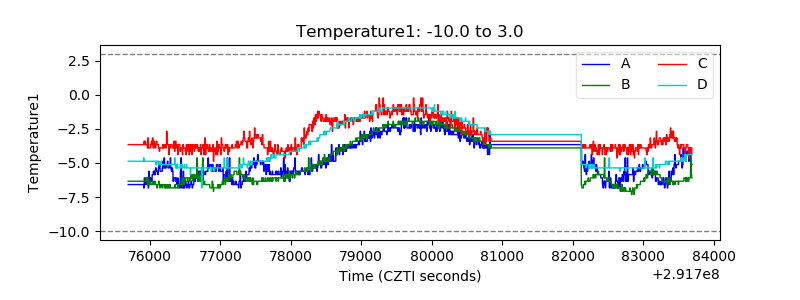 |
| Veto HV Monitor | 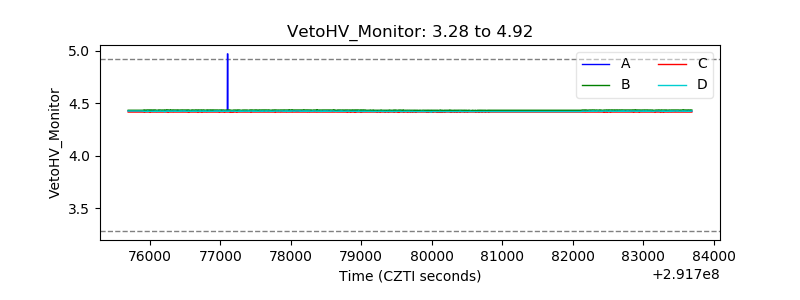 |
| Veto LLD |  |
| Alpha Counter | 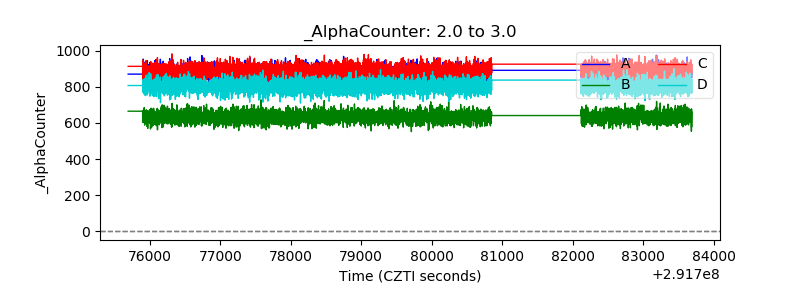 |
| _CPM_Rate | 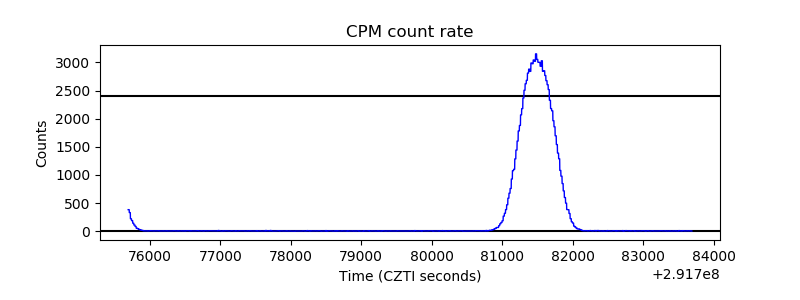 |
| CZT Counter | 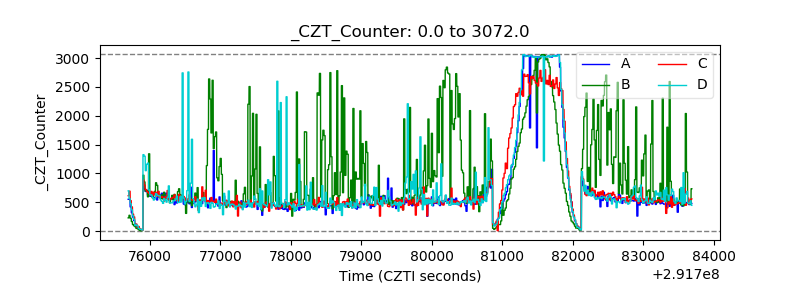 |
| +2.5 Volts monitor |  |
| +5 Volts monitor | 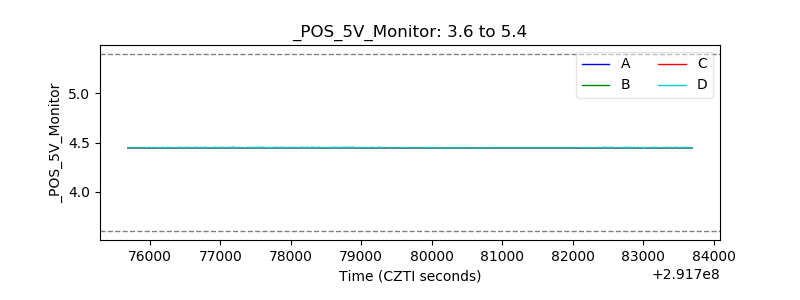 |
| _ROLL_ROT | 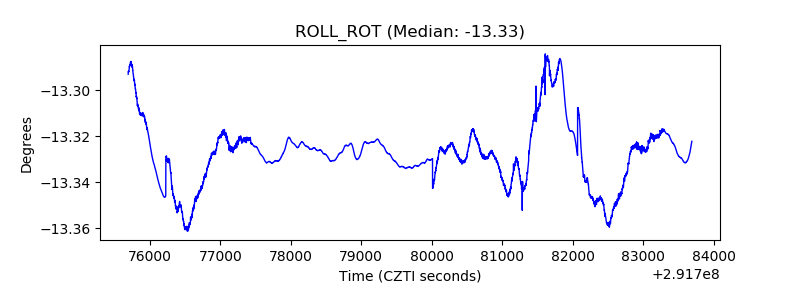 |
| _Roll_DEC | 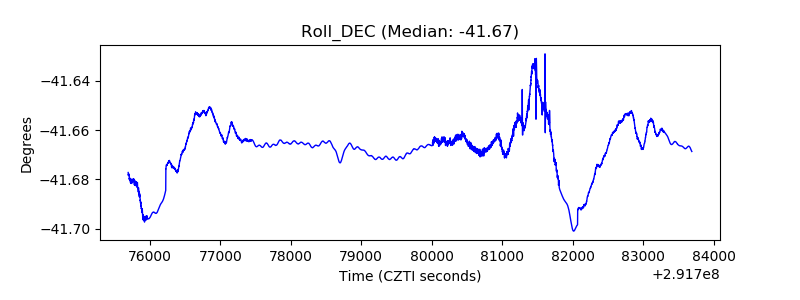 |
| _Roll_RA | 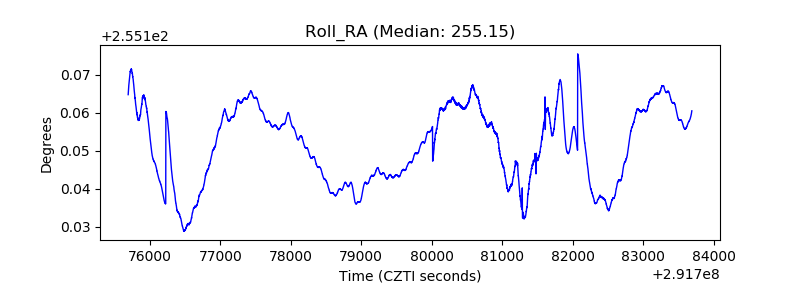 |
| Veto Counter |  |